Stratégie de cassure de la moyenne mobile double basée sur la volatilité des prix

Aperçu
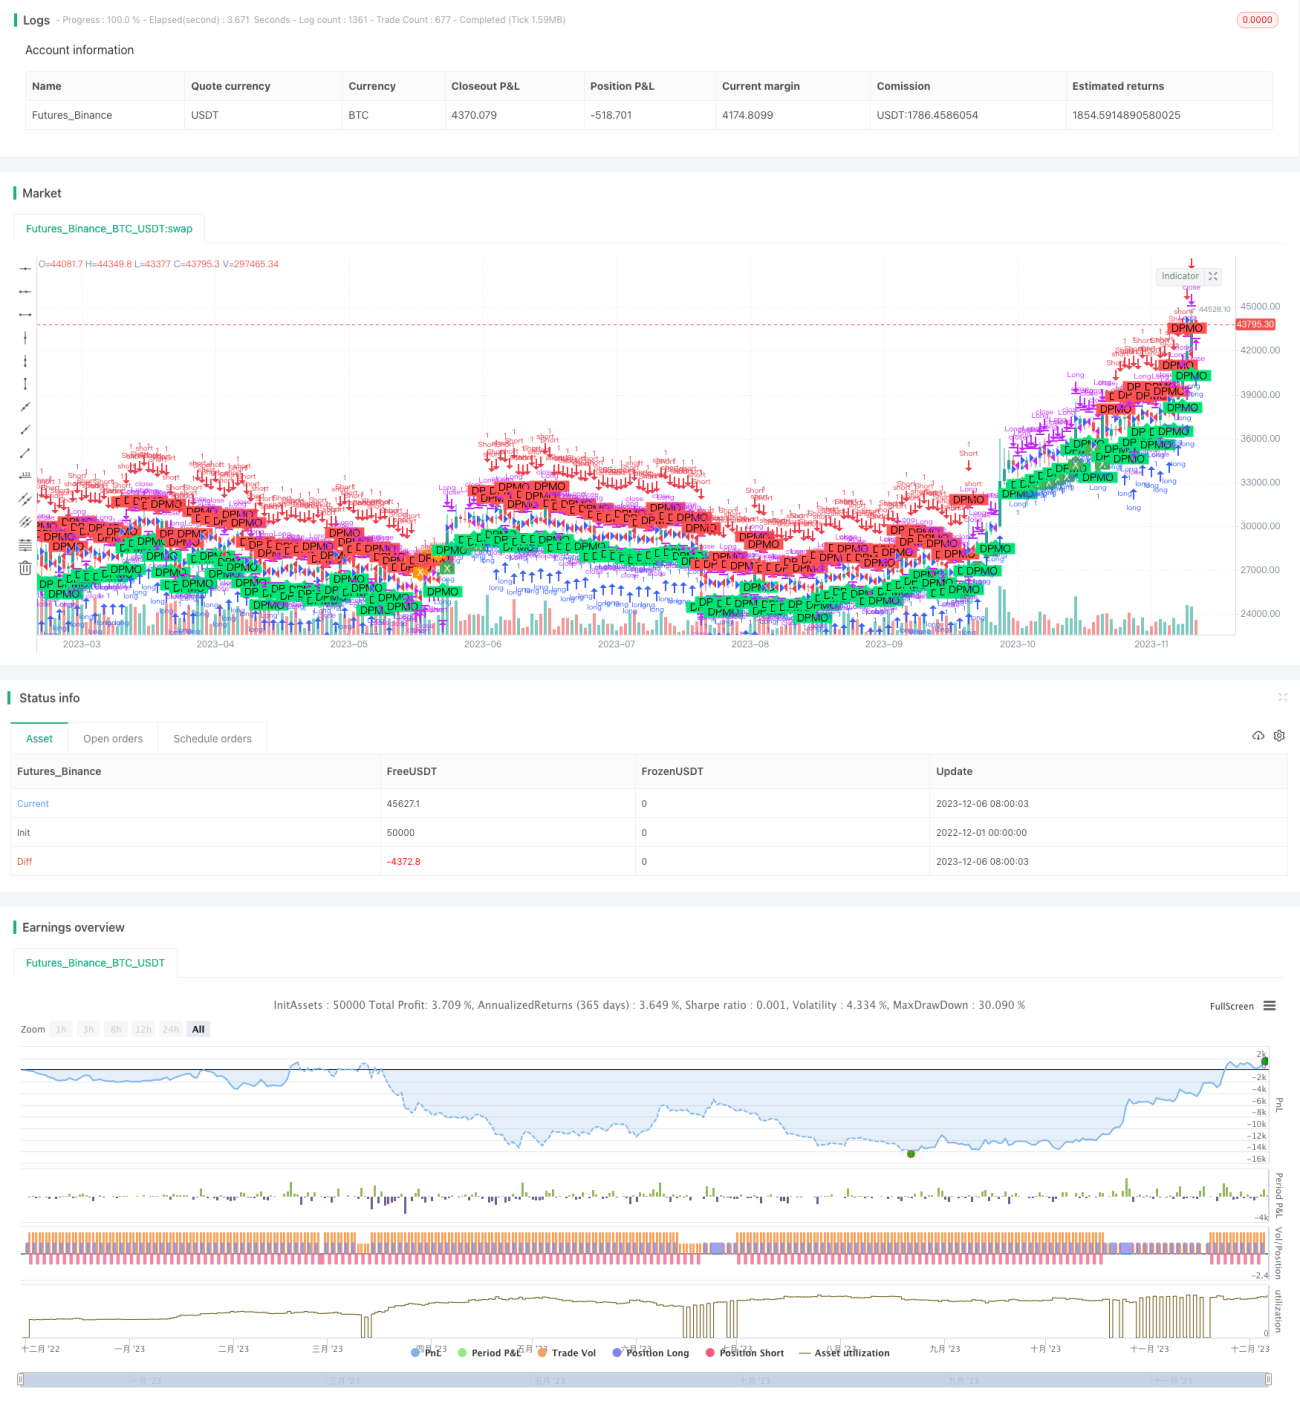
L'idée centrale de cette stratégie est d'utiliser la volatilité des prix pour juger de la tendance du marché. Lorsque la volatilité augmente, le marché est en train de former une nouvelle tendance. Lorsque la volatilité diminue, la tendance actuelle est terminée.
Principe de stratégie
La stratégie commence par calculer le pourcentage de variation du prix:
i=(src/nz(src[1], src))*100
Ensuite, un filtrage moyen de longueur 35 est effectué pour obtenir l'indicateur de volatilité primaire pmol2 ≠ 2. Puis, un filtrage secondaire est effectué sur pmol2 par un filtrage moyen de longueur 20 pour obtenir l'indicateur de volatilité finale pmol ≠ 3. Enfin, un filtrage moyen de longueur 10 est effectué pour obtenir le filtrage de signal pmols ≠ 3. Lorsque le pmol est traversé par le pmols, un signal d'achat est généré.
Analyse des avantages
- Le filtrage bi-homogène permet de mieux extraire les fluctuations des prix et de filtrer le bruit.
- Le calcul des variations en pourcentage des prix permet d'amplifier les variations de prix et de refléter plus clairement les changements de tendance.
- Le mode de profit est assez clair: la tendance commence par l'achat, la tendance finit par la vente.
Analyse des risques
- Le filtrage bi-univoque entraîne un certain retard.
- La méthode de calcul des variations en pourcentage est plus sensible à l'amplitude des prix.
- Le changement de position doit être effectué dans les délais.
Les directions d'optimisation
- Optimiser les paramètres de la ligne moyenne pour mieux saisir les tendances.
- Essayez différentes méthodes pour calculer la variation des prix.
- Les conditions de filtrage ont été ajoutées pour éviter les faux signaux.
Résumer
Cette stratégie est une stratégie de type indicateur technique plus mature, qui extrait les fluctuations des prix et juge les changements de tendance du marché en calculant les variations en pourcentage et le filtrage bihomogène. La stratégie a une forte capacité à capturer les tendances, mais sa capacité à identifier les points de conversion en général.
- 1