Stratégie de trading d'indices forts axée sur la double bande
Date de création:
2023-12-12 17:12:35
Dernière modification:
2023-12-12 17:47:33
Copier:
1
Nombre de clics:
1068
1
Suivre
1750
Abonnés
Aperçu
Cette stratégie combine les indicateurs de deux bandes d’ondes et l’indice de force pour réaliser un modèle de négociation de rupture. Lorsque l’EMA rapide brise le canal de la bande d’ondes, le signal de direction polyvalent combiné à celui de l’indicateur AO génère des signaux d’achat et de vente.
Principe de stratégie
- Les canaux de tarification sont déterminés par le métro, le haut et le bas des voies utilisant les bandes de Brin.
- L’EMA rapide est considérée comme une brèche de passage lorsqu’elle traverse l’orbite centrale.
- L’indicateur de force AO détermine la direction des têtes multiples et des têtes vides.
- Un signal d’achat est généré lorsque l’EMA rapide franchit la voie médiane vers le haut et que l’AO est positive.
- Un signal de vente est généré lorsque l’EMA rapide dépasse le milieu de la trajectoire vers le bas et que l’AO est négatif.
Analyse des avantages
- L’indicateur à double bande détermine le canal de prix et évite les faux signaux.
- L’indicateur AO détermine la direction de la tendance, ce qui rend les signaux de trading plus précis.
- Le modèle de négociation combiné à la rupture de la chaîne permet de capturer plus de profit au début de la tendance.
Analyse des risques
- Un paramètre de la bande de Bryn incorrect peut entraîner un passage trop large ou trop étroit.
- Le paramètre de l’indicateur AO affecte la précision du jugement.
- Les signaux de percée peuvent être faux et il faut s’assurer qu’il y a suffisamment de force de percée.
Comment faire ?
- Optimiser les paramètres de la bande de Bryn et de l’indicateur AO pour trouver la meilleure combinaison.
- Augmentation des conditions de force de rupture pour éviter les fausses ruptures.
- Utilisation en combinaison avec d’autres indicateurs pour assurer la fiabilité des signaux de négociation.
Direction d’optimisation
- Optimiser les paramètres de la ceinture de broyage pour trouver la portée de passage la plus appropriée.
- Optimiser les paramètres de la moyenne à long terme de l’indicateur AO pour améliorer l’exactitude des jugements.
- Augmenter le volume ou d’autres indicateurs de filtrage pour assurer la fiabilité de la percée.
- Optimiser les paramètres de force de rupture et réduire le taux de fausse rupture.
Résumer
Cette stratégie intégrée prend en compte les canaux de prix, la direction de la tendance et le mode de rupture, une stratégie de négociation plus stable et plus efficace. La stabilité et le rendement de la stratégie peuvent être encore améliorés par l’optimisation des paramètres et le filtrage des indicateurs combinés. Son mode de négociation de rupture peut capturer les premières opportunités de tendance et a une grande valeur pratique.
Code source de la stratégie
/*backtest
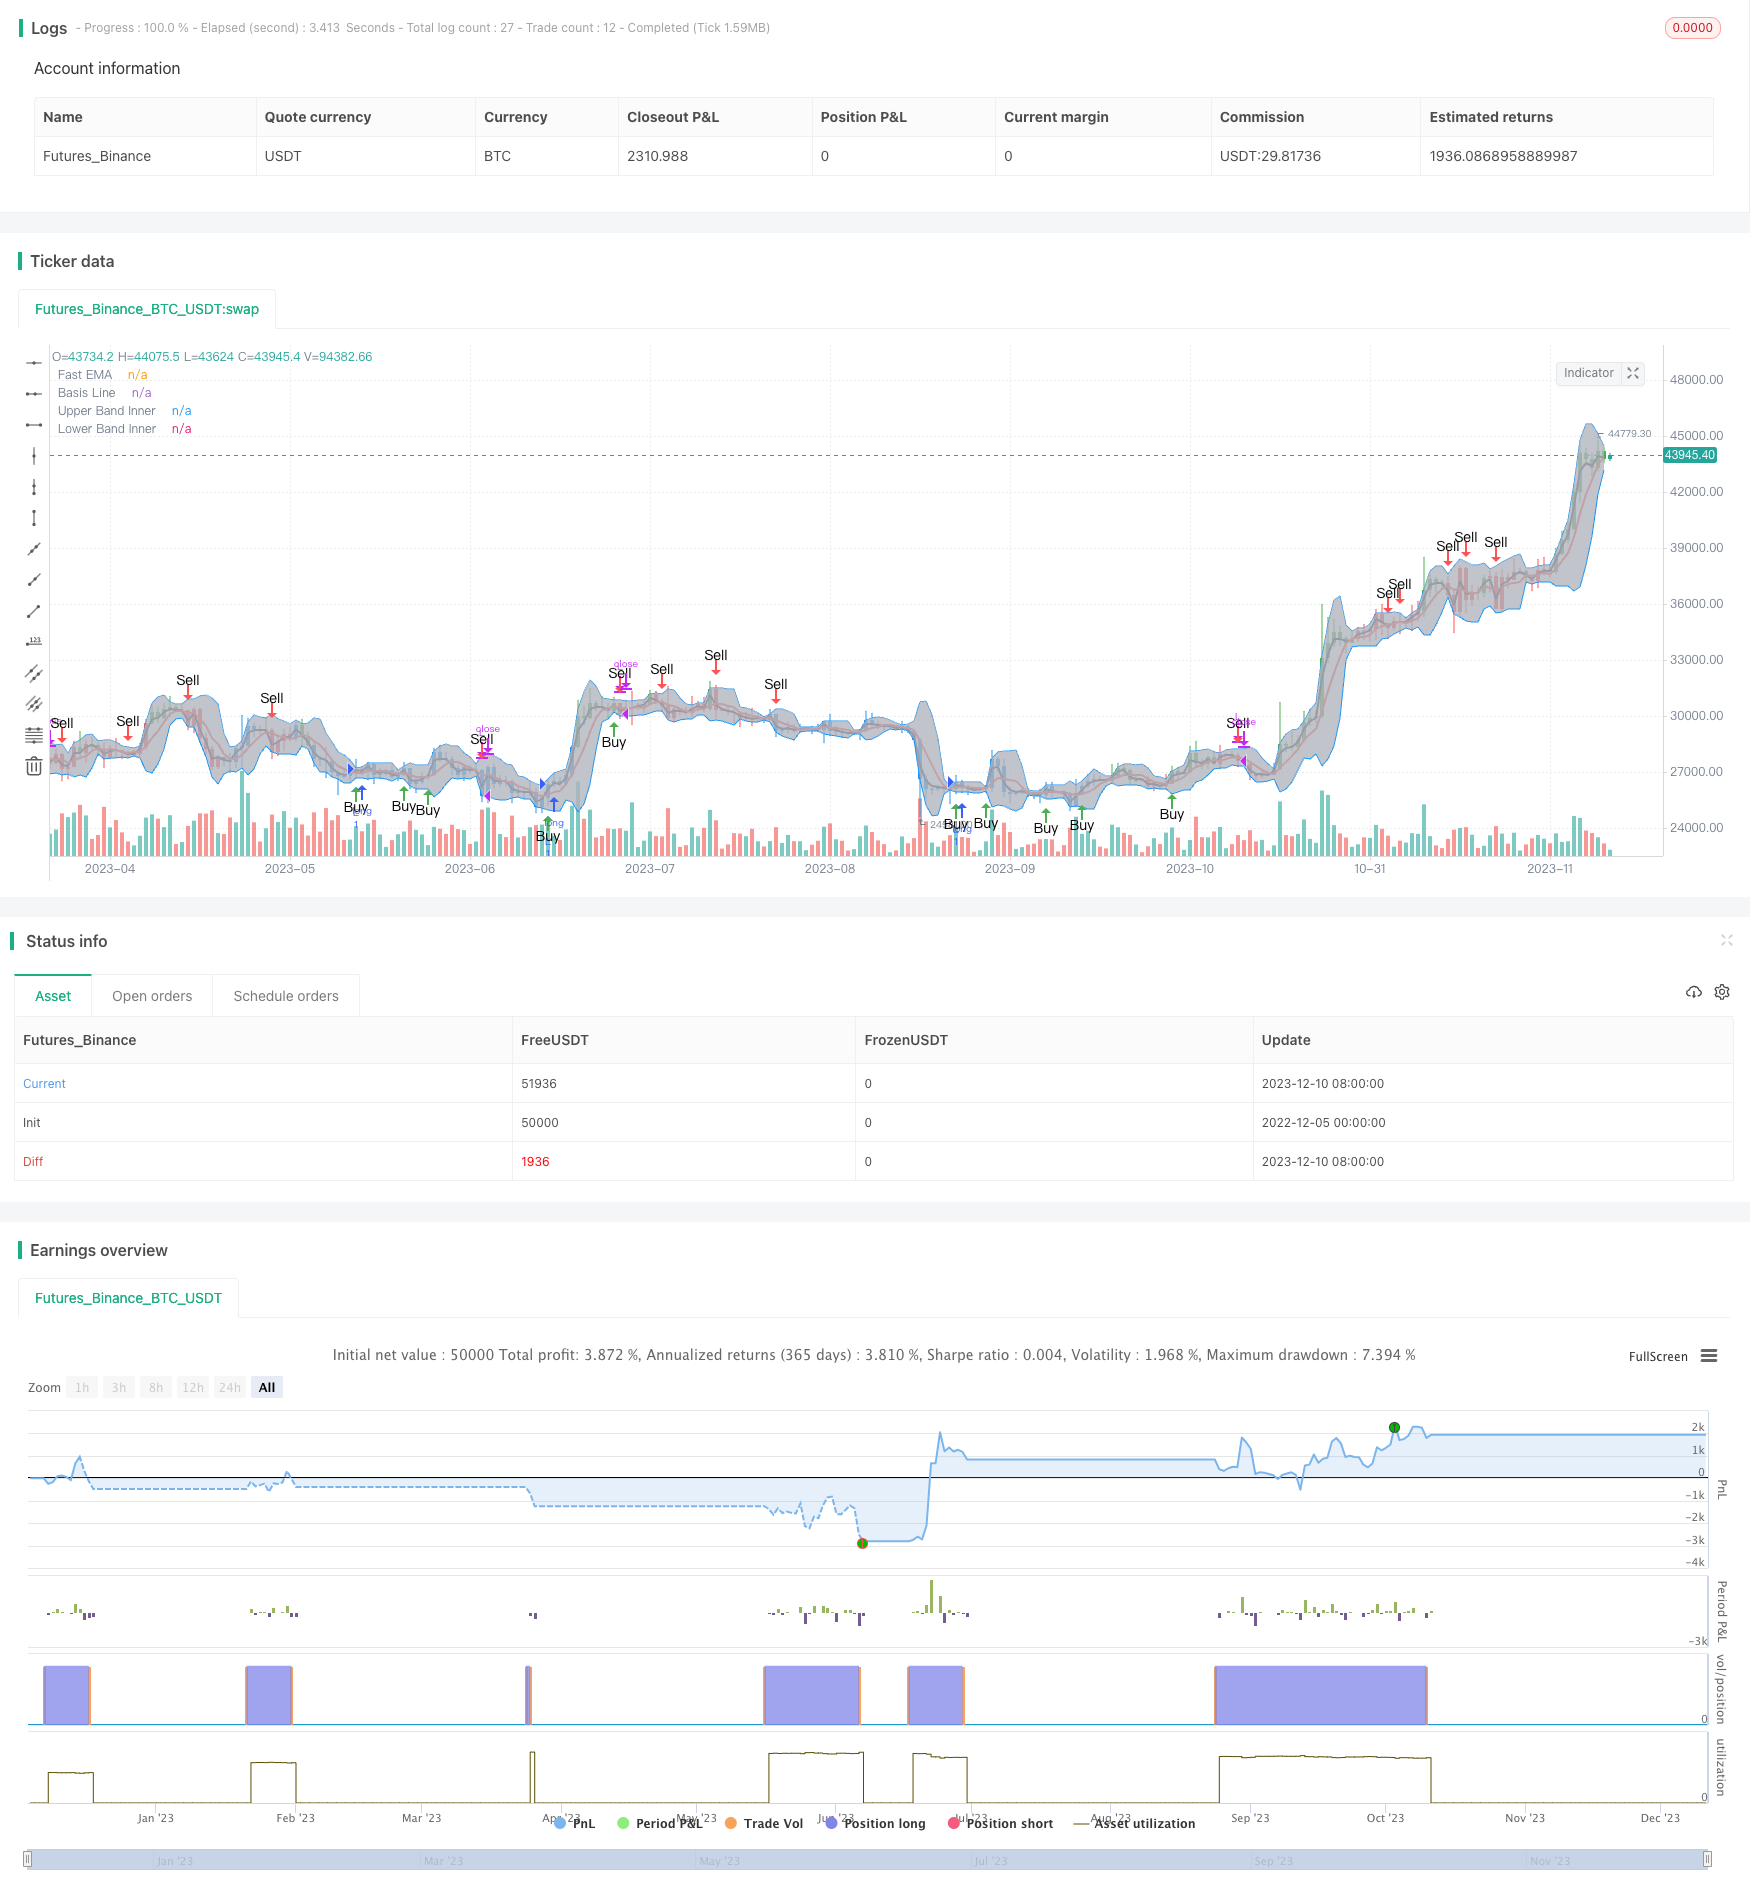
start: 2022-12-05 00:00:00
end: 2023-12-11 00:00:00
period: 1d
basePeriod: 1h
exchanges: [{"eid":"Futures_Binance","currency":"BTC_USDT"}]
*/
//@version=3
strategy(shorttitle="BB+AO STRAT", title="BB+AO STRAT", overlay=true)
// === BACKTEST RANGE ===
FromMonth = input(defval = 6, title = "From Month", minval = 1)
FromDay = input(defval = 1, title = "From Day", minval = 1)
FromYear = input(defval = 2018, title = "From Year", minval = 2014)
ToMonth = input(defval = 1, title = "To Month", minval = 1)
ToDay = input(defval = 1, title = "To Day", minval = 1)
ToYear = input(defval = 9999, title = "To Year", minval = 2014)
// Bollinger Bands Inputs
bb_use_ema = input(false, title="Use EMA for Bollinger Band")
bb_length = input(5, minval=1, title="Bollinger Length")
bb_source = input(close, title="Bollinger Source")
bb_mult = input(2.0, title="Base Multiplier", minval=0.5, maxval=10)
// EMA inputs
fast_ma_len = input(2, title="Fast EMA length", minval=2)
// Awesome Inputs
nLengthSlow = input(34, minval=1, title="Awesome Length Slow")
nLengthFast = input(5, minval=1, title="Awesome Length Fast")
// Breakout Indicator Inputs
bb_basis = bb_use_ema ? ema(bb_source, bb_length) : sma(bb_source, bb_length)
fast_ma = ema(bb_source, fast_ma_len)
// Deviation
dev = stdev(bb_source, bb_length)
bb_dev_inner = bb_mult * dev
// Upper bands
inner_high = bb_basis + bb_dev_inner
// Lower Bands
inner_low = bb_basis - bb_dev_inner
// Calculate Awesome Oscillator
xSMA1_hl2 = sma(hl2, nLengthFast)
xSMA2_hl2 = sma(hl2, nLengthSlow)
xSMA1_SMA2 = xSMA1_hl2 - xSMA2_hl2
// Calculate direction of AO
AO = xSMA1_SMA2>=0? xSMA1_SMA2 > xSMA1_SMA2[1] ? 1 : 2 : xSMA1_SMA2 > xSMA1_SMA2[1] ? -1 : -2
// === PLOTTING ===
// plot BB basis
plot(bb_basis, title="Basis Line", color=red, transp=10, linewidth=2)
// plot BB upper and lower bands
ubi = plot(inner_high, title="Upper Band Inner", color=blue, transp=10, linewidth=1)
lbi = plot(inner_low, title="Lower Band Inner", color=blue, transp=10, linewidth=1)
// center BB channel fill
fill(ubi, lbi, title="Center Channel Fill", color=silver, transp=90)
// plot fast ma
plot(fast_ma, title="Fast EMA", color=black, transp=10, linewidth=2)
// Calc breakouts
break_down = crossunder(fast_ma, bb_basis) and close < bb_basis and abs(AO)==2
break_up = crossover(fast_ma, bb_basis) and close > bb_basis and abs(AO)==1
// Show Break Alerts
plotshape(break_down, title="Breakout Down", style=shape.arrowdown, location=location.abovebar, size=size.auto, text="Sell", color=red, transp=0)
plotshape(break_up, title="Breakout Up", style=shape.arrowup, location=location.belowbar, size=size.auto, text="Buy", color=green, transp=0)
// === ALERTS ===
strategy.entry("L", strategy.long, when=(break_up and (time > timestamp(FromYear, FromMonth, FromDay, 00, 00)) and (time < timestamp(ToYear, ToMonth, ToDay, 23, 59))))
strategy.close("L", when=(break_down and (time < timestamp(ToYear, ToMonth, ToDay, 23, 59))))
// === /PLOTTING ===
barcolor(AO == 2 ? red: AO == 1 ? green : blue )
// eof