Stratégie longue unilatérale basée sur la moyenne mobile et le RSI

Aperçu
La stratégie est basée sur l'article d'Enrico Malverti et utilise principalement les moyennes mobiles simples (SMA) et l'indicateur relativement faible (RSI) pour identifier les signaux d'entrée et de position à plusieurs niveaux. La stratégie fait plus, pas moins.
Principe de stratégie
Le signal d'entrée est une position de plus ouverte lorsque la moyenne SMA a traversé un cycle plus long sur le prix de clôture.
Les signaux de plafonnement sont les suivants:
- le RSI est à la hausse de 70 ou au-dessus de 75 et le RSI est à la baisse de 70 ou au-dessus de 75
- une perte de liquidité lorsque le cours de clôture est inférieur à la moyenne SMA pour une période plus courte;
- Les prix de clôture s'arrêtent lorsque la moyenne SMA de courte période est traversée.
La moyenne SMA de stop-loss et la moyenne SMA de stop-loss sont dessinées simultanément.
Analyse des avantages
Cette stratégie présente les avantages suivants:
- L'utilisation d'une combinaison d'indicateurs simple et facile à comprendre et à mettre en œuvre;
- Il n'y a pas d'autre moyen de faire plus que de ne pas courir le risque supplémentaire d'être en faillite.
- Des règles d'entrée, de stop-loss et de stop-loss claires et des risques maîtrisés;
- Les paramètres sont plus faciles à optimiser et peuvent être ajustés sur des périodes SMA.
Analyse des risques
Cette stratégie comporte aussi des risques:
- L'ombre psychologique de ceux qui n'ont plus confiance dans les signaux de suivi après des pertes répétées;
- Le risque d'un décalage de la moyenne SMA;
- Le RSI est sujet à la volatilité et les signaux de survente peuvent être peu fiables.
La réponse:
- Le gouvernement a décidé de mettre en place un mécanisme de suivi permanent, sans influence psychologique.
- Ajuster les paramètres de la moyenne SMA, optimiser le cycle;
- En combinaison avec d'autres indicateurs, le RSI est filtré.
Direction d'optimisation
Cette stratégie peut également être optimisée dans les directions suivantes:
- Essayez les paramètres SMA avec des paramètres différents.
- Ajout d'autres indicateurs pour filtrer les signaux d'entrée et de sortie;
- L'augmentation des indicateurs de jugement des tendances, de la distinction entre les tendances et de la synthèse;
- Essayez d'optimiser les paramètres de manière autonome.
Résumer
L'idée générale de la stratégie est claire et compréhensible, elle utilise des indicateurs de base, est très contrôlable et convient aux opérations sur des lignes moyennes et longues. Cependant, la configuration des paramètres et le filtrage des indicateurs doivent être testés et optimisés à plusieurs reprises pour rendre la stratégie plus stable et fiable.
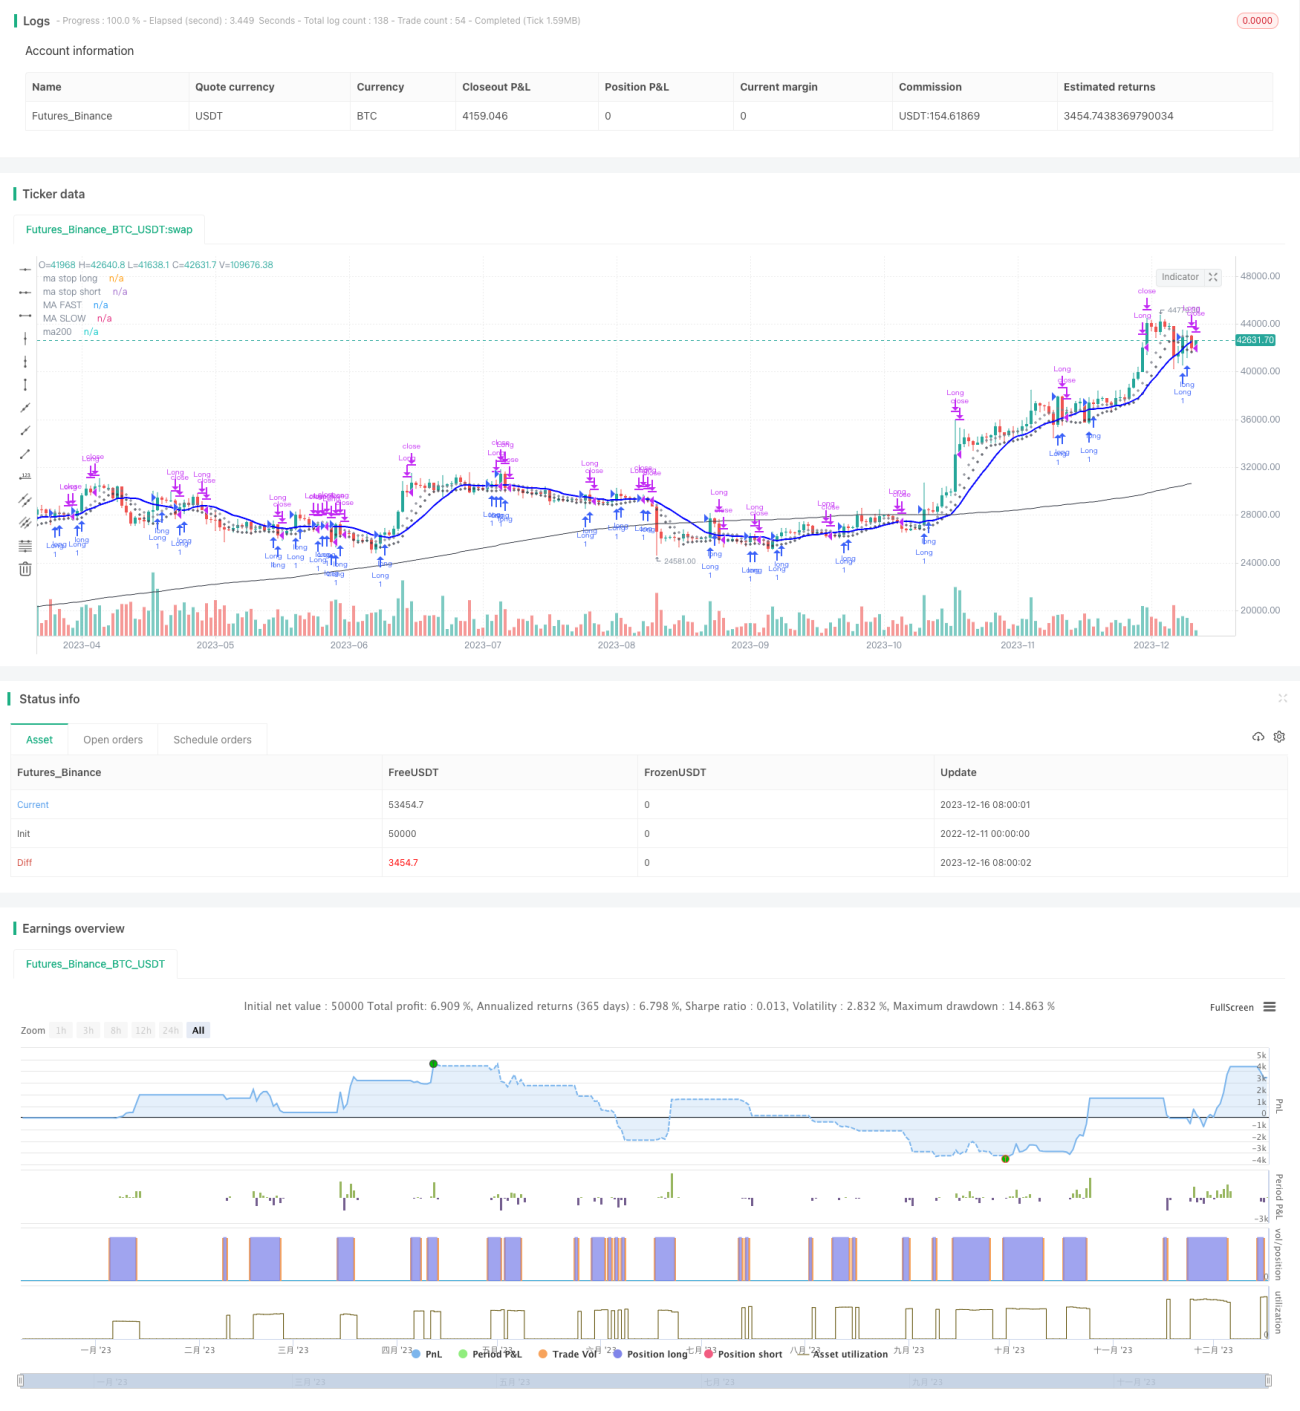
/*backtest
start: 2022-12-11 00:00:00
end: 2023-12-17 00:00:00
period: 1d
basePeriod: 1h
exchanges: [{"eid":"Futures_Binance","currency":"BTC_USDT"}]
*/

//@version= 4
// form the original idea of Enrico Malverti www.enricomalverti.com , trading system 2015
// https://sauciusfinance.altervista.org
strategy(title="MAs & RSI strategy long only", overlay = true, max_bars_back=500)- 1