Stratégie de cassure des chandeliers Ichimoku
Aperçu
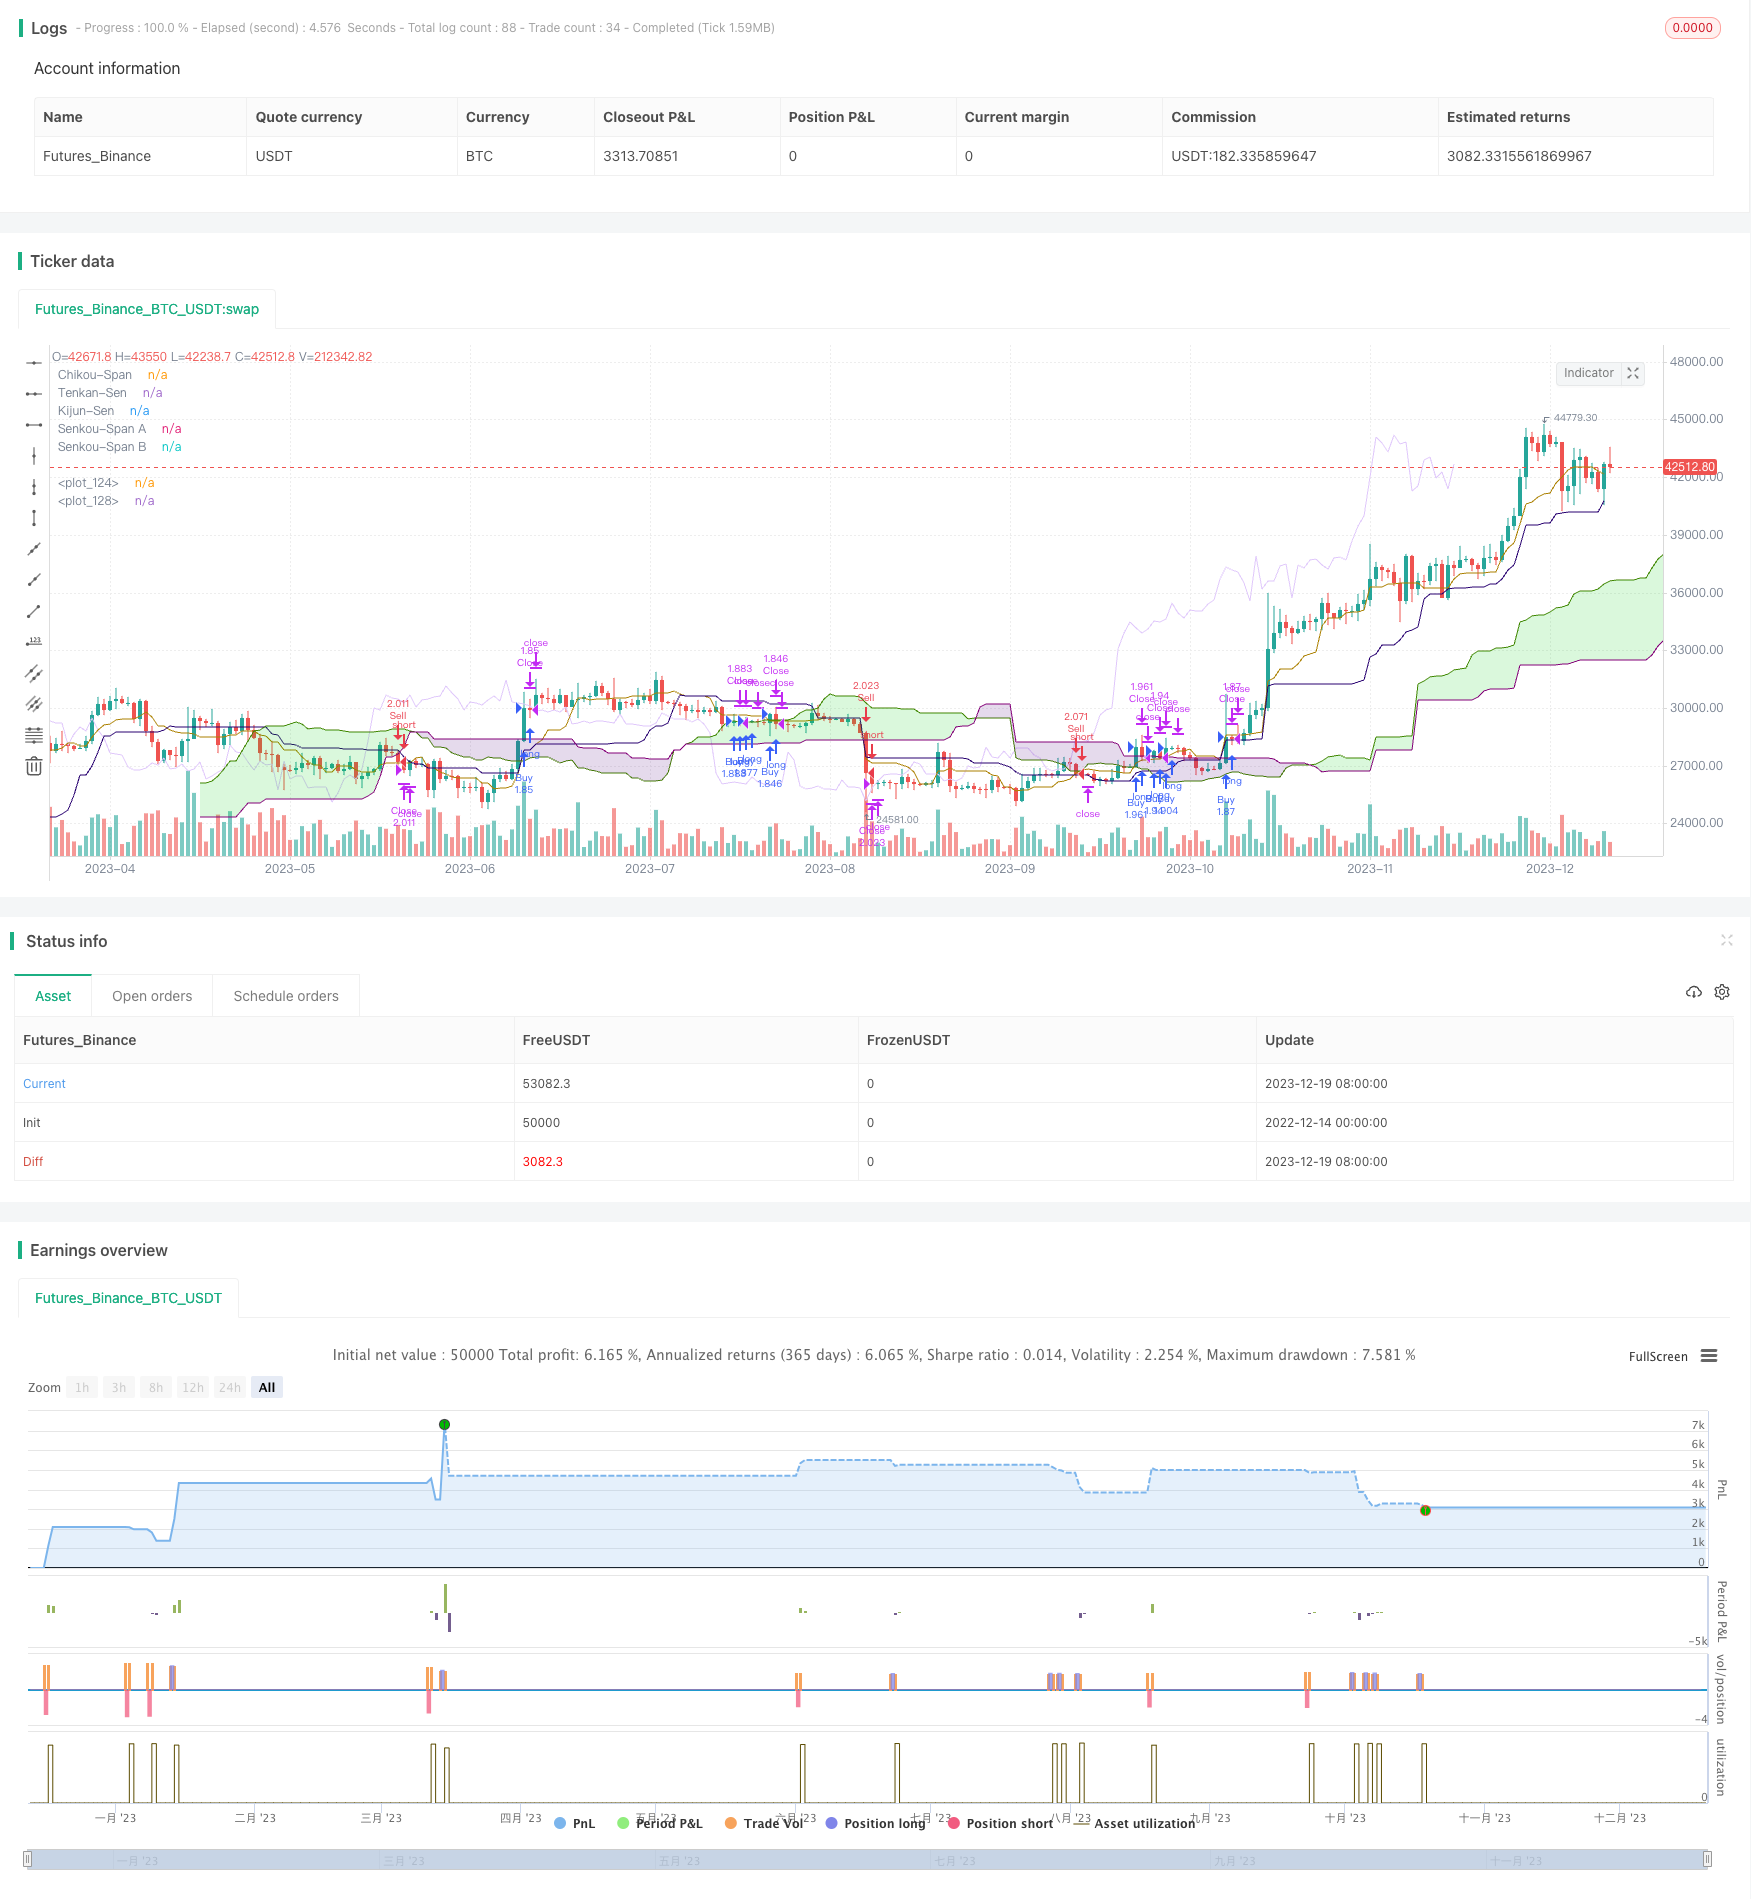
La stratégie est basée sur l’indicateur Ichimoku Kinko Hyo, très connu dans l’analyse technique des marchés, qui utilise la forme du nuage et la relation entre le prix et le nuage pour déterminer la direction de la tendance afin de découvrir des opportunités de négociation. La stratégie génère un signal de négociation lorsque le prix franchit le nuage.
Principe de stratégie
La stratégie utilise plusieurs composants de l’indicateur Ichimoku Kinko Hyo, notamment la ligne de conversion ((Tenkan-Sen), la ligne de référence ((Kijun-Sen), la ligne de pointe ((Senkou Span A), la ligne de pointe ((Senkou Span B) et la ligne de retard ((Chikou Span)). Ces lignes se combinent pour former ce que l’on appelle le nuage Ichimoku.
En particulier, la stratégie de déterminer si le prix a franchi le nuage est basée principalement sur les deux lignes Senkou Span A et Senkou Span B. La zone située entre ces deux lignes constitue le nuage. Un signal d’achat est généré lorsque le prix franchit la clôture en haut du nuage; un signal de vente est généré lorsque le prix franchit la clôture en bas du nuage.
En outre, la stratégie définit des prix de stop loss et de stop loss. Le nombre de points de perte est calculé à l’aide de syminfo.pointvalue et de l’information sur la position de la stratégie, puis converti en prix réels.
Analyse des avantages
Cette stratégie présente les avantages suivants:
- L’utilisation de l’indicateur Ichimoku pour déterminer la direction de la tendance permet de filtrer efficacement le bruit du marché et d’identifier les tendances à long et moyen terme.
- La formation de signaux de rupture des nuages peut éviter les dommages causés par une fausse rupture.
- Combiné avec des paramètres de stop-loss et de stop-loss, il permet de limiter les pertes individuelles et de bloquer les bénéfices
- Les paramètres peuvent être ajustés pour tester l’impact de différents paramètres sur les performances de la stratégie
- Les nuages visualisés et d’autres composants d’Ichimoku forment des signaux de transaction graphiques intuitifs
Analyse des risques
Cette stratégie comporte aussi des risques:
- La position de la ligne moyenne-longue pourrait entraîner des pertes importantes
- Le signal de rupture peut être en retard et manquer le meilleur point d’entrée.
- Une fausse intrusion peut entraîner de faux signaux et des pertes
- Les détenteurs d’une position sur une période de temps trop longue ont des frais de dérivation élevés
- Les prix de stop-loss et de stop-loss peuvent être dépassés
La réponse:
- Réduire le cycle de détention des positions de manière appropriée pour réduire le risque de liquidité et de pertes
- Combiné à d’autres indicateurs pour juger de l’efficacité du signal de rupture
- Amélioration de l’efficacité de l’amortisseur pour éviter le bourrage
- Optimiser la durée de détention et réduire les coûts
Direction d’optimisation
Cette stratégie peut être optimisée dans les domaines suivants:
- Tester différentes combinaisons de paramètres pour trouver le meilleur
- Filtrage des signaux en combinaison avec d’autres indicateurs pour éviter les fausses percées
- Modification dynamique du niveau de stop loss
- Conditions de sortie personnalisées: signal de retour de rupture du nuage, déclenchement de la marge de reprise du prix
- Ajout d’un mécanisme de gestion des positions
Résumer
La stratégie d’Ichimoku est une stratégie de rupture typique utilisant l’indicateur d’Ichimoku Kinko Hyo pour déterminer la direction de la tendance de la ligne moyenne. Elle présente des avantages tels que la réglabilité des paramètres, la forme intuitive et les signaux visuels.
/*backtest
start: 2022-12-14 00:00:00
end: 2023-12-20 00:00:00
period: 1d
basePeriod: 1h
exchanges: [{"eid":"Futures_Binance","currency":"BTC_USDT"}]
*/

//@version=5
// This source code is subject to the terms of the Mozilla Public License 2.0 at https://mozilla.org/MPL/2.0/
// © moneyofthegame
// Basado en estrategias con el indicador ICHIMOKU KINKO HIYO
// El tiempo es oro colega :)

//@version=5
strategy('Ichimoku Cloud Estrategia Ruptura Nubes SWING TRADER  (By Insert Cheese)', shorttitle='Ichimoku Cloud Estrategia Ruptura Nubes SWING TRADER  (By Insert Cheese)',

         overlay=true,
         initial_capital=500,
         process_orders_on_close=true,
         default_qty_type=strategy.percent_of_equity,
         default_qty_value=100,
         commission_type=strategy.commission.percent,
         commission_value=0.05,
         currency=currency.NONE)


// Inputs: Ichimoku parametros
ts_bars =   input.int(9,  minval=1, title='Tenkan-Sen ',          group='Parámetros Ichimoku')
ks_bars =   input.int(26, minval=1, title='Kijun-Sen ',           group='Parámetros Ichimoku')
ssb_bars =  input.int(52, minval=1, title='Senkou-Span B ',       group='Parámetros Ichimoku')
cs_offset = input.int(26, minval=1, title='Chikou-Span',          group='Parámetros Ichimoku')
ss_offset = input.int(26, minval=1, title='Senkou-Span A',        group='Parámetros Ichimoku')

middle(len) => // LONGITITUD Ichimoku (SenkouB)
    math.avg(ta.lowest(len), ta.highest(len))

// Ichimoku Componentes
tenkan = middle (ts_bars)
kijun   = middle (ks_bars)
senkouA = math.avg(tenkan, kijun)
senkouB = middle (ssb_bars)


// Plot Ichimoku Kinko Hyo
plot(tenkan,                                     color=color.rgb(171, 128, 0),                              title="Tenkan-Sen",    display = display.none)
plot(kijun,                                      color=color.rgb(39, 0, 112),                               title="Kijun-Sen",     display = display.none)
plot(close, offset=-cs_offset+1,                 color=color.rgb(224, 200, 251),                            title="Chikou-Span",   display = display.none)
sa=plot(senkouA, offset=ss_offset-1,             color=color.rgb(68, 128, 0),                               title="Senkou-Span A", display = display.none)
sb=plot(senkouB, offset=ss_offset-1,             color=color.rgb(131, 0, 120),                              title="Senkou-Span B", display = display.none)
fill(sa, sb, color = senkouA > senkouB ?         color.rgb(0, 211, 11, 82) : color.rgb(75, 0, 126, 82),   title="Cloud color")

// Calculating
ss_high = math.max(senkouA[ss_offset - 1], senkouB[ss_offset - 1])  //parte alta de la nube
ss_low = math.min(senkouA[ss_offset - 1], senkouB[ss_offset - 1])   //parte baja de la nube
ss_medium = ss_low + (ss_high - ss_low) / 2                         //parte intermedia


// Input para seleccionar largos o cortos
long_entry_enable =  input.bool(true, title='Entradas Largo',   group='Backtest Operativa', inline='SP20')
short_entry_enable = input.bool(true, title='Entradas Corto',   group='Backtest Operativa', inline='SP20')

// Input backtest rango de fechas
fromMonth =  input.int  (defval=1,     title='Desde Mes',  minval=1,     maxval=12,      group='Backtest rango de fechas')
fromYear  =  input.int  (defval=2000,  title='Desde Año',  minval=1970,                  group='Backtest rango de fechas')
fromDay   =  input.int  (defval=1,     title='Desde Día',  minval=1,     maxval=31,      group='Backtest rango de fechas')
thruDay   =  input.int  (defval=1,     title='Hasta Día',  minval=1,     maxval=31,      group='Backtest rango de fechas')
thruMonth =  input.int  (defval=1,     title='Hasta Mes',  minval=1,     maxval=12,      group='Backtest rango de fechas')
thruYear  =  input.int  (defval=2099,  title='Hasta Año',  minval=1970,                  group='Backtest rango de fechas')

inDataRange = time >= timestamp(syminfo.timezone, fromYear, fromMonth, fromDay, 0, 0) and time < timestamp(syminfo.timezone, thruYear, thruMonth, thruDay, 0, 0)


//Estrategia

// Señales de entrada y salida

price_above_kumo = close  > ss_high // precio cierra arriba de la nube
price_below_kumo = close  < ss_low // precio cierra abajo de la nube
price_cross_above_kumo = ta.crossover  (close  , ss_high )   //precio cruza la nube parte alta
price_cross_below_kumo = ta.crossunder (close  , ss_low )     // precio cruza la nube parte baja

bullish = (price_above_kumo and price_cross_above_kumo)
bearish = (price_below_kumo and price_cross_below_kumo)

comprado = strategy.position_size > 0
vendido = strategy.position_size  < 0

sl_long =  price_above_kumo
sl_short = price_below_kumo


if ( not comprado and bullish and inDataRange and long_entry_enable)
//realizar compra
    strategy.entry("Buy", strategy.long)

//realizar salida long
if (comprado and bearish and inDataRange and long_entry_enable)
    strategy.close ("Buy", comment = "cerrado")

if ( not vendido and bearish and inDataRange and short_entry_enable)
//realizar venta
    strategy.entry("Sell", strategy.short)

//realizar salida long
if (vendido  and bullish and inDataRange and short_entry_enable)
    strategy.close ("Buy", comment = "cerrado")

// Función Calcular TP y SL

// Inputs para SL y TP


tpenable = input.bool(true, title =  "SL y TP metodo")


moneyToSLPoints(money)  =>
    strategy.position_size !=0 and tpenable ?  (money / syminfo.pointvalue / math.abs (strategy.position_size)) / syminfo.mintick : na

p = moneyToSLPoints(input.float(  100.0, minval=0.1, step=10.0, title = "Take Profit $$"))
l = moneyToSLPoints(input.float(  100.0, minval=0.1, step=10.0, title = "Stop Loss $$"))
strategy.exit("Close", profit = p, loss = l)


// debug plots for visualize SL & TP levels
pointsToPrice(pp) =>
    na(pp) ? na : strategy.position_avg_price + pp * math.sign(strategy.position_size) * syminfo.mintick

pp = plot(pointsToPrice(p),color = color.rgb(76, 175, 79, 96), style = plot.style_linebr )
lp = plot(pointsToPrice(-l),color = color.rgb(76, 175, 79, 96), style = plot.style_linebr )
avg = plot( strategy.position_avg_price, color = color.rgb(76, 175, 79, 96), style = plot.style_linebr )
fill(pp, avg, color = color.rgb(76, 175, 79, 96))
fill(avg, lp, color = color.rgb(255, 82, 82, 97))