Stratégie de trading de moyenne mobile Momentum Breakout
Aperçu
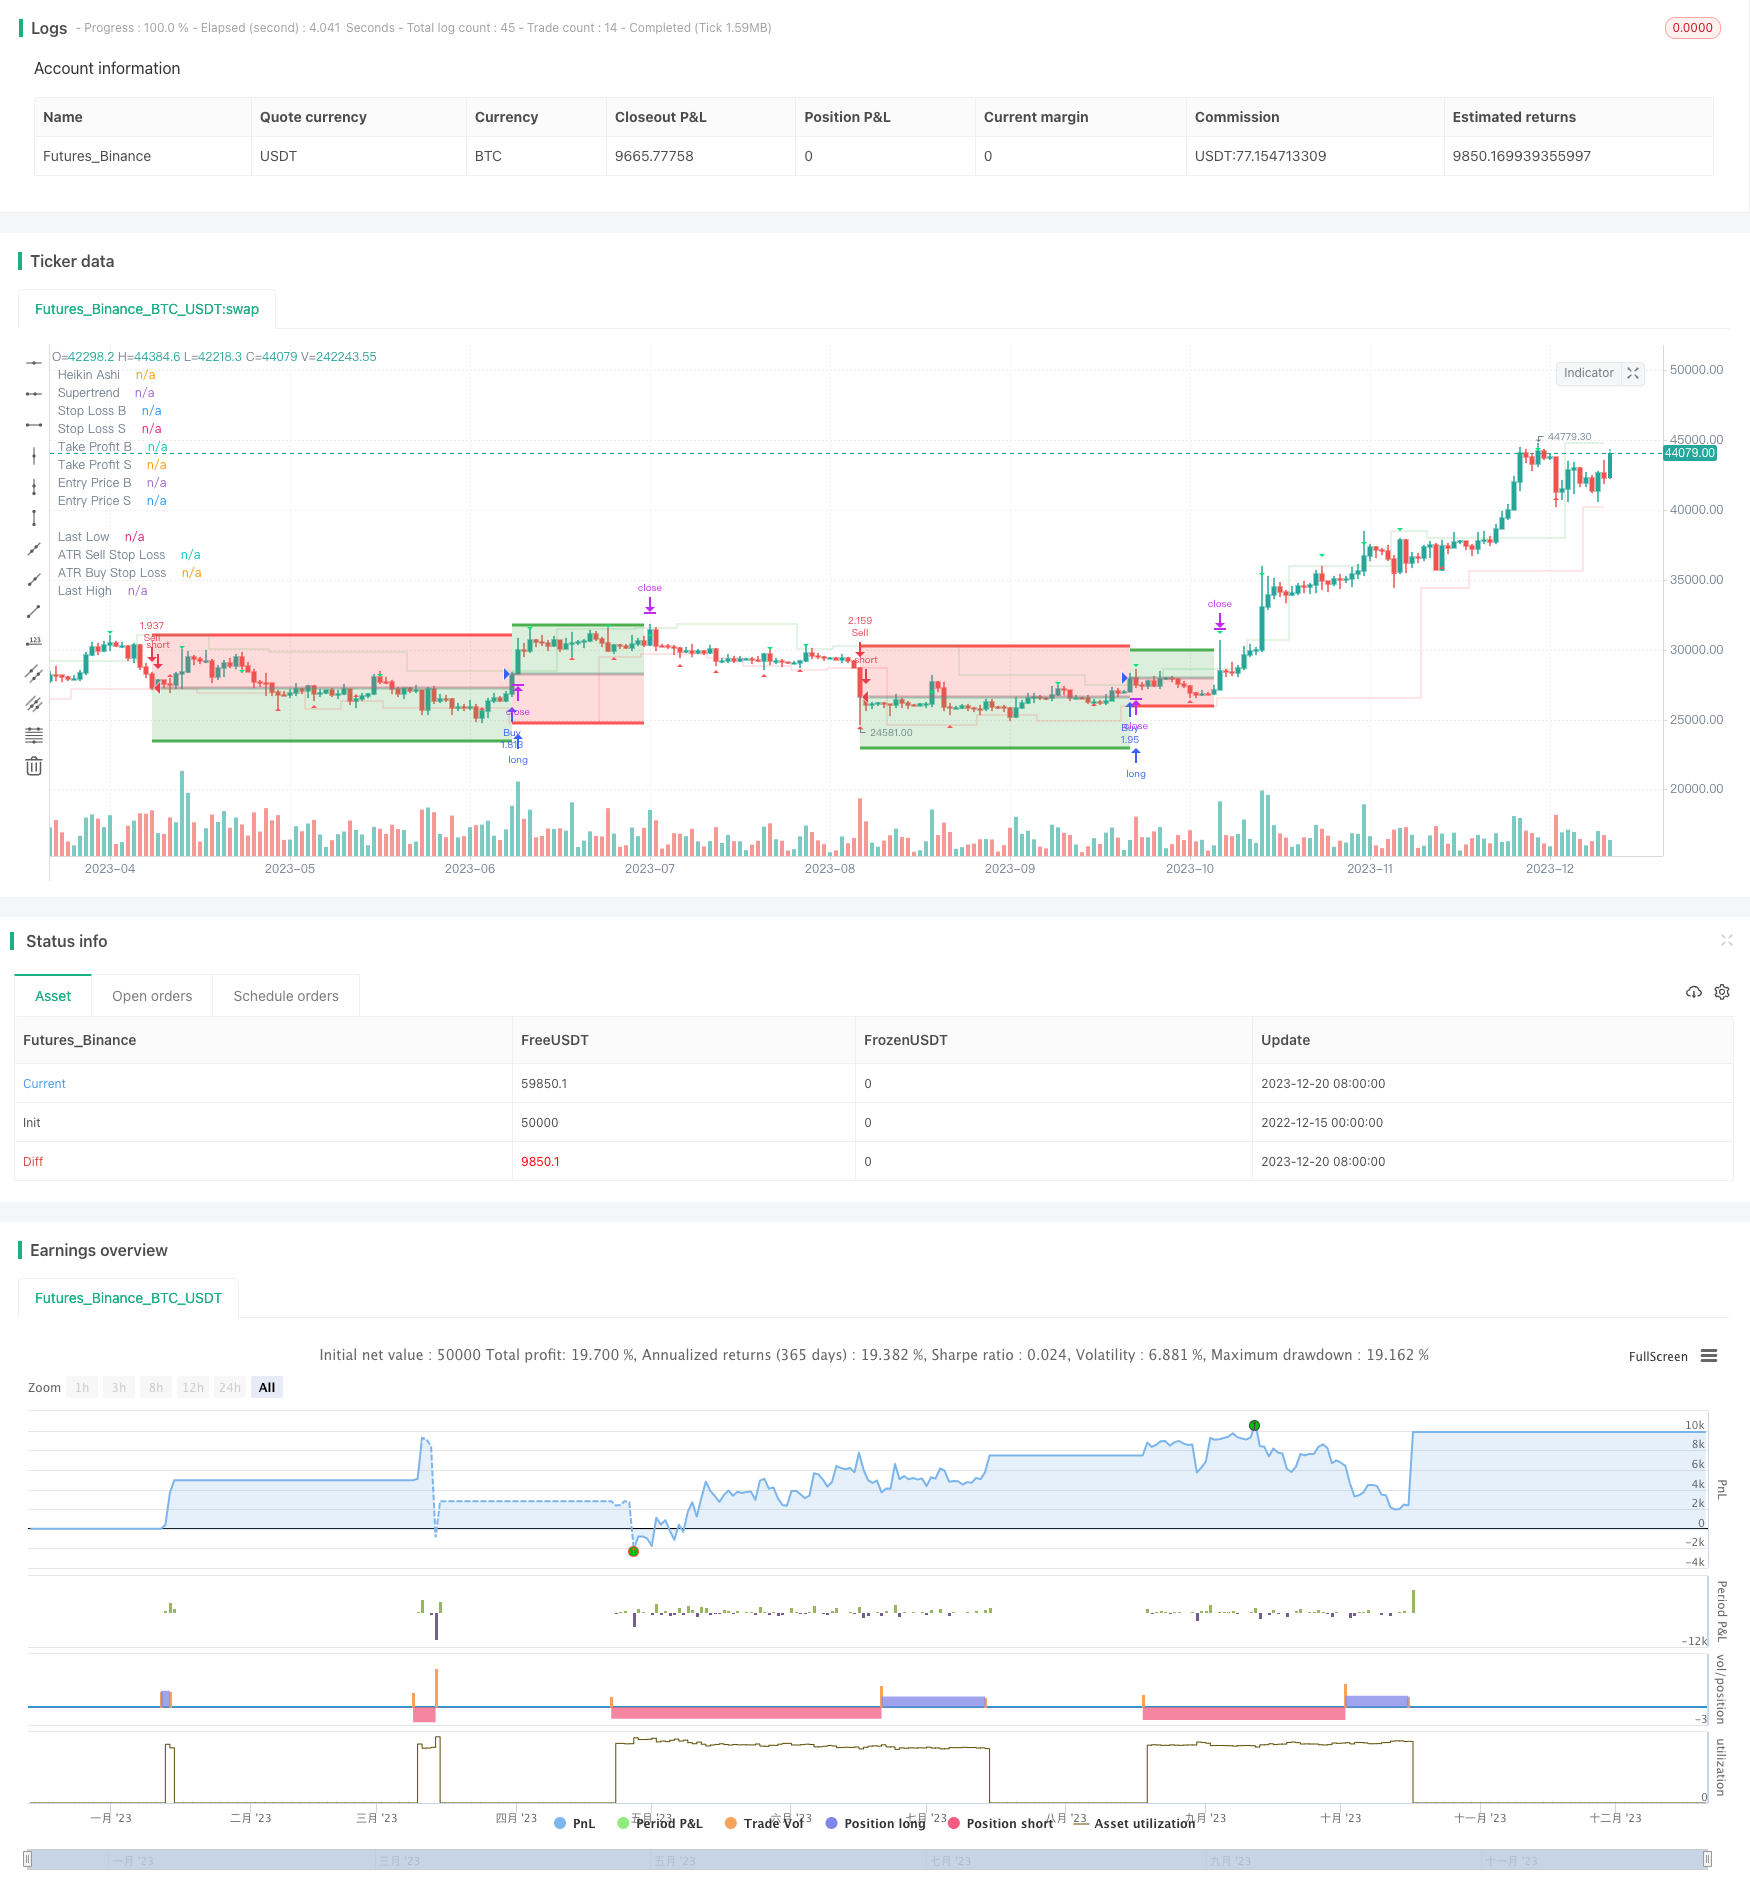
La stratégie utilise des indicateurs de super-tendance pour identifier la direction de la tendance du marché et la mise en bourse en combinaison avec la topographie de Heikin Ashi. La stratégie prévoit également des fonctionnalités de stop-loss et de stop-loss pour bloquer les pertes.
Principe de stratégie
L’indicateur de super-tendance est utilisé pour déterminer la direction de la tendance du marché. L’indicateur est basé sur la moyenne de la gamme de fluctuations réelles et des multiples spécifiques pour déterminer les hauts et les bas.
Le filtrage de la forme de l’indicateur de tendance supérieure, combiné avec le filtrage de la forme de l’indicateur de tendance supérieure, permet de déterminer le moment de la mise sur le marché.
Les stratégies offrent plusieurs types d’arrêt, tels que l’arrêt proportionnel, l’arrêt fixe, l’arrêt de fluctuation réelle moyenne et l’arrêt pivot. Les méthodes d’arrêt comprennent l’arrêt proportionnel, l’arrêt fixe, l’arrêt de la comparaison des retours de risque, etc.
Analyse des avantages
L’indicateur de super-tendance permet de suivre efficacement les tendances du marché et d’éviter de manquer des opportunités de trading importantes.
Le filtrage Heikin Ashi permet de réduire les transactions inutiles et d’améliorer les chances de gagner.
Plusieurs modes de stop-loss sont disponibles, qui peuvent être réglés en fonction des préférences personnelles, afin de contrôler efficacement les risques.
Il est possible de choisir d’assurer la reprise de la position en position de clôture lorsque de nouveaux signaux apparaissent, et de suivre les dernières tendances.
Analyse des risques
L’indicateur de super-tendance est en retard de réaction aux changements du marché et peut manquer le point de basculement de la tendance.
Les filtres Heikin Ashi ne peuvent pas éviter complètement les transactions à perte.
Un mauvais arrêt de perte peut entraîner un départ prématuré ou une perte excessive.
Le fait de répéter fréquemment une transaction entraîne des coûts de transaction plus élevés et un risque de glissement.
Il est possible de réduire ces risques en ajustant les paramètres de l’indicateur de super-tendance et en combinant d’autres indicateurs pour filtrer et optimiser les arrêts de perte.
Direction d’optimisation
Ajustez les paramètres de l’indicateur de super-tendance pour trouver la meilleure combinaison de paramètres.
Essayez différentes sources de données sur les prix pour calculer des indicateurs de tendance supérieure, tels que les prix de clôture, les prix moyens, etc.
Ajoutez des filtres de jugement pour d’autres indicateurs, tels que l’indicateur KDJ, la moyenne mobile, etc.
Optimiser les paramètres de l’arrêt de perte pour obtenir le meilleur rapport risque/rendement.
Tester l’efficacité d’une position en nombre fixe ou d’une position en pourcentage de capital.
Résumer
Cette stratégie intègre des indicateurs de super-tendance et la technologie Heikin Ashi, permettant de tirer efficacement parti de la tendance du marché en suivant la direction de la tendance et en choisissant le bon moment pour la mise sur le marché. La configuration flexible des arrêts de perte permet également de contrôler le risque. La stabilité et la rentabilité de la stratégie peuvent être encore renforcées par l’optimisation des paramètres et l’ajout d’autres conditions de filtre.
/*backtest
start: 2022-12-15 00:00:00
end: 2023-12-21 00:00:00
period: 1d
basePeriod: 1h
exchanges: [{"eid":"Futures_Binance","currency":"BTC_USDT"}]
*/


//# * —————————————————————————————————————————————————————————————————————————————————————————————————————————————————————
//# *
//# *  Script       |  [MT Trader] Backtest Template w/ Supertrend Strategy
//# *  Description  |  Small template open source made in pinescript with the purpose of testing
//# *                  different strategies and how they could be improved
//# *
//# *  Author       |  ©VertMT
//# *
//# *  Pinescript   |  https://www.tradingview.com/pine-script-docs/en/v5/Introduction.html
//# *                 @version=5
//# *
//# *  Revision History
//# *    Release    |  Jul 30, 2022  | Initial Release
//# *
//# *
//# *  Reference    |  https://tradingview.com/script/wzevYXew-TEMPLATE-Code-Block-Comments/
//# *
//# *
//# *    ███▄ ▄███▓ ▄▄▄█████▓
//# *   ▓██▒▀█▀ ██▒ ▓  ██▒ ▓▒
//# *   ▓██    ▓██░ ▒ ▓██░ ▒░
//# *   ▒██    ▒██  ░ ▓██▓ ░
//# *   ▒██▒   ░██▒   ▒██▒ ░
//# *   ░ ▒░   ░  ░   ▒ ░░
//# *   ░  ░      ░     ░
//# *   ░      ░      ░
//# *
//# * —————————————————————————————————————————————————————————————————————————————————————————————————————————————————————

//@version=5
strategy("[MT Trader] Backtest template w/ SuperTrend Strategy", overlay=true, pyramiding = 0, calc_on_order_fills = false, commission_type = strategy.commission.percent, commission_value = 0.03, default_qty_type = strategy.percent_of_equity, default_qty_value = 100, initial_capital=100, currency=currency.USD, process_orders_on_close=true, backtest_fill_limits_assumption=0)


// ————————————————————————————————————————————————————————————————————————————————————————————————————————————————————————
// —————————————————————————————————————— 1. 📆 Timeframe 📆 ——————————————————————————————————————————————————————————————
//# * —————————————————————————————————————————————————————————————————————————————————————————————————————————————————————
//# *
//# *        In this section you can configure the strategy so that it only runs between 2
//# *               time periods, being also able to adjust to any time zone.
//# *
//# *        En este apartado se puede configurar la estrategia para que solo se ejecute entre
//# *        2 periodos de tiempo, siendo capaz tambien de ajustarse a cualquier zona horaria.
//# *
// ————————————————————————————————————————————————————————————————————————————————————————————————————————————————————————


dateFilter  = input.bool(group='📆 Timeframe 📆', defval=false)
startTime   = input(group='📆 Timeframe 📆', defval=timestamp('01 Jan 2022 00:00'), title='Start Time')
endTime     = input(group='📆 Timeframe 📆', defval=timestamp('31 Dec 2022 23:45'), title='End Time')
zoneTime    = input.string("UTC", options = ["UTC-10", "UTC-8", "UTC-7", "UTC-6", "UTC-5", "UTC-4", "UTC-3", "UTC", "UTC+1", "UTC+2", "UTC+3", "UTC+4", "UTC+4:30", "UTC+5", "UTC+5:30", "UTC+6", "UTC+7", "UTC+8", "UTC+9", "UTC+9:30", "UTC+10", "UTC+11", "UTC+12", "UTC+12:45", "UTC+13"], title='UTC', group='📆 Timeframe 📆', tooltip="Match this time zone with that of your graph so that all values are displayed correctly. \n\nHaga coincidir esta zona horaria con la de su gráfico para que todos los valores se muestren correctamente.")

cTime = timestamp(year(timenow), month(timenow), dayofmonth(timenow), hour(timenow), minute(timenow))
sTime = timestamp(year(startTime), month(startTime), dayofmonth(startTime), hour(startTime), minute(startTime), second(startTime))
eTime = timestamp(year(endTime), month(endTime), dayofmonth(endTime), hour(endTime), minute(endTime), second(endTime))

bgcolor(dateFilter and time == sTime or dateFilter and time == eTime?color.new(color.white, 80):na, title="Date Range")
plotshape(dateFilter and time == sTime, title="Start Time", style=shape.labelup, location=location.belowbar, color=color.white, text="Start", textcolor=color.black, size=size.tiny)
plotshape(dateFilter and time == eTime, title="End Time",   style=shape.labelup, location=location.belowbar, color=color.white, text="End",   textcolor=color.black, size=size.tiny)

zcTime = zoneTime == "UTC-10" ? cTime - 10*60*60000 : zoneTime == "UTC-8" ? cTime - 8*60*60000 : zoneTime == "UTC-7" ? cTime - 7*60*60000 : zoneTime == "UTC-6" ? cTime - 6*60*60000 : zoneTime == "UTC-5" ? cTime - 5*60*60000 : zoneTime == "UTC-4" ? cTime - 4*60*60000 : zoneTime == "UTC-3" ? cTime - 3*60*60000 : zoneTime == "UTC" ? cTime - 0*60*60000 : zoneTime == "UTC+1" ? cTime + 1*60*60000 :  zoneTime == "UTC+2" ? cTime + 2*60*60000 : zoneTime == "UTC+3" ? cTime + 3*60*60000 : zoneTime == "UTC+4" ? cTime + 4*60*60000 : zoneTime == "UTC+4:30" ? cTime + 4*60*60000 + 30*60000 : zoneTime == "UTC+5" ? cTime + 5*60*60000 : zoneTime == "UTC+5" ? cTime + 5*60*60000 + 30*60000 : zoneTime == "UTC+6" ? cTime + 6*60*60000 : zoneTime == "UTC+7" ? cTime + 7*60*60000 : zoneTime == "UTC+8" ? cTime + 8*60*60000 : zoneTime == "UTC+9" ? cTime + 9*60*60000 : zoneTime == "UTC+9" ? cTime + 9*60*60000 + 30*60000 : zoneTime == "UTC+10" ? cTime + 10*60*60000 : zoneTime == "UTC+11" ? cTime + 11*60*60000 : zoneTime == "UTC+12" ? cTime + 12*60*60000 : zoneTime == "UTC+12:45" ? cTime + 12*60*60000 + 45*60000 : zoneTime == "UTC+13" ? cTime + 13*60*60000 : 0
zsTime = zoneTime == "UTC-10" ? sTime - 10*60*60000 : zoneTime == "UTC-8" ? sTime - 8*60*60000 : zoneTime == "UTC-7" ? sTime - 7*60*60000 : zoneTime == "UTC-6" ? sTime - 6*60*60000 : zoneTime == "UTC-5" ? sTime - 5*60*60000 : zoneTime == "UTC-4" ? sTime - 4*60*60000 : zoneTime == "UTC-3" ? sTime - 3*60*60000 : zoneTime == "UTC" ? sTime - 0*60*60000 : zoneTime == "UTC+1" ? sTime + 1*60*60000 :  zoneTime == "UTC+2" ? sTime + 2*60*60000 : zoneTime == "UTC+3" ? sTime + 3*60*60000 : zoneTime == "UTC+4" ? sTime + 4*60*60000 : zoneTime == "UTC+4:30" ? sTime + 4*60*60000 + 30*60000 : zoneTime == "UTC+5" ? sTime + 5*60*60000 : zoneTime == "UTC+5" ? sTime + 5*60*60000 + 30*60000 : zoneTime == "UTC+6" ? sTime + 6*60*60000 : zoneTime == "UTC+7" ? sTime + 7*60*60000 : zoneTime == "UTC+8" ? sTime + 8*60*60000 : zoneTime == "UTC+9" ? sTime + 9*60*60000 : zoneTime == "UTC+9" ? sTime + 9*60*60000 + 30*60000 : zoneTime == "UTC+10" ? sTime + 10*60*60000 : zoneTime == "UTC+11" ? sTime + 11*60*60000 : zoneTime == "UTC+12" ? sTime + 12*60*60000 : zoneTime == "UTC+12:45" ? sTime + 12*60*60000 + 45*60000 : zoneTime == "UTC+13" ? sTime + 13*60*60000 : 0
zeTime = zoneTime == "UTC-10" ? eTime - 10*60*60000 : zoneTime == "UTC-8" ? eTime - 8*60*60000 : zoneTime == "UTC-7" ? eTime - 7*60*60000 : zoneTime == "UTC-6" ? eTime - 6*60*60000 : zoneTime == "UTC-5" ? eTime - 5*60*60000 : zoneTime == "UTC-4" ? eTime - 4*60*60000 : zoneTime == "UTC-3" ? eTime - 3*60*60000 : zoneTime == "UTC" ? eTime - 0*60*60000 : zoneTime == "UTC+1" ? eTime + 1*60*60000 :  zoneTime == "UTC+2" ? eTime + 2*60*60000 : zoneTime == "UTC+3" ? eTime + 3*60*60000 : zoneTime == "UTC+4" ? eTime + 4*60*60000 : zoneTime == "UTC+4:30" ? eTime + 4*60*60000 + 30*60000 : zoneTime == "UTC+5" ? eTime + 5*60*60000 : zoneTime == "UTC+5" ? eTime + 5*60*60000 + 30*60000 : zoneTime == "UTC+6" ? eTime + 6*60*60000 : zoneTime == "UTC+7" ? eTime + 7*60*60000 : zoneTime == "UTC+8" ? eTime + 8*60*60000 : zoneTime == "UTC+9" ? eTime + 9*60*60000 : zoneTime == "UTC+9" ? eTime + 9*60*60000 + 30*60000 : zoneTime == "UTC+10" ? eTime + 10*60*60000 : zoneTime == "UTC+11" ? eTime + 11*60*60000 : zoneTime == "UTC+12" ? eTime + 12*60*60000 : zoneTime == "UTC+12:45" ? eTime + 12*60*60000 + 45*60000 : zoneTime == "UTC+13" ? eTime + 13*60*60000 : 0

tradeDateIsAllowed() =>
    dateFilter ? time >= sTime and time <= eTime : true
dateRange = tradeDateIsAllowed()


// ————————————————————————————————————————————————————————————————————————————————————————————————————————————————————————
// —————————————————————————————————————— 2. 🔰 Strategy 🔰 ———————————————————————————————————————————————————————————————
//# * —————————————————————————————————————————————————————————————————————————————————————————————————————————————————————
//# *
//# *                Here are located the options that you can use in this strategy.
//# *
//# *           Aqui se encuentran ubicados las opciones que puedes utilizar en esta estrategia.
//# *
//# *
//# *  Heikin Ashi  |  https://tradingview.com/script/U1QGgSOw-Heikin-Ashi-Source-Function-HTF/
//# *
// ————————————————————————————————————————————————————————————————————————————————————————————————————————————————————————


superTrend    =   input.bool(group='🔰 Strategy 🔰', defval=true,    title="Supertrend")
closeNewEntry =   input.bool(group='🔰 Strategy 🔰', defval=true,    title="Close Position on New Entry", tooltip="When it is active and a new alert is fired, the current position is closed to open a new one, otherwise, the operations only close when reach sl/tp \n\nCuando está activa y una nueva alerta es disparada se cierra la posicion actual para abrir una nueva, en caso contrario las operaciones solo se cierran al tocar sl/tp")
heikinPrice   =   input.bool(group='🔰 Strategy 🔰', defval=false,   title="Heikin Ashi Entry", tooltip="When activated, entries will be based on Heikin Ashi candles but executed at Japanese candles prices. Disable the border of the candles from chart settings for a better experience. \n\nCuando se active, las entradas se basarán en velas heikin ashi pero se ejecutarán a precios de velas japonesas. Deshabilite el borde de las velas desde la configuración del gráfico para una mejor experiencia.")


// —————————————————————————————————————— 1. Heikin Ashi Entry —————————————————————————————————————————————————————————————————


heikin(_src)  =>
    Close  = not heikinPrice ? close : ohlc4
    Open   = float(na)
    Open  := not heikinPrice ? open  : na(Open[1]) ? (open + close) / 2 : (nz(Open[1]) + nz(Close[1])) / 2
    High   = not heikinPrice ? high  : math.max(high, math.max(Open, Close))
    Low    = not heikinPrice ? low   : math.min(low,  math.min(Open, Close))
    HL2    = not heikinPrice ? hl2   : math.avg(High, Low)
    HLC3   = not heikinPrice ? hlc3  : math.avg(High, Low, Close)
    OHLC4  = not heikinPrice ? ohlc4 : math.avg(Open, High, Low, Close)
    HLCC4  = not heikinPrice ? ohlc4 : math.avg(High, Low, Close, Close)
    Price  = _src == 'close' ? Close : _src == 'open' ? Open : _src == 'high' ? High : _src == 'low' ? Low : _src == 'hl2' ? HL2 : _src == 'hlc3' ? HLC3 : _src == 'ohlc4' ? OHLC4 : HLCC4
    Source = math.round(Price / syminfo.mintick) * syminfo.mintick

heikinColor   = heikin('close') > heikin('open') ? #26a69a : #ef5350
plotcandle(heikin('open'), heikin('high'), heikin('low'), heikin('close'), title="Heikin Ashi", color=heikinColor, wickcolor=heikinColor, bordercolor=heikinColor)
barcolor(color=color.new(heikinPrice ? heikinColor:na, 100))

Open  = heikinPrice ? heikin('open')  : open
High  = heikinPrice ? heikin('high')  : high
Low   = heikinPrice ? heikin('low')   : low
Close = heikinPrice ? heikin('close') : close
HL2   = heikinPrice ? heikin('hl2')   : hl2
HLC3  = heikinPrice ? heikin('hl3')   : hlc3
OHLC4 = heikinPrice ? heikin('ohlc4') : ohlc4
HLCC4 = heikinPrice ? heikin('hlcc4') : hlcc4


// ————————————————————————————————————————————————————————————————————————————————————————————————————————————————————————
// —————————————————————————————————————— 2-1. Indicators —————————————————————————————————————————————————————————————————
//# * —————————————————————————————————————————————————————————————————————————————————————————————————————————————————————
//# *
//# *                         Here are the indicators used for the strategy
//# *
//# *                  Aqui se encuentran los indicadores usados para la estrategia.
//# *
//# *
//# *  Supertrend  |  https://tradingview.com/script/P5Gu6F8k/
//# *
// ————————————————————————————————————————————————————————————————————————————————————————————————————————————————————————

// —————————————————————————————————————— 1. Supertrend ———————————————————————————————————————————————————————————————————


stPeriods    = input(group="Supertrend", title='ATR Period', defval=10)
stSourceX    = input(group="Supertrend", title='Source', defval=hl2)
stMultiplier = input.float(group="Supertrend", title='ATR Multiplier', defval=3.0, step=0.1)
stChangeATR  = input(group="Supertrend", title='Change ATR Calculation Method ?', defval=false)
showsignals  = input(group="Supertrend", title='Plot Supertrend', defval=false)

varip float stSource = 0.0
stSource := stSourceX == close ? Close : stSourceX == open ? Open : stSourceX == high ? High : stSourceX == low ? Low : stSourceX == hl2 ? HL2 : stSourceX == hlc3 ? HLC3 : stSourceX == ohlc4 ? OHLC4 : HLCC4

tr   = math.max(High - Low, math.abs(High - Close[1]), math.abs(Low - Close[1]))    // The true range and functions that need olhc need to be calculated with the custom olhc values
atr2 = ta.sma(tr, stPeriods)                                                        // in lines 117-124 for the heikin ashi entries, otherwise the functions will be calculated with
atr  = stChangeATR ? atr2 : ta.rma(tr, stPeriods)                                   // Japanese values and the entries will be in Japanese candlesticks.
up   = stSource - stMultiplier * atr
up1  = nz(up[1], up)                                                                // El rango verdadero y las funciones que necesitan olhc, necesitan ser calculados con los valores
up   := Close[1] > up1 ? math.max(up, up1) : up                                     // olhc personalizados en las líneas 117-124 para las entradas heikin ashi, de lo contrario las
dn   = stSource + stMultiplier * atr                                                // funciones serán calculadas con valores japoneses y las entradas estarán en velas japonesas.
dn1  = nz(dn[1], dn)
dn   := Close[1] < dn1 ? math.min(dn, dn1) : dn
trend = 1
trend := nz(trend[1], trend)
trend := trend == -1 and Close > dn1 ? 1 : trend == 1 and Close < up1 ? -1 : trend

supertrend = trend == 1 ? true : false         //🔵
supertrendBuy  = trend == 1 and trend[1] == -1 //🟢
supertrendSell = trend == -1 and trend[1] == 1 //🔴


upPlot = plot(trend == 1 and showsignals ? up : na, title='Supertrend', style=plot.style_linebr, color=color.new(color.green, 0), linewidth=2)
dnPlot = plot(trend != 1 and showsignals ? dn : na, title='Supertrend', style=plot.style_linebr, color=color.new(color.red,   0), linewidth=2)

plotshape(supertrendBuy  and showsignals ? up : na, title='Supertrend', style=shape.circle,      color=color.new(color.green, 0), location=location.absolute, size=size.tiny)
plotshape(supertrendBuy  and showsignals ? up : na, title='Supertrend', style=shape.labelup,     color=color.new(color.green, 0), location=location.absolute, text='Buy',  textcolor=color.new(color.white, 0))

plotshape(supertrendSell and showsignals ? dn : na, title='Supertrend', style=shape.circle,      color=color.new(color.red,   0), location=location.absolute, size=size.tiny)
plotshape(supertrendSell and showsignals ? dn : na, title='Supertrend', style=shape.labeldown,   color=color.new(color.red,   0), location=location.absolute, text='Sell', textcolor=color.new(color.white, 0))

mPlot = plot(ohlc4, title='Supertrend', style=plot.style_circles, linewidth=0, color=color.new(color.white, 100))
longFillColor  = trend ==  1 ? color.green : color.white
shortFillColor = trend == -1 ? color.red   : color.white
fill(mPlot, upPlot, title='UpTrend Highligter',   color=color.new(longFillColor,  90))
fill(mPlot, dnPlot, title='DownTrend Highligter', color=color.new(shortFillColor, 90))


// ————————————————————————————————————————————————————————————————————————————————————————————————————————————————————————
// —————————————————————————————————————— 3. Stop Loss and Take Profit ————————————————————————————————————————————————————
//# * —————————————————————————————————————————————————————————————————————————————————————————————————————————————————————
//# *
//# *           Various options for stop loss and take profit are already pre-programmed to
//# *                   protect the investment from unexpected market movements.
//# *
//# *           Diversas opciones para stop loss y take profit se encuentran ya pre-programadas
//# *               para asi proteger la inversion de movimientos innesperados del mercado
//# *
//# *
// ————————————————————————————————————————————————————————————————————————————————————————————————————————————————————————


SL       = input.bool(   group="🔴 Stop Loss 🔴",   title="Use Stop Loss",     defval=true)
optionSL = input.string( group="🔴 Stop Loss 🔴",   title="Type of Stop",      defval="Last High/Low",        options = ["Fixed %", "Fixed $", "ATR", "Last High/Low", "Custom"])
fixedPSL = input.float(  group="🔴 Stop Loss 🔴",   title="Fixed %",           defval=1,   minval = 0)  / 100
fixedESL = input.float(  group="🔴 Stop Loss 🔴",   title="Fixed $",           defval=100, minval = 0)
atrL     = input.int(    group="🔴 Stop Loss 🔴",   title="ATR Lenght",        defval=14,  minval = 1)
atrM     = input.float(  group="🔴 Stop Loss 🔴",   title="ATR Multiplier",    defval=1,   minval = 0)
leftBHL  = input.int(    group="🔴 Stop Loss 🔴",   title="Last H/L Left",     defval=5,   minval = 1)
rightBHL = input.int(    group="🔴 Stop Loss 🔴",   title="last H/L Right",    defval=5,   minval = 1)
customSL = input.string( group="🔴 Stop Loss 🔴",   title="Custom",            defval="Custom",         options = ["Custom"])
trailSL  = input.bool(   group="🔴 Stop Loss 🔴",   title="Trailng Stop Loss", defval=false,            tooltip="The maximum stop loss price will decrease as the closing price moves further away from the entry price. \n\nEl precio maximo de stop loss ira disminuyendo mientras el precio de cierre se aleje mas del precio de entrada")

TP       = input.bool(   group="🟢 Take Profit 🟢", title="Use Take Profit",   defval=true)
optionTP = input.string( group="🟢 Take Profit 🟢", title="Type of Stop",      defval="Ratio 1:#",        options = ["Fixed %", "Fixed $", "Ratio 1:#", "Custom"])
fixedPTP = input.float(  group="🟢 Take Profit 🟢", title="Fixed %",           defval=1,   minval = 0)  / 100
fixedETP = input.float(  group="🟢 Take Profit 🟢", title="Fixed $",           defval=100, minval = 0)
ratioTP  = input.float(  group="🟢 Take Profit 🟢", title="Ratio 1:",          defval=1,   minval = 0)
customTP = input.string( group="🟢 Take Profit 🟢", title="Custom",            defval="Custom",         options = ["Custom"])

inOperationB = strategy.position_size >  0 ? true : false
inOperationS = strategy.position_size <  0 ? true : false
inOperation  = strategy.position_size != 0 ? true : false

varip float stopLossB   = 0
varip float takeProfitB = 0
varip float stopLossS   = 0
varip float takeProfitS = 0
varip float entryPrice  = 0
varip float entryPriceB = 0
varip float entryPriceS = 0
varip float trailingB = 0
varip float trailingS = 0

buy  = superTrend and supertrendBuy  //🟢
sell = superTrend and supertrendSell //🔴


// —————————————————————————————————————————— 1. ATR ————————————————————————————————————————————————————————————————————————

atrHigh = ta.rma(ta.tr(true), atrL) * atrM + high
atrLow  = low - ta.rma(ta.tr(true), atrL) * atrM

atrHighPlot = plot(atrHigh, title='ATR Sell Stop Loss', color=color.new(color.red,   not inOperation and optionSL == "ATR" ? 70 : 100), style=plot.style_stepline)
atrLowPlot  = plot(atrLow,  title='ATR Buy Stop Loss',  color=color.new(color.green, not inOperation and optionSL == "ATR" ? 70 : 100), style=plot.style_stepline)


// —————————————————————————————————————— 2. Pivot Points ———————————————————————————————————————————————————————————————————

mb = leftBHL + rightBHL + 1
highestbars_1 = ta.highestbars(mb)
lowestbars_1  = ta.lowestbars(mb)
iff_1 = highestbars_1 == -leftBHL ? high[leftBHL] : na
iff_2 = lowestbars_1  == -leftBHL ?  low[leftBHL] : na
lowest  = not na(high[mb]) ? iff_1 : na
highest = not na( low[mb]) ? iff_2 : na

varip float highestHigh = 0
varip float lowestLow = 0
highestHigh := ta.valuewhen(lowest, high[leftBHL], 0)
lowestLow   := ta.valuewhen(highest, low[leftBHL], 0)

plotshape(highest, title="Last Low",  color=color.new(color.red,   optionSL == "Last High/Low" ?  0 : 100), style=shape.triangleup,   location=location.belowbar, size=size.tiny, offset=-leftBHL)
plotshape(lowest,  title="Last High", color=color.new(color.lime,  optionSL == "Last High/Low" ?  0 : 100), style=shape.triangledown, location=location.abovebar, size=size.tiny, offset=-leftBHL)

plot(lowestLow,    title='Last Low',  color=color.new(color.red,   optionSL == "Last High/Low" ? 70 : 100), style=plot.style_stepline)
plot(highestHigh,  title='Last High', color=color.new(color.green, optionSL == "Last High/Low" ? 70 : 100), style=plot.style_stepline)


// —————————————————————————————————————— 3. Stop Loss ——————————————————————————————————————————————————————————————————————

calculateSL() =>
    varip float stopResult = 0
    varip float stop = 0

    if optionSL == "Fixed %"       and buy
        stop := entryPriceB - ( entryPriceB * fixedPSL)

    if optionSL == "Fixed %"       and sell
        stop := entryPriceS + ( entryPriceS * fixedPSL)

    if optionSL == "Fixed $"       and buy
        stop := entryPriceB - fixedESL

    if optionSL == "Fixed $"       and sell
        stop := entryPriceS + fixedESL

    if optionSL == "Last High/Low" and buy
        stop := lowestLow

    if optionSL == "Last High/Low" and sell
        stop := highestHigh

    if optionSL == "ATR"           and buy
        stop := atrLow

    if optionSL == "ATR"           and sell
        stop := atrHigh

    if optionSL == "Custom"        and buy
        stop := entryPriceB - ( entryPriceB * fixedPSL)

    if optionSL == "Custom"        and sell
        stop := entryPriceS + ( entryPriceS * fixedPSL)

    stopResult := stop


// —————————————————————————————————————— 4. Take Profit ————————————————————————————————————————————————————————————————————

calculateTP() =>
    varip float takeResult = 0
    varip float take = 0

    if optionTP == "Fixed %"            and buy
        take := entryPriceB + ( entryPriceB * fixedPTP)

    if optionTP == "Fixed %"            and sell
        take := entryPriceS - ( entryPriceS * fixedPTP)

    if optionTP == "Fixed $"            and buy
        take := entryPriceB + fixedETP

    if optionTP == "Fixed $"            and sell
        take := entryPriceS - fixedETP

    if optionTP == "Ratio 1:#"          and buy
        take := entryPriceB + ( trailingB * ratioTP )

    if optionTP == "Ratio 1:#"          and sell
        take := entryPriceS - ( trailingS * ratioTP )

    if optionTP == "Custom"             and buy
        take := entryPriceB + ( entryPriceB * fixedPTP)

    if optionTP == "Custom"             and sell
        take := entryPriceS - ( entryPriceS * fixedPTP)

    takeResult := take


// —————————————————————————————————————— 5. BUY ————————————————————————————————————————————————————————————————————————————

if inOperationB and trailSL and not buy
    stopLossBNew = close - trailingB
    stopLossB := stopLossBNew > stopLossB ? stopLossBNew : stopLossB[1]
    strategy.exit("Buy Exit", "Buy", stop=stopLossB, limit=takeProfitB)

if dateRange and buy and (((inOperation and closeNewEntry) or not inOperation))
    entryPrice  := close
    entryPriceB := close
    stopLossB   := SL ? calculateSL() : na
    trailingB   := close - stopLossB
    takeProfitB := TP ? calculateTP() : na
    strategy.entry("Buy", strategy.long, limit=entryPriceB)
    strategy.exit("Buy Exit", "Buy", stop=stopLossB, limit=takeProfitB)

if sell and inOperationB and not closeNewEntry
    strategy.cancel("Buy")

// —————————————————————————————————————— 6. SELL ———————————————————————————————————————————————————————————————————————————

if inOperationS and trailSL and not sell
    stopLossSNew = close + trailingS
    stopLossS := stopLossSNew > stopLossS ? stopLossSNew : stopLossS[1]
    strategy.exit("Sell Exit", "Sell", stop=stopLossS, limit=takeProfitS)

if dateRange and sell and (((inOperation and closeNewEntry) or not inOperation))
    entryPrice  := close
    entryPriceS := close
    stopLossS   := SL ? calculateSL() : na
    trailingS   := stopLossS - close
    takeProfitS := TP ? calculateTP() : na
    strategy.entry("Sell", strategy.short, limit=entryPriceS)
    strategy.exit("Sell Exit", "Sell", stop=stopLossS, limit=takeProfitS)

if sell and inOperationS and not closeNewEntry
    strategy.cancel("Sell")


slbp = plot(stopLossB,   color=color.new(color.red,   inOperationB ?  0 : 100), style=plot.style_linebr, linewidth=3, title="Stop Loss B")
slsp = plot(stopLossS,   color=color.new(color.red,   inOperationS ?  0 : 100), style=plot.style_linebr, linewidth=3, title="Stop Loss S")
tpbp = plot(takeProfitB, color=color.new(color.green, inOperationB ?  0 : 100), style=plot.style_linebr, linewidth=3, title="Take Profit B")
tpsp = plot(takeProfitS, color=color.new(color.green, inOperationS ?  0 : 100), style=plot.style_linebr, linewidth=3, title="Take Profit S")
epbp = plot(entryPriceB, color=color.new(color.gray,  inOperationB ? 50 : 100), style=plot.style_linebr, linewidth=3, title="Entry Price B")
epsp = plot(entryPriceS, color=color.new(color.gray,  inOperationS ? 50 : 100), style=plot.style_linebr, linewidth=3, title="Entry Price S")

fill(epbp, slbp, color=color.new(color.red,   inOperationB ? 75 : 100))
fill(epbp, tpbp, color=color.new(color.green, inOperationB ? 75 : 100))
fill(epsp, slsp, color=color.new(color.red,   inOperationS ? 75 : 100))
fill(epsp, tpsp, color=color.new(color.green, inOperationS ? 75 : 100))