Stratégie de transformation de l'indice oscillateur
Aperçu
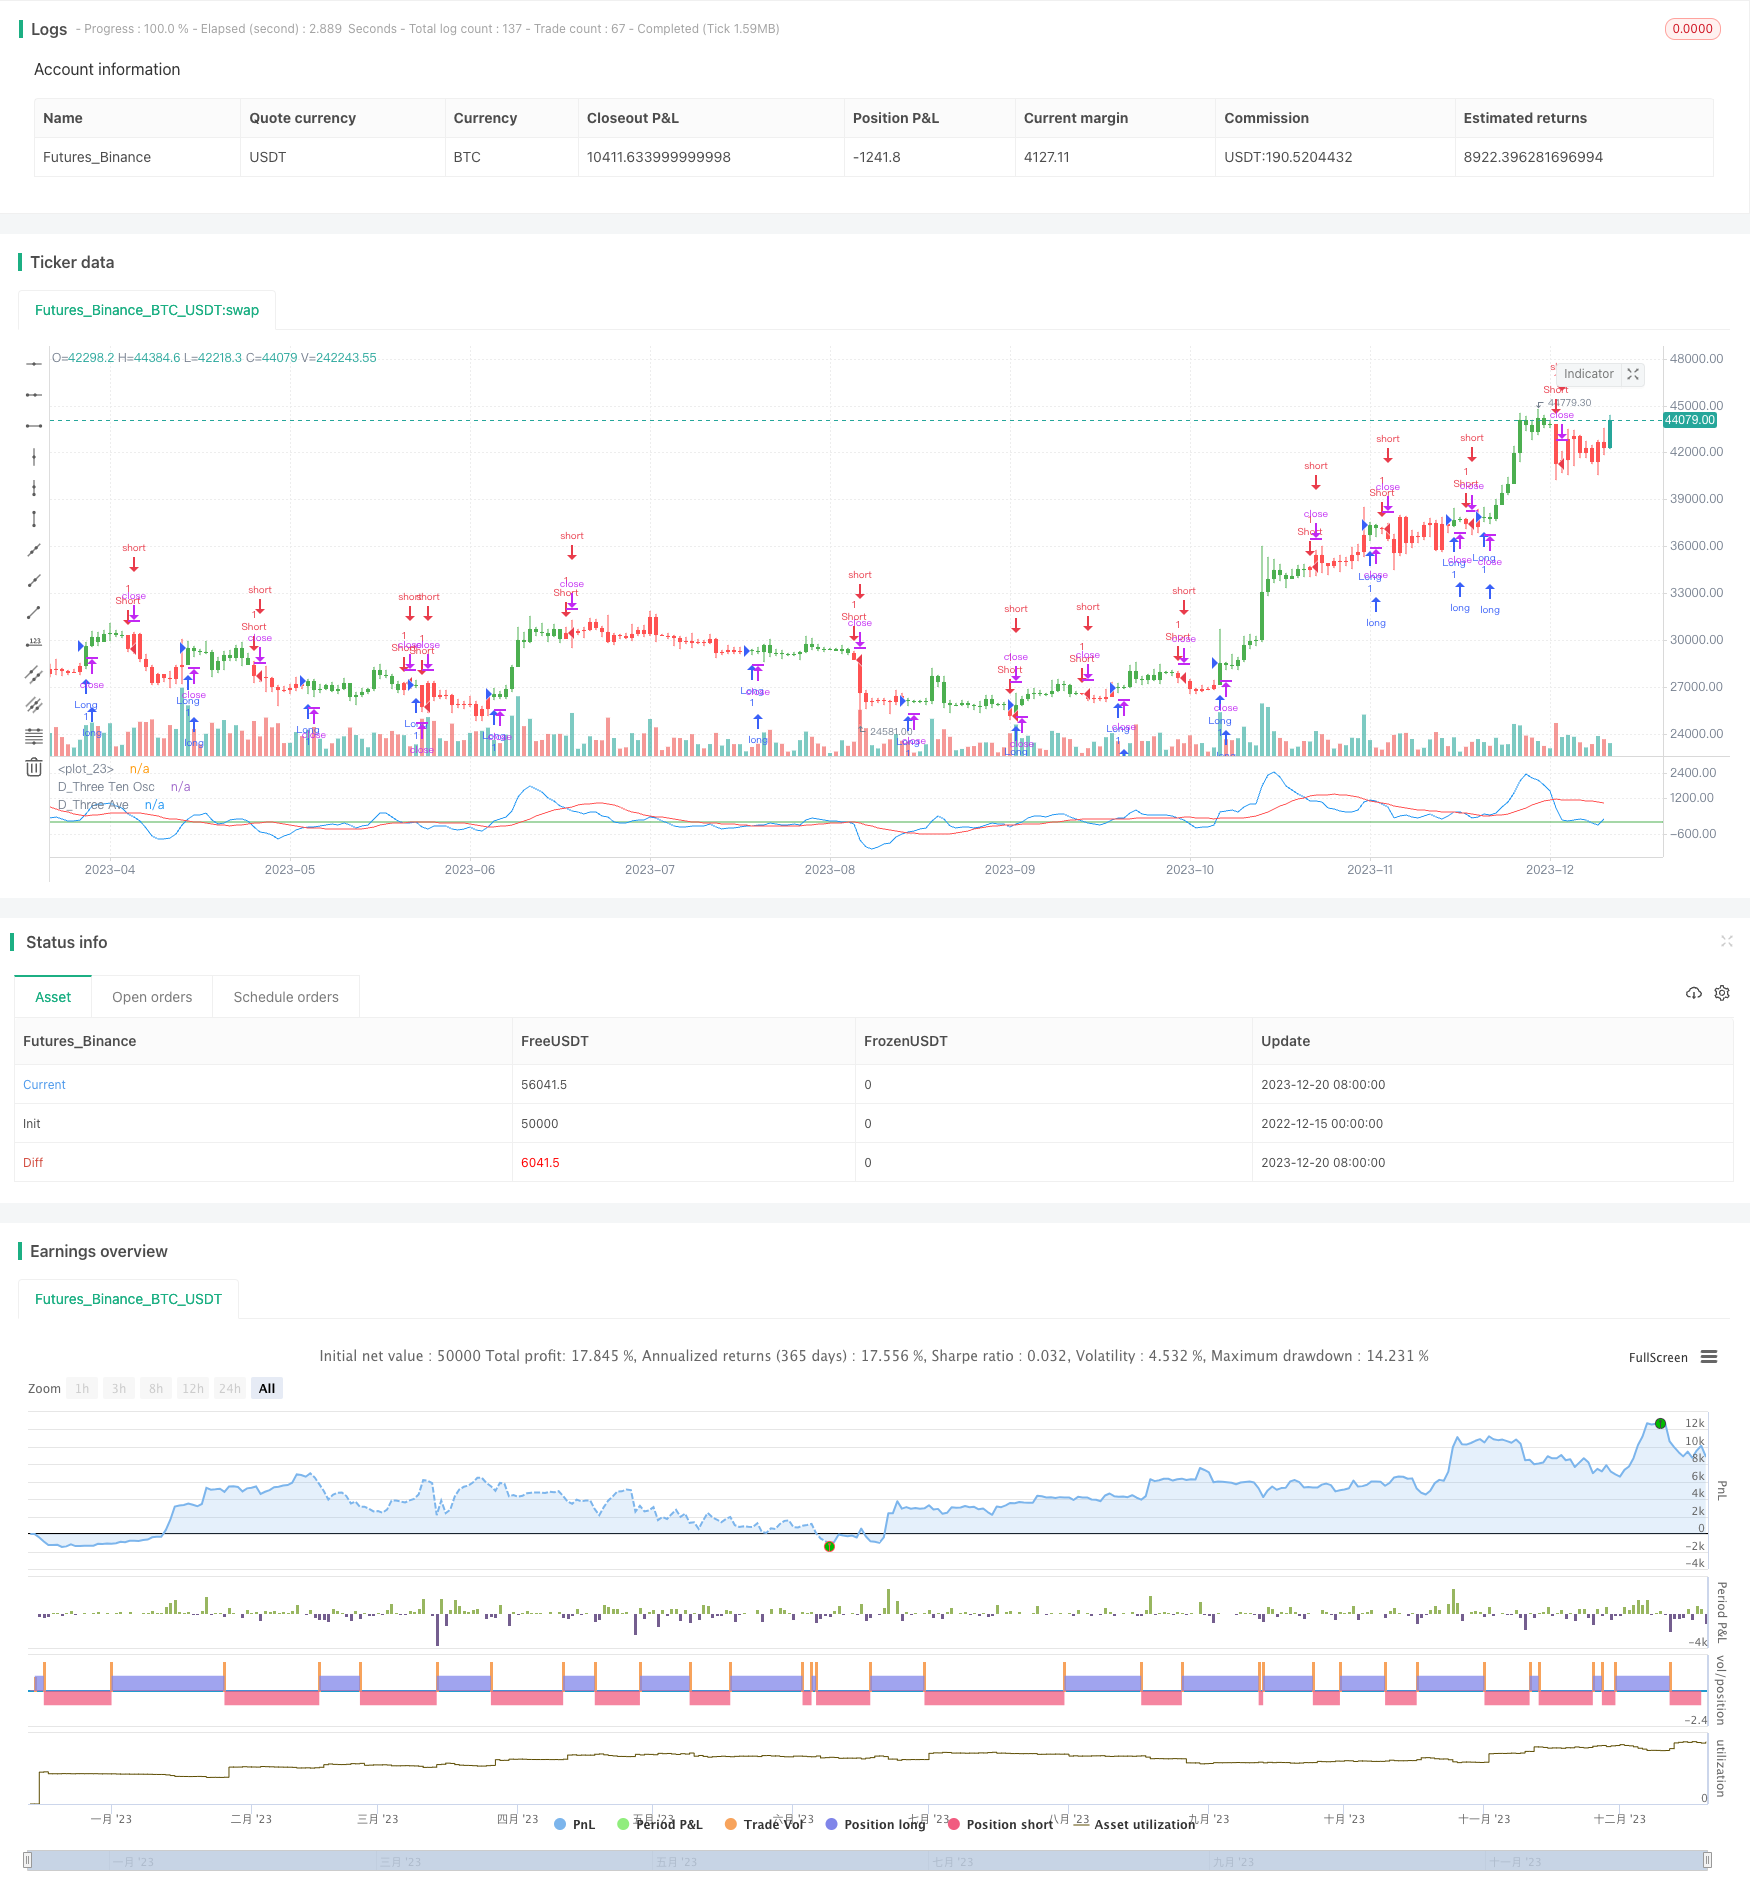
La stratégie de transformation de l’indice oscillateur utilise le croisement de l’indice oscillateur 3-10 de Bressert avec sa moyenne mobile simple à 16 jours pour générer un signal de négociation. La stratégie s’applique à la négociation de jour et de nuit.
Principe de stratégie
La stratégie est basée sur l’indice d’oscillation 3-10 de Bressert, qui est la différence entre les moyennes mobiles indicielles de 3 jours et les moyennes mobiles indicielles de 10 jours.
Plus précisément, la stratégie consiste à calculer d’abord l’EMA de 3 jours, l’EMA de 10 jours et leur différence comme indice d’oscillation. Ensuite, la moyenne mobile simple de l’indice d’oscillation de 16 jours est calculée comme ligne de signal.
Analyse des avantages
- L’utilisation de l’indice d’oscillation classique de Bressert a eu un certain effet
- Les signaux d’entrée et de sortie sont facilement détectés en combinant des signaux de croisement de lignes rapides et lentes.
- La possibilité d’une rétrospective qui s’adapte aux différentes conditions du marché
- Utilisable pour les transactions de jour et de nuit
Analyse des risques
- L’effet de l’indice oscillant de Bressert est instable, il y a une certaine fluctuation des gains et des pertes
- Les signaux de croisement des lignes rapides et lentes peuvent être fausses.
- Le retour en arrière est risqué et doit être fait avec prudence
- Les transactions de jour doivent prendre en compte les stratégies de stop-loss et les transactions de nuit doivent prendre en compte la gestion des fonds.
Direction d’optimisation
- Optimiser les paramètres, ajuster la périodicité des moyennes mobiles et trouver la meilleure combinaison de paramètres
- Augmentation des conditions de filtrage pour juger de la qualité du signal en combinaison avec d’autres indicateurs ou formes de prix
- Augmenter les stratégies de stop loss, définir des points de stop loss raisonnables et contrôler les pertes individuelles
- Optimisation de la gestion des fonds, ajustement de la taille des positions et réduction de l’impact des pertes individuelles sur les fonds totaux
Résumer
La stratégie de variation de l’indice de choc est une stratégie de négociation en ligne courte, qui génère un signal de négociation par la croisée de l’indice de 3-10 de Bressert et de sa ligne de signal. Elle est simple et pratique.
/*backtest
start: 2022-12-15 00:00:00
end: 2023-12-21 00:00:00
period: 1d
basePeriod: 1h
exchanges: [{"eid":"Futures_Binance","currency":"BTC_USDT"}]
*/

//@version=2
////////////////////////////////////////////////////////////
//  Copyright by HPotter v1.0 27/03/2017
// TradeStation does not allow the user to make a Multi Data Chart with
// a Tick Bar Chart and any other type a chart. This indicator allows the
// user to plot a daily 3-10 Oscillator on a Tick Bar Chart or any intraday interval.
// Walter Bressert's 3-10 Oscillator is a detrending oscillator derived
// from subtracting a 10 day moving average from a 3 day moving average.
// The second plot is an 16 day simple moving average of the 3-10 Oscillator.
// The 16 period moving average is the slow line and the 3/10 oscillator is
// the fast line.
// For more information on the 3-10 Oscillator see Walter Bressert's book
// "The Power of Oscillator/Cycle Combinations"
//
// You can change long to short in the Input Settings
// Please, use it only for learning or paper trading. Do not for real trading.
////////////////////////////////////////////////////////////
strategy(title="D_Three Ten Osc", shorttitle="D_Three Ten Osc")
Length1 = input(3, minval=1)
Length2 = input(10, minval=1)
Length3 = input(16, minval=1)
reverse = input(false, title="Trade reverse")
hline(0, color=green, linestyle=line)
xPrice =  request.security(syminfo.tickerid,"D", hl2)
xfastMA = ema(xPrice, Length1)
xslowMA = ema(xPrice, Length2)
xMACD = xfastMA - xslowMA
xSignal = sma(xMACD, Length3)
pos = iff(xSignal > xMACD, -1,
	     iff(xSignal < xMACD, 1, nz(pos[1], 0)))
possig = iff(reverse and pos == 1, -1,
          iff(reverse and pos == -1, 1, pos))
if (possig == 1)
    strategy.entry("Long", strategy.long)
if (possig == -1)
    strategy.entry("Short", strategy.short)
barcolor(possig == -1 ? red: possig == 1 ? green : blue )
plot(request.security(syminfo.tickerid, "D", xMACD), color=blue, title="D_Three Ten Osc")
plot(request.security(syminfo.tickerid, "D", xSignal), color=red, title="D_Three Ave")