Stratégie de trading Heinach basée sur les percentiles
Aperçu
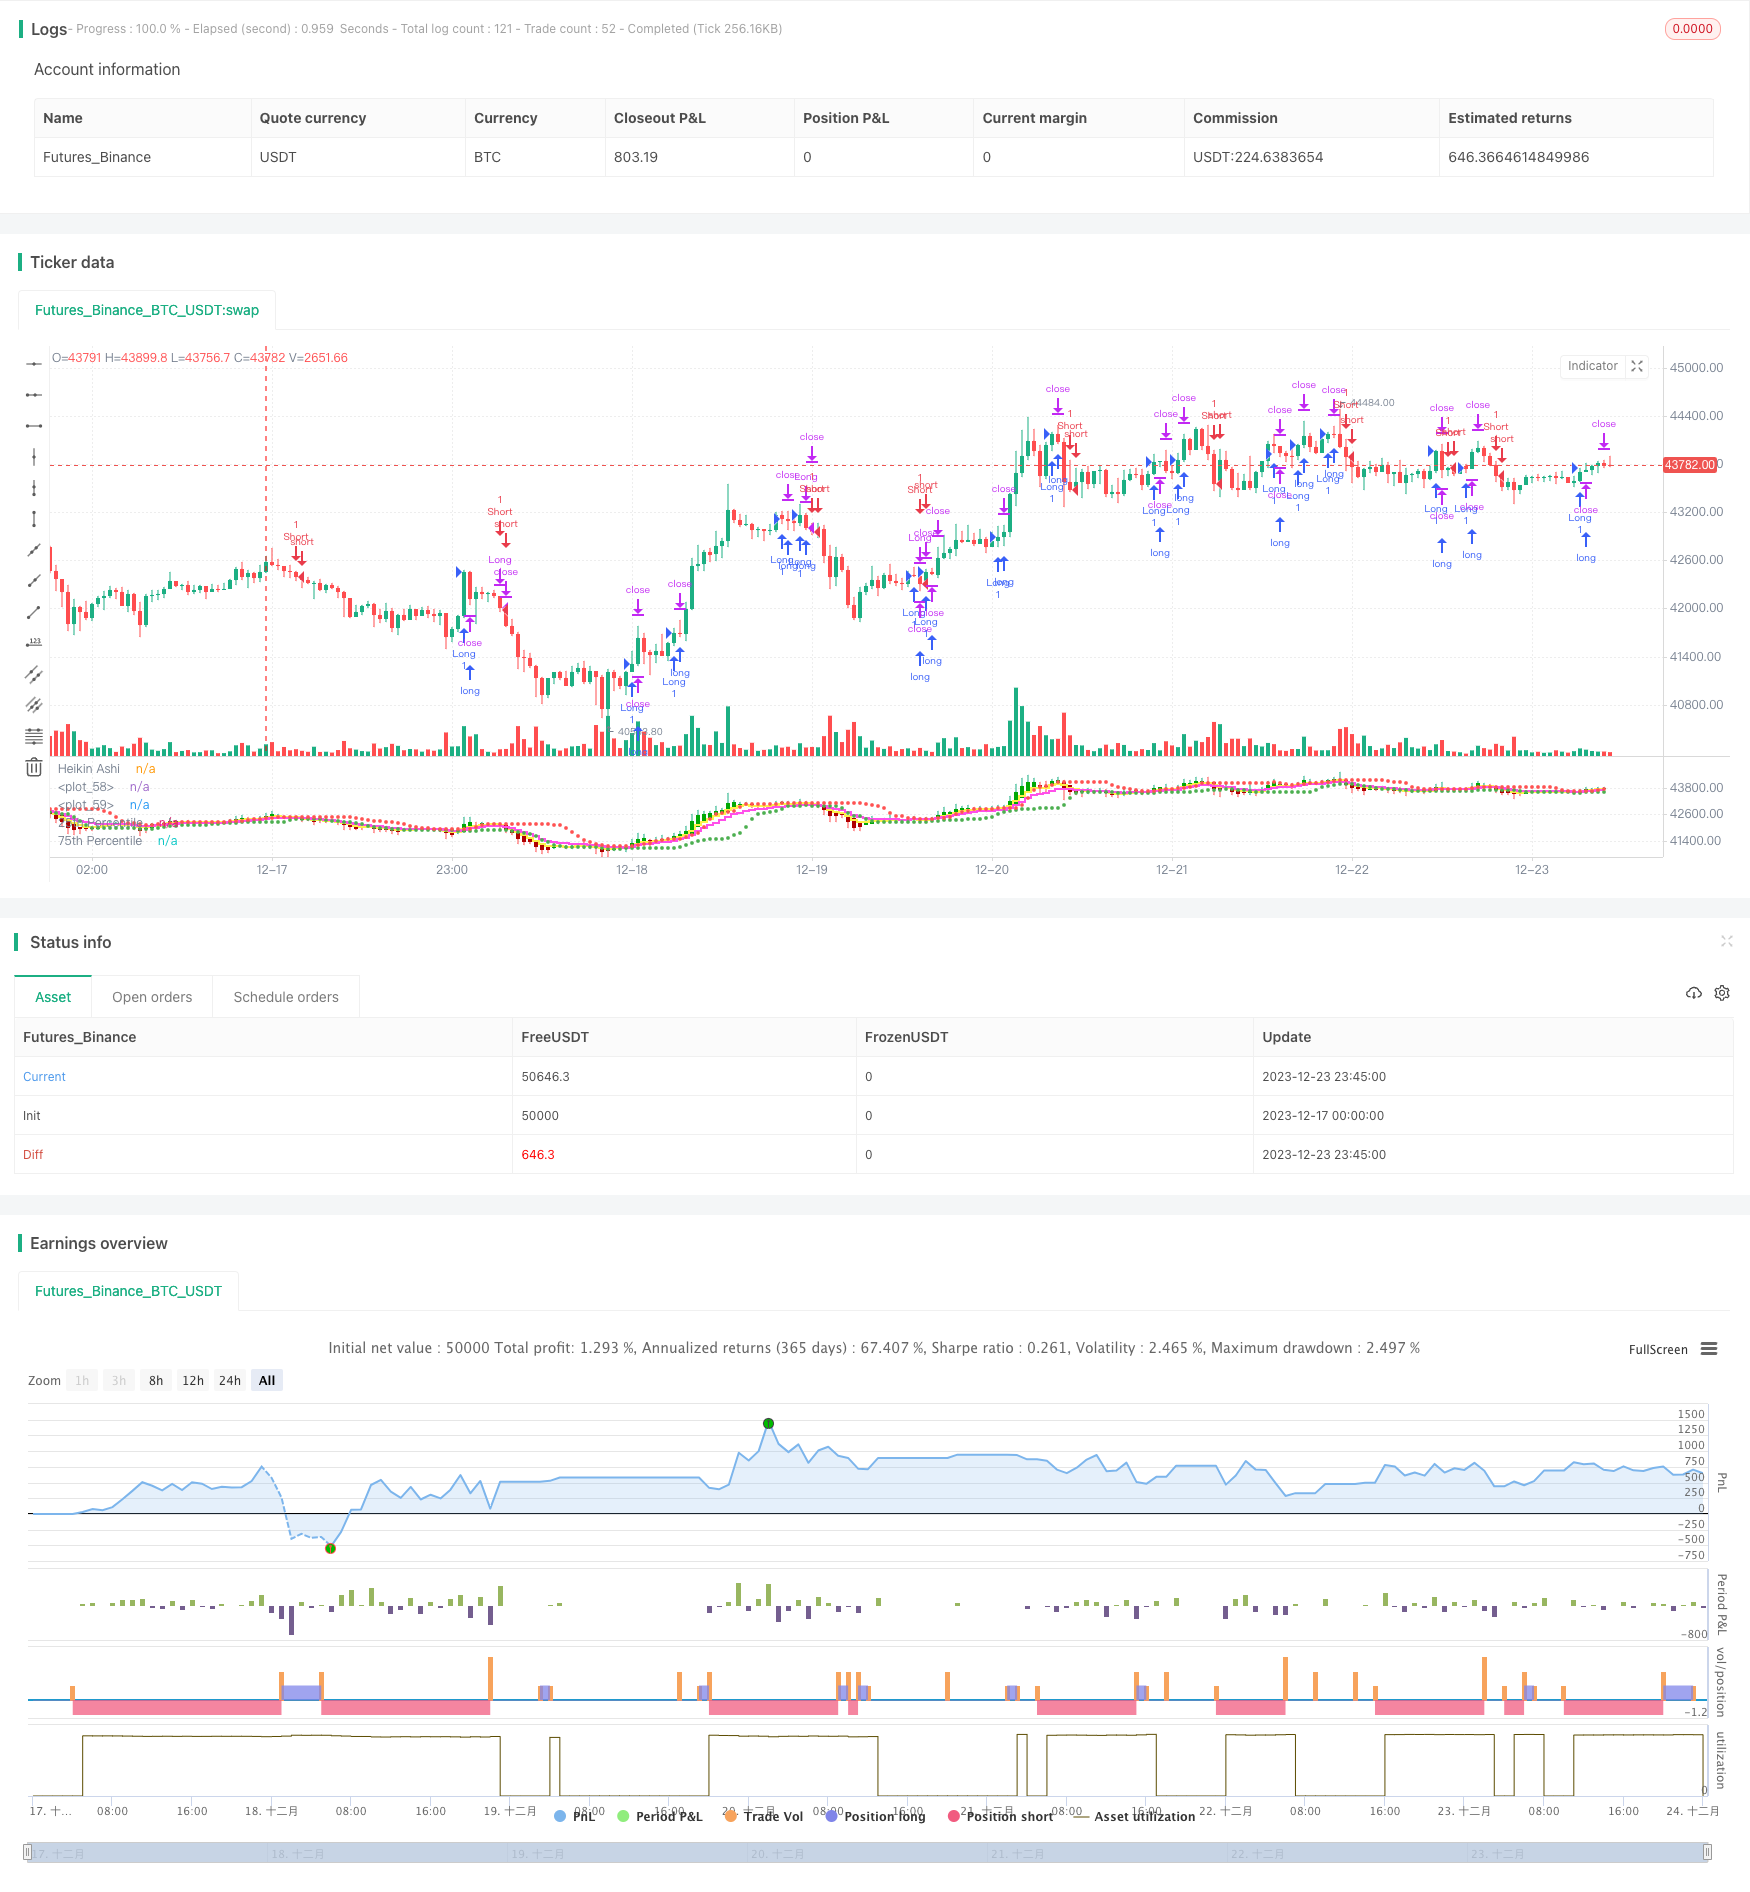
La stratégie est basée sur la génération de signaux de négociation sur la moyenne d’Heinrich. La génération des signaux d’achat et de vente prend en compte les deux facteurs suivants: le croisement du prix de clôture d’Heinrich avec le niveau de prix de 75% et le prix de clôture d’Heinrich supérieur à la moyenne mobile.
Principe de stratégie
Cette stratégie utilise la ligne de Haines-Ash au lieu de la ligne K ordinaire pour l’analyse. Cette ligne filtre le bruit du marché et est plus propice à la détection de tendances et de signaux de revers. Plus précisément, la stratégie combine les canaux de pourcentage et les moyennes mobiles pour produire des signaux de négociation:
- Un signal d’achat est généré lorsque le cours de la Bourse de Hines franchit le seuil de 75% de la clôture.
- Un signal de vente est généré lorsque le cours de l’or se situe au-dessous de la moyenne mobile à 5 jours.
En outre, la stratégie définit des distances de stop-loss et des stops de suivi pour contrôler les risques unilatéraux.
Avantages stratégiques
- L’utilisation de la ligne moyenne d’Heinrich permet d’identifier plus clairement les tendances et de détecter les signaux de retournement en temps opportun.
- En combinant les canaux de pourcentage, il est possible de déterminer si le prix est en cours de hausse ou de hausse, ce qui permet de juger du moment où l’on achète ou vend.
- La mise en place d’un stop loss et le suivi d’un stop loss permettent de contrôler activement les risques et d’éviter des pertes au-delà de ce qui est tolérable.
Risque stratégique
- La ligne moyenne de Haine-et-Aix est elle-même retardée et peut manquer les meilleurs endroits pour une opération de ligne courte.
- Les canaux de pourcentage ne permettent pas de déterminer exactement le point de basculement des prix, et il existe un certain taux de faux signaux.
- Une mauvaise définition de la distance de rupture peut être trop lâche ou trop serrée, ce qui affecte la performance de la stratégie.
Pour réduire ces risques, il est possible d’ajuster le cycle des moyennes mobiles ou d’ajuster le taux de stop loss, etc.
Optimisation de la stratégie
- Testez différentes combinaisons de moyennes mobiles pour trouver le paramètre optimal.
- Tester les différents paramètres de la chaîne de pourcentage pour s’assurer que la zone de chaleur de la chaîne de prix est capturée.
- Les signaux d’achat et de vente sont vérifiés en combinaison avec d’autres indicateurs et les faux signaux sont filtrés.
- Adaptez dynamiquement la distance d’arrêt.
Résumer
Cette stratégie intègre plusieurs indicateurs tels que la moyenne d’Heinrich, la chaîne des pourcentages et la moyenne mobile pour former un système de négociation. Le système est capable d’identifier efficacement la direction de la tendance et de mettre en place des arrêts de perte pour contrôler les risques.
/*backtest
start: 2023-12-17 00:00:00
end: 2023-12-24 00:00:00
period: 45m
basePeriod: 5m
exchanges: [{"eid":"Futures_Binance","currency":"BTC_USDT"}]
*/

//@version=5
strategy("HK Percentile Interpolation One",shorttitle = "HKPIO", overlay=false, default_qty_type = strategy.cash, default_qty_value = 5000, calc_on_order_fills = true, calc_on_every_tick = true)

// Input parameters
stopLossPercentage = input(3, title="Stop Loss (%)") // User can set Stop Loss as a percentage
trailStopPercentage = input(1.5, title="Trailing Stop (%)") // User can set Trailing Stop as a percentage
lookback = input.int(14, title="Lookback Period", minval=1) // User can set the lookback period for percentile calculation
yellowLine_length = input.int(5, "Yellow", minval=1) // User can set the length for Yellow EMA
purplLine_length = input.int(10, "Purple", minval=1) // User can set the length for Purple EMA
holdPeriod = input.int(200, title="Minimum Holding Period", minval=10) // User can set the minimum holding period
startDate = timestamp("2021 01 01")  // User can set the start date for the strategy

// Calculate Heikin Ashi values
haClose = ohlc4
var float haOpen = na
haOpen := na(haOpen[1]) ? (open + close) / 2 : (haOpen[1] + haClose[1]) / 2
haHigh = math.max(nz(haOpen, high), nz(haClose, high), high)
haLow = math.min(nz(haOpen, low), nz(haClose, low), low)

// Calculate Moving Averages
yellowLine = ta.ema(haClose, yellowLine_length)
purplLine = ta.ema(haClose, purplLine_length)

// Calculate 25th and 75th percentiles
p25 = ta.percentile_linear_interpolation(haClose, lookback, 28)
p75 = ta.percentile_linear_interpolation(haClose, lookback, 78)

// Generate buy/sell signals
longSignal = ta.crossover(haClose, p75) and haClose > yellowLine
sellSignal = ta.crossunder(haClose, yellowLine)
longSignal1 = ta.crossover(haClose, p75) and haClose > purplLine
sellSignal1 = ta.crossunder(haClose, purplLine)

// Set start time and trade conditions
if(time >= startDate)
    // When longSignal is true, enter a long trade and set stop loss and trailing stop conditions
    if (longSignal)
        strategy.entry("Long", strategy.long, 1)
        strategy.exit("Sell", "Long", stop=close*(1-stopLossPercentage/100), trail_points=close*trailStopPercentage/100, trail_offset=close*trailStopPercentage/100)
    // When sellSignal is true, close the long trade
    if (sellSignal)
        strategy.close("Long")
    // When sellSignal1 is true, enter a short trade
    if (sellSignal1)
        strategy.entry("Short", strategy.short, 1)
    // When longSignal1 is true, close the short trade
    if (longSignal1)
        strategy.close("Short")

// Plot Heikin Ashi candles
plotcandle(haOpen, haHigh, haLow, haClose, title="Heikin Ashi", color=(haClose >= haOpen ? color.rgb(1, 168, 6) : color.rgb(176, 0, 0)))

// Plot 25th and 75th percentile levels
plot(p25, title="25th Percentile", color=color.green, linewidth=1, style=plot.style_circles)
plot(p75, title="75th Percentile", color=color.red, linewidth=1, style=plot.style_circles)

// Plot Moving Averages
plot(yellowLine, color = color.rgb(254, 242, 73, 2), linewidth = 2, style = plot.style_stepline)
plot(purplLine, color = color.rgb(255, 77, 234, 2), linewidth = 2, style = plot.style_stepline)