Stratégie de trading quantitative à filtre dynamique
Aperçu de la stratégie
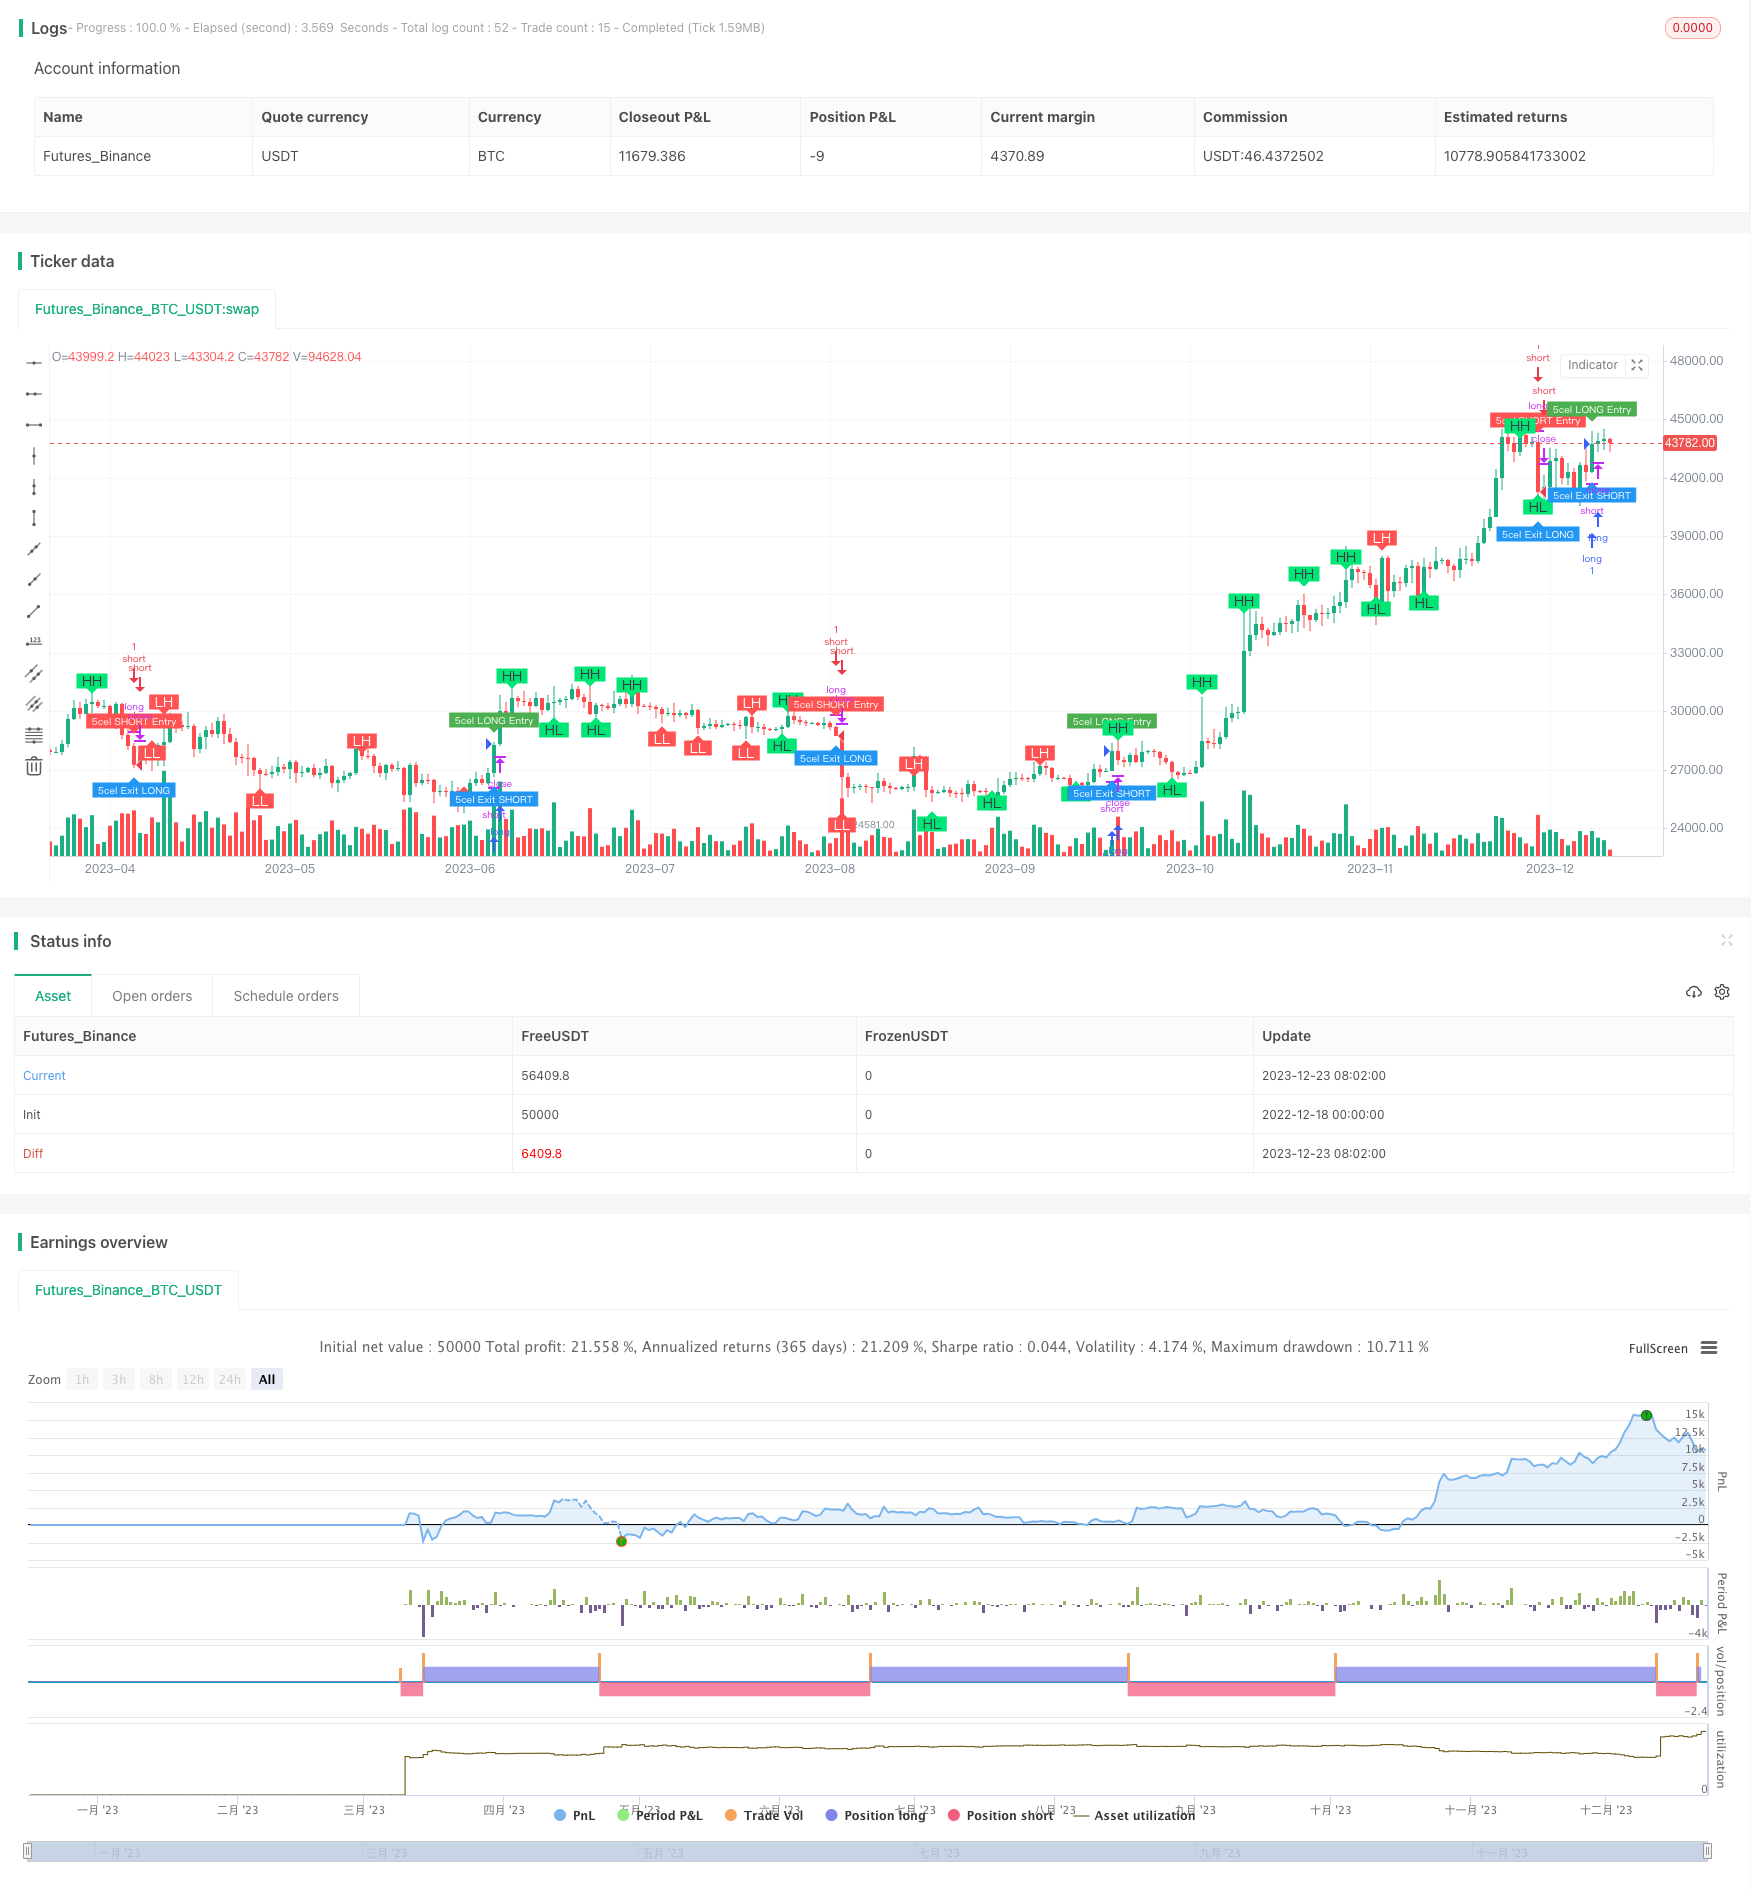
Cette stratégie, nommée Dynamic Filter Quant Trading Strategy, utilise principalement des indicateurs de filtrage de gamme combinés à plusieurs indicateurs techniques pour automatiser le suivi de la tendance des transactions sur la crypto-monnaie BTCUSDT. La stratégie s’applique aux transactions quantifiées à haute fréquence, pour verrouiller les bénéfices et réduire les retraits en ajustant dynamiquement le stop-loss.
Principe de stratégie
L’indicateur central de la stratégie est le filtre de gamme, qui génère une ligne médiane basée sur la gamme de variation des prix statistiques. Un signal de transaction est généré lorsque le prix franchit cette ligne médiane. De plus, la stratégie combine l’indicateur RSI pour juger de la survente, la courbe pour juger de la tendance et le MACD pour juger de la dynamique.
La ligne médiane d’un filtre de gamme est la moyenne mobile indicielle de la gamme de variation des prix, et la direction est déterminée par la force et la vitesse de la rupture de cette ligne médiane. Un signal de rupture fort est généré lorsque le prix franchit la ligne médiane par plusieurs lignes K consécutives.
L’indicateur RSI détermine les conditions de sur-achat et de survente pour confirmer le signal du filtre. L’indicateur MACD détermine si la dynamique du marché est suffisante pour former une tendance.
En combinant ces indicateurs, il est possible d’identifier les points de rupture de tendance les plus fiables pour établir une position.
Analyse des avantages
Le plus grand avantage de cette stratégie est que la combinaison de plusieurs indicateurs pour la prise de décision, plutôt que de s’appuyer sur un seul indicateur technique, peut réduire efficacement la probabilité d’erreur de transaction et assurer une plus grande fiabilité des signaux de négociation. En outre, les paramètres d’ajustement dynamique permettent également à la stratégie de s’adapter aux changements du marché.
Un autre avantage est la possibilité de négocier à haute fréquence. L’indicateur de filtrage de la gamme est sensible aux variations de prix à court terme, ce qui signifie que la stratégie permet d’ouvrir des positions de paix dans un temps plus court, donc très adaptée à la haute fréquence et permettant de tirer profit d’un marché de crypto-monnaie plus volatil.
Analyse des risques
Cette stratégie comporte encore certains risques. D’abord, le risque que le jugement technique soit inefficace, car l’indicateur n’est pas sûr à 100% du mouvement des prix. Lorsqu’un renversement des prix se produit, cela peut entraîner un arrêt.
Un autre risque majeur est que la ligne médiane du filtre de gamme ne peut pas filtrer complètement les fluctuations de prix. Lorsque des fluctuations de prix plus importantes que la gamme médiane se produisent, la ligne médiane sera désactivée, ce qui entraînera un risque de signal erroné. Dans ce cas, il est possible d’assouplir les paramètres de manière appropriée et d’élargir la gamme médiane.
Enfin, le trading à haute fréquence est lui-même exposé à des risques. Lorsque la fréquence des transactions est trop élevée, les frais de transaction sont plus élevés et peuvent compenser une partie des bénéfices. Dans ce cas, la fréquence des transactions et le temps de détention peuvent être réduits de manière appropriée.
Optimisation de la stratégie
Il y a de la place pour une optimisation supplémentaire de cette stratégie. Par exemple, il est possible d’envisager de combiner plus d’indicateurs, tels que les indicateurs de volatilité qui confirment la tendance, de mettre en œuvre des conditions de filtrage plus strictes pour assurer une plus grande précision des signaux de négociation, ou d’étudier les lois du comportement des prix des différentes crypto-monnaies et actions et de définir les paramètres de l’indicateur les mieux adaptés.
La logique de trading permet également de définir des stop-loss et des stop-loss dynamiques. En d’autres termes, l’élargissement de la zone de stop-loss lorsque le volume de la position est plus grand permet de bloquer plus de bénéfices. Ou l’accélération de la vitesse de stop-loss lorsque les bénéfices sont plus importants.
Enfin, il est possible d’optimiser les paramètres du filtre, en trouvant un ensemble de paramètres permettant à la fois de filtrer efficacement les oscillations de la gamme centrale et de capturer au mieux les points de retournement de tendance. Cela nécessite une analyse itérative d’une grande quantité de données de retour.
Résumer
Cette stratégie a réussi à combiner plusieurs indicateurs de jugement, formant une stratégie de trading de haute fiabilité, adaptée aux transactions quantifiées à haute fréquence. Après une optimisation et une amélioration continues, on pense que des gains stables peuvent être obtenus et méritent d’être développés davantage.
/*backtest
start: 2022-12-18 00:00:00
end: 2023-12-24 00:00:00
period: 1d
basePeriod: 1h
exchanges: [{"eid":"Futures_Binance","currency":"BTC_USDT"}]
*/

//@version=5
strategy(title='5cel Scalp Strategy BTCUSDT Long & Short 30 Min', shorttitle='BTCUSDT Long & Short Scalp 30m', precision=1, overlay=true)

//Swing Call - Based on RSI Overbought & Oversold
//#### Starts Here #####
ema_value = input(5)
sma_value = input(50)
ema1 = ta.ema(close, ema_value)
sma2 = ta.sma(close, sma_value)
rs = ta.rsi(close, 14)

iff_1 = high < sma2 ? color.red : color.yellow
iff_2 = low > sma2 ? color.lime : iff_1
mycolor = rs >= 85 or rs <= 15 ? color.yellow : iff_2

//For Main Strategy
bool swingCallGreen = false
bool swingCallRed = false
bool swingCallYellow = false

if rs >= 85 or rs <= 15
    //color.yellow
    swingCallGreen := false
    swingCallRed := false
    swingCallYellow := true
    swingCallYellow
else
    if low > sma2
        //color.lime
        swingCallGreen := true
        swingCallRed := false
        swingCallYellow := false
        swingCallYellow
        //color.red
    else if high < sma2
        swingCallGreen := false
        swingCallRed := true
        swingCallYellow := false
        swingCallYellow
    else
        //color.yellow
        swingCallGreen := false
        swingCallRed := false
        swingCallYellow := true
        swingCallYellow

hlong = input.int(80, title='Overbought limit of RSI', step=1)
ll = input.int(20, title='Oversold limit of RSI', step=1)

buyexit = ta.crossunder(rs, hlong)
sellexit = ta.crossover(rs, ll)

sellcall = ta.crossover(sma2, ema1) and open > close
buycall = ta.crossunder(sma2, ema1) and high > sma2
//#### Ends Here #####


//Parabolic SAR -  Trend Circles
//#### Starts Here #####
start = input.int(2, minval=0, maxval=10, title='Start - Default = 2 - Multiplied by .01')
increment = input.int(2, minval=0, maxval=10, title='Step Setting (Sensitivity) - Default = 2 - Multiplied by .01')
maximum = input.int(2, minval=1, maxval=10, title='Maximum Step (Sensitivity) - Default = 2 - Multiplied by .10')
sus = input(true, 'Show Up Trending Parabolic Sar')
sds = input(true, 'Show Down Trending Parabolic Sar')
disc = input(false, title='Start and Step settings are *.01 so 2 = .02 etc, Maximum Step is *.10 so 2 = .2')

startCalc = start * .01
incrementCalc = increment * .01
maximumCalc = maximum * .10

sarUp = ta.sar(startCalc, incrementCalc, maximumCalc)
sarDown = ta.sar(startCalc, incrementCalc, maximumCalc)

colUp = close >= sarDown ? color.lime : na
colDown = close <= sarUp ? color.red : na

parabolicSARGreen = ta.sar(startCalc, incrementCalc, maximumCalc)
parabolicSARRed = ta.sar(startCalc, incrementCalc, maximumCalc)
//#### Ends Here #####


//EMA Line
//#### Starts Here #####
ema100 = ta.ema(close, 100)
//#### Ends Here #####


// Ichimoku Cloud
//#### Starts Here #####
sCloud = input(false, 'Show Ichimoku lines')

// Colors
colorGreen = #00ff00
colorRed = #ff0000
colorTenkanViolet = #9400D3
colorKijun = #fdd8a0
colorLime = #006400
colorMaroon = #8b0000

//Periods are set to standard
tenkanPeriods = input.int(9, minval=1, title='Tenkan')
kijunPeriods = input.int(26, minval=1, title='Kijun')
chikouPeriods = input.int(52, minval=1, title='Chikou')
displacement = input.int(26, minval=1, title='Offset')

donchian(len) =>
    math.avg(ta.lowest(len), ta.highest(len))

tenkan = donchian(tenkanPeriods)
kijun = donchian(kijunPeriods)
senkouA = math.avg(tenkan, kijun)
senkouB = donchian(chikouPeriods)
displacedSenkouA = senkouA[displacement]
displacedSenkouB = senkouB[displacement]

bullishSignal = ta.crossover(tenkan, kijun)
bearishSignal = ta.crossunder(tenkan, kijun)

bullishSignalValues = bullishSignal ? tenkan : na
bearishSignalValues = bearishSignal ? tenkan : na


strongBullishSignal = bullishSignalValues > displacedSenkouA and bullishSignalValues > displacedSenkouB
neutralBullishSignal = bullishSignalValues > displacedSenkouA and bullishSignalValues < displacedSenkouB or bullishSignalValues < displacedSenkouA and bullishSignalValues > displacedSenkouB
weakBullishSignal = bullishSignalValues < displacedSenkouA and bullishSignalValues < displacedSenkouB

strongBearishSignal = bearishSignalValues < displacedSenkouA and bearishSignalValues < displacedSenkouB
neutralBearishSignal = bearishSignalValues > displacedSenkouA and bearishSignalValues < displacedSenkouB or bearishSignalValues < displacedSenkouA and bearishSignalValues > displacedSenkouB
weakBearishSignal = bearishSignalValues > displacedSenkouA and bearishSignalValues > displacedSenkouB
//#### Ends Here #####


//Higher High Lower Low Strategy
//#### Starts Here #####
lb = input.int(5, title='Left Bars', minval=1)
rb = input.int(5, title='Right Bars', minval=1)
showsupres = input.bool(true, title='Support/Resistance', inline='srcol')
supcol = input.color(color.lime, title='', inline='srcol')
rescol = input.color(color.red, title='', inline='srcol')
// srlinestyle = input.string(line.style_dotted, title='Line Style/Width', options=[line.style_solid, line.style_dashed, line.style_dotted], inline='style')
srlinewidth = input.int(3, title='', minval=1, maxval=5, inline='style')
changebarcol = input.bool(true, title='Change Bar Color', inline='bcol')
bcolup = input.color(color.blue, title='', inline='bcol')
bcoldn = input.color(color.black, title='', inline='bcol')

ph = ta.pivothigh(lb, rb)
pl = ta.pivotlow(lb, rb)

iff_3 = pl ? -1 : na  // Trend direction
hl = ph ? 1 : iff_3
iff_4 = pl ? pl : na  // similar to zigzag but may have multiple highs/lows
zz = ph ? ph : iff_4
valuewhen_1 = ta.valuewhen(hl, hl, 1)
valuewhen_2 = ta.valuewhen(zz, zz, 1)
zz := pl and hl == -1 and valuewhen_1 == -1 and pl > valuewhen_2 ? na : zz
valuewhen_3 = ta.valuewhen(hl, hl, 1)
valuewhen_4 = ta.valuewhen(zz, zz, 1)
zz := ph and hl == 1 and valuewhen_3 == 1 and ph < valuewhen_4 ? na : zz

valuewhen_5 = ta.valuewhen(hl, hl, 1)
valuewhen_6 = ta.valuewhen(zz, zz, 1)
hl := hl == -1 and valuewhen_5 == 1 and zz > valuewhen_6 ? na : hl
valuewhen_7 = ta.valuewhen(hl, hl, 1)
valuewhen_8 = ta.valuewhen(zz, zz, 1)
hl := hl == 1 and valuewhen_7 == -1 and zz < valuewhen_8 ? na : hl
zz := na(hl) ? na : zz

findprevious() =>  // finds previous three points (b, c, d, e)
    ehl = hl == 1 ? -1 : 1
    loc1 = 0.0
    loc2 = 0.0
    loc3 = 0.0
    loc4 = 0.0
    xx = 0
    for x = 1 to 1000 by 1
        if hl[x] == ehl and not na(zz[x])
            loc1 := zz[x]
            xx := x + 1
            break
    ehl := hl
    for x = xx to 1000 by 1
        if hl[x] == ehl and not na(zz[x])
            loc2 := zz[x]
            xx := x + 1
            break
    ehl := hl == 1 ? -1 : 1
    for x = xx to 1000 by 1
        if hl[x] == ehl and not na(zz[x])
            loc3 := zz[x]
            xx := x + 1
            break
    ehl := hl
    for x = xx to 1000 by 1
        if hl[x] == ehl and not na(zz[x])
            loc4 := zz[x]
            break
    [loc1, loc2, loc3, loc4]

float a = na
float b = na
float c = na
float d = na
float e = na
if not na(hl)
    [loc1, loc2, loc3, loc4] = findprevious()
    a := zz
    b := loc1
    c := loc2
    d := loc3
    e := loc4

_hh = zz and a > b and a > c and c > b and c > d
_ll = zz and a < b and a < c and c < b and c < d
_hl = zz and (a >= c and b > c and b > d and d > c and d > e or a < b and a > c and b < d)
_lh = zz and (a <= c and b < c and b < d and d < c and d < e or a > b and a < c and b > d)

plotshape(_hl, text='HL', title='Higher Low', style=shape.labelup, color=color.new(color.lime, 0), textcolor=color.new(color.black, 0), location=location.belowbar, offset=-rb)
plotshape(_hh, text='HH', title='Higher High', style=shape.labeldown, color=color.new(color.lime, 0), textcolor=color.new(color.black, 0), location=location.abovebar, offset=-rb)
plotshape(_ll, text='LL', title='Lower Low', style=shape.labelup, color=color.new(color.red, 0), textcolor=color.new(color.white, 0), location=location.belowbar, offset=-rb)
plotshape(_lh, text='LH', title='Lower High', style=shape.labeldown, color=color.new(color.red, 0), textcolor=color.new(color.white, 0), location=location.abovebar, offset=-rb)

float res = na
float sup = na
res := _lh ? zz : res[1]
sup := _hl ? zz : sup[1]

int trend = na
iff_5 = close < sup ? -1 : nz(trend[1])
trend := close > res ? 1 : iff_5

res := trend == 1 and _hh or trend == -1 and _lh ? zz : res
sup := trend == 1 and _hl or trend == -1 and _ll ? zz : sup
rechange = res != res[1]
suchange = sup != sup[1]

var line resline = na
var line supline = na
//#### Ends Here #####


//Range Filter 5Min
//#### Starts Here #####

src = input(defval=close, title='Source')
per = input.int(defval=100, minval=1, title='Sampling Period')

// Range Multiplier
mult = input.float(defval=3.0, minval=0.1, title='Range Multiplier')

// Smooth Average Range
smoothrng(x, t, m) =>
    wper = t * 2 - 1
    avrng = ta.ema(math.abs(x - x[1]), t)
    smoothrng = ta.ema(avrng, wper) * m
    smoothrng
smrng = smoothrng(src, per, mult)

// Range Filter
rngfilt(x, r) =>
    rngfilt = x
    rngfilt := x > nz(rngfilt[1]) ? x - r < nz(rngfilt[1]) ? nz(rngfilt[1]) : x - r : x + r > nz(rngfilt[1]) ? nz(rngfilt[1]) : x + r
    rngfilt
filt = rngfilt(src, smrng)

// Filter Direction
upward = 0.0
upward := filt > filt[1] ? nz(upward[1]) + 1 : filt < filt[1] ? 0 : nz(upward[1])
downward = 0.0
downward := filt < filt[1] ? nz(downward[1]) + 1 : filt > filt[1] ? 0 : nz(downward[1])

// Target Bands
hband = filt + smrng
lband = filt - smrng

// Colors
filtcolor = upward > 0 ? color.lime : downward > 0 ? color.red : color.orange
barcolor = src > filt and src > src[1] and upward > 0 ? color.lime : src > filt and src < src[1] and upward > 0 ? color.green : src < filt and src < src[1] and downward > 0 ? color.red : src < filt and src > src[1] and downward > 0 ? color.maroon : color.orange

// Break Outs
longCond = bool(na)
shortCond = bool(na)
longCond := src > filt and src > src[1] and upward > 0 or src > filt and src < src[1] and upward > 0
shortCond := src < filt and src < src[1] and downward > 0 or src < filt and src > src[1] and downward > 0

CondIni = 0
CondIni := longCond ? 1 : shortCond ? -1 : CondIni[1]
longCondition = longCond and CondIni[1] == -1
shortCondition = shortCond and CondIni[1] == 1
//#### Ends Here #####


//#### Starts Here #####
source = close
useCurrentRes = input(true, title='Use Current Chart Resolution?')
resCustom = input.timeframe(title='Use Different Timeframe? Uncheck Box Above', defval='60')
smd = input(true, title='Show MacD & Signal Line? Also Turn Off Dots Below')
sd = input(true, title='Show Dots When MacD Crosses Signal Line?')
sh = input(true, title='Show Histogram?')
macd_colorChange = input(true, title='Change MacD Line Color-Signal Line Cross?')
hist_colorChange = input(true, title='MacD Histogram 4 Colors?')

res1 = useCurrentRes ? timeframe.period : resCustom

fastLength = input.int(12, minval=1)
slowLength = input.int(26, minval=1)
signalLength = input.int(9, minval=1)

fastMA = ta.ema(source, fastLength)
slowMA = ta.ema(source, slowLength)

macd = fastMA - slowMA
signal = ta.sma(macd, signalLength)
hist = macd - signal

outMacD = request.security(syminfo.tickerid, res1, macd)
outSignal = request.security(syminfo.tickerid, res1, signal)
outHist = request.security(syminfo.tickerid, res1, hist)

histA_IsUp = outHist > outHist[1] and outHist > 0
histA_IsDown = outHist < outHist[1] and outHist > 0
histB_IsDown = outHist < outHist[1] and outHist <= 0
histB_IsUp = outHist > outHist[1] and outHist <= 0

//MacD Color Definitions
macd_IsAbove = outMacD >= outSignal
macd_IsBelow = outMacD < outSignal

plot_color = hist_colorChange ? histA_IsUp ? color.aqua : histA_IsDown ? color.blue : histB_IsDown ? color.red : histB_IsUp ? color.maroon : color.yellow : color.gray
macd_color = macd_colorChange ? macd_IsAbove ? color.lime : color.red : color.red
signal_color = macd_colorChange ? macd_IsAbove ? color.yellow : color.yellow : color.lime

circleYPosition = outSignal
//#### Ends Here #####


//////////////////
// Main Strategy
/////////////////
//#### Starts Here #####
var bottomText = 'Something is not ok'

bool rangeBuy = false
if longCondition
    rangeBuy := true
else
    rangeBuy := false

bool rangeSell = false
if shortCondition
    rangeSell := true
else
    rangeSell := false

bool ema100Bullish = false
bool ema100Bearish = false
bool ichimokuBearish = false
bool ichimokuBullish = false
string statusChance = 'Who knows what will happen'
string futureIchimokuTrend = 'Anything can happen'

if close > ema100
    ema100Bullish := true
    ema100Bearish := false
else
    ema100Bullish := false
    ema100Bearish := true

if displacedSenkouA > displacedSenkouB
    ichimokuBearish := false
    futureIchimokuTrend := 'Green - chance to go up'
    ichimokuBullish := true
else
    ichimokuBearish := true
    futureIchimokuTrend := 'Red - chance to go down'
    ichimokuBullish := false
    ichimokuBullish

if ema100Bullish and parabolicSARGreen
    if ichimokuBullish
        statusChance := '100%'
    else
        statusChance := '95%'
else
    if ema100Bullish and parabolicSARRed
        statusChance := '75%'
    else if ema100Bearish and parabolicSARGreen
        statusChance := '65%'
    else
        statusChance := '55%'

bool longTradePosition = false
bool shortTradePosition = false
string longTradeText = 'Now cannot say anything'

if (swingCallGreen or swingCallYellow) and ichimokuBullish and longCondition and ema100Bullish and parabolicSARGreen
    longTradePosition := true
    longTradeText := 'Bullish'

bottomText := longTradeText + ' Chance: ' + statusChance + '\n Future Trend: ' + futureIchimokuTrend
// Bottom Text

var tLog = table.new(position=position.bottom_right, rows=1, columns=2, bgcolor=color.blue, border_width=1)
table.cell(tLog, row=0, column=0, text=bottomText, text_color=color.white)
table.cell_set_text(tLog, row=0, column=0, text=bottomText)
//#### Ends Here #####

bool entryLongPosition = false
bool exitLongPosition = false

bool entryShortPosition = false
bool exitShortPosition = false

bool longPositionCount = false
bool shortPositionCount = false


if (strategy.position_size > 0)
    longPositionCount := true

if (strategy.position_size < 0)
    shortPositionCount := true

// Entry LONG
if (longCondition) and (not longPositionCount)
    entryLongPosition := true

// Exit LONG
if (shortCondition) and (longPositionCount)
    exitLongPosition := true

// Entry SHORT
if (shortCondition) and (not shortPositionCount)
    entryShortPosition := true

// Exit SHORT
if (longCondition) and (shortPositionCount)
    exitShortPosition := true

// LONG Entry & Exit
plotshape(entryLongPosition, style=shape.labeldown, location=location.abovebar, color=color.new(color.green, 0), size=size.tiny, title='buy label', text='5cel\nLONG Entry', textcolor=color.new(color.white, 0))
plotshape(exitLongPosition, style=shape.labelup, location=location.belowbar, color=color.new(color.blue, 0), size=size.tiny, title='sell label', text='5cel\nExit LONG', textcolor=color.new(color.white, 0))

//SHORT Entry & Exit
plotshape(entryShortPosition, style=shape.labeldown, location=location.abovebar, color=color.new(color.red, 0), size=size.tiny, title='buy label', text='5cel\nSHORT Entry', textcolor=color.new(color.white, 0))
plotshape(exitShortPosition, style=shape.labelup, location=location.belowbar, color=color.new(color.blue, 0), size=size.tiny, title='sell label', text='5cel\nExit SHORT', textcolor=color.new(color.white, 0))

//Get the Current Value
heikinashi_close = request.security(ticker.heikinashi(syminfo.tickerid), timeframe.period, close)

if entryLongPosition
    longLabel = label.new(bar_index, high, text=str.tostring(heikinashi_close, '0.00'), color=color.orange, style=label.style_label_down, yloc=yloc.abovebar)

if entryShortPosition
    shortLabel = label.new(bar_index, high, text=str.tostring(heikinashi_close, '0.00'), color=color.orange, style=label.style_label_down, yloc=yloc.abovebar)

/// SHORT Exit
strategy.close("short", when=exitShortPosition, comment="close_short_position")

/// LONG Exit
strategy.close("long", when=exitLongPosition, comment = "close_long_position")

/// LONG Enter
strategy.entry("long", strategy.long, when=entryLongPosition, comment="open_long_position")

/// SHORT Enter
strategy.entry("short", strategy.short, when = entryShortPosition, comment="open_short_position")