Recherche de drapeaux améliorés Super Trend
Résumé: Cette stratégie combine habilement le modèle de la bannière de rupture progressive avec le célèbre indicateur de la super-tendance pour réaliser une méthode unique d’identification des bannières. Elle permet non seulement de découvrir les bannières traditionnelles, mais également d’utiliser l’indicateur de la super-tendance pour déterminer la direction de la tendance et la position de l’arrêt potentiel.
Le principe de la stratégie:
- Identification du drapeau
- Identifier les barres et les zones de tri en suivant dynamiquement les prix les plus élevés et les plus bas
- Déterminer si la profondeur/l’élévation de la zone de rangement et la longueur du drapeau sont conformes aux exigences en fonction des paramètres définis par l’utilisateur
- Une fois que le drapeau est formé, marquez-le avec des bandes de couleur correspondante.
- Intégration des tendances extrêmes
- Utilisez des indicateurs hypertrend simples et efficaces pour afficher les tendances en temps réel sur les graphiques
- Le jugement de direction combiné avec la forme du drapeau permet de confirmer la bonne orientation du drapeau.
- Les lignes de tendance supérieure offrent également une position de stop-loss potentielle pour les transactions.
Dans l’ensemble, l’intégration de la forme du drapeau avec le Zero-Lag de la tendance supérieure permet d’obtenir une stratégie de suivi de tendance facile à utiliser, qui s’intègre parfaitement, l’identification du drapeau et le stop-loss de la tendance supérieure.
Avantages stratégiques:
L’analyse des technologies traditionnelles et le suivi des tendances L’intégration de la forme du drapeau et de la tendance hyper, de la reconnaissance graphique et du suivi dynamique, est une stratégie hybride unique.
Fournir une position de stop-loss potentielle Les hypertrends fournissent une position de stop-loss claire pour chaque transaction, aidant à la gestion des risques de la stratégie.
Facilité d’utilisation La stratégie fournit un ensemble de paramètres réglables que l’utilisateur peut personnaliser en fonction de ses préférences de trading.
Le commerce bidirectionnel multichannel est pleinement soutenu La stratégie prend en charge à la fois les opérations à la hausse et à la baisse, s’applique à n’importe quel environnement de marché et est très complète.
Les risques stratégiques:
Le drapeau est déformé Lorsque le drapeau s’organise au-delà des paramètres définis ou s’étend dans la direction de la tendance initiale, il se produit une corruption du drapeau, entraînant un signal erroné.
Identification des points de basculement en retard sur la tendance Les lignes de tendance supérieure présentent un certain retard et peuvent avoir des points de glissement plus importants lors des virages de tendance.
Optimisation des paramètres Les différents paramètres ont un impact significatif sur la performance de la stratégie et doivent être optimisés pour trouver la meilleure combinaison de paramètres.
Période de négociation Si vous choisissez uniquement les transactions unilatérales, vous limiterez le champ d’application de la stratégie.
Les stratégies d’optimisation
- Test de différentes combinaisons de paramètres de hypertrends pour trouver le paramètre optimal;
- Optimiser les paramètres de la forme du drapeau pour une reconnaissance plus précise et plus fiable;
- Essayez d’enrichir la stratégie en combinant d’autres indicateurs comme la moyenne, le modèle K-line, etc.
- Ajout de modules tels que la stratégie de stop loss, la gestion des positions, etc. pour améliorer la stabilité de la stratégie.
Résumé: Cette stratégie de reconnaissance de drapeaux améliorant la hypertrend est une stratégie de tendance unique, un mélange de drapeaux et de hypertrends. Elle combine la prééminence de la reconnaissance graphique et la chronologie de la dynamique de la hypertrend, ce qui permet une combinaison parfaite d’analyse technique traditionnelle et de quantification numérique. La configuration facile à utiliser permet une large utilisation dans une variété de types de transactions, tandis que les paramètres réglables permettent également aux traders de personnaliser la configuration en fonction de leurs préférences.
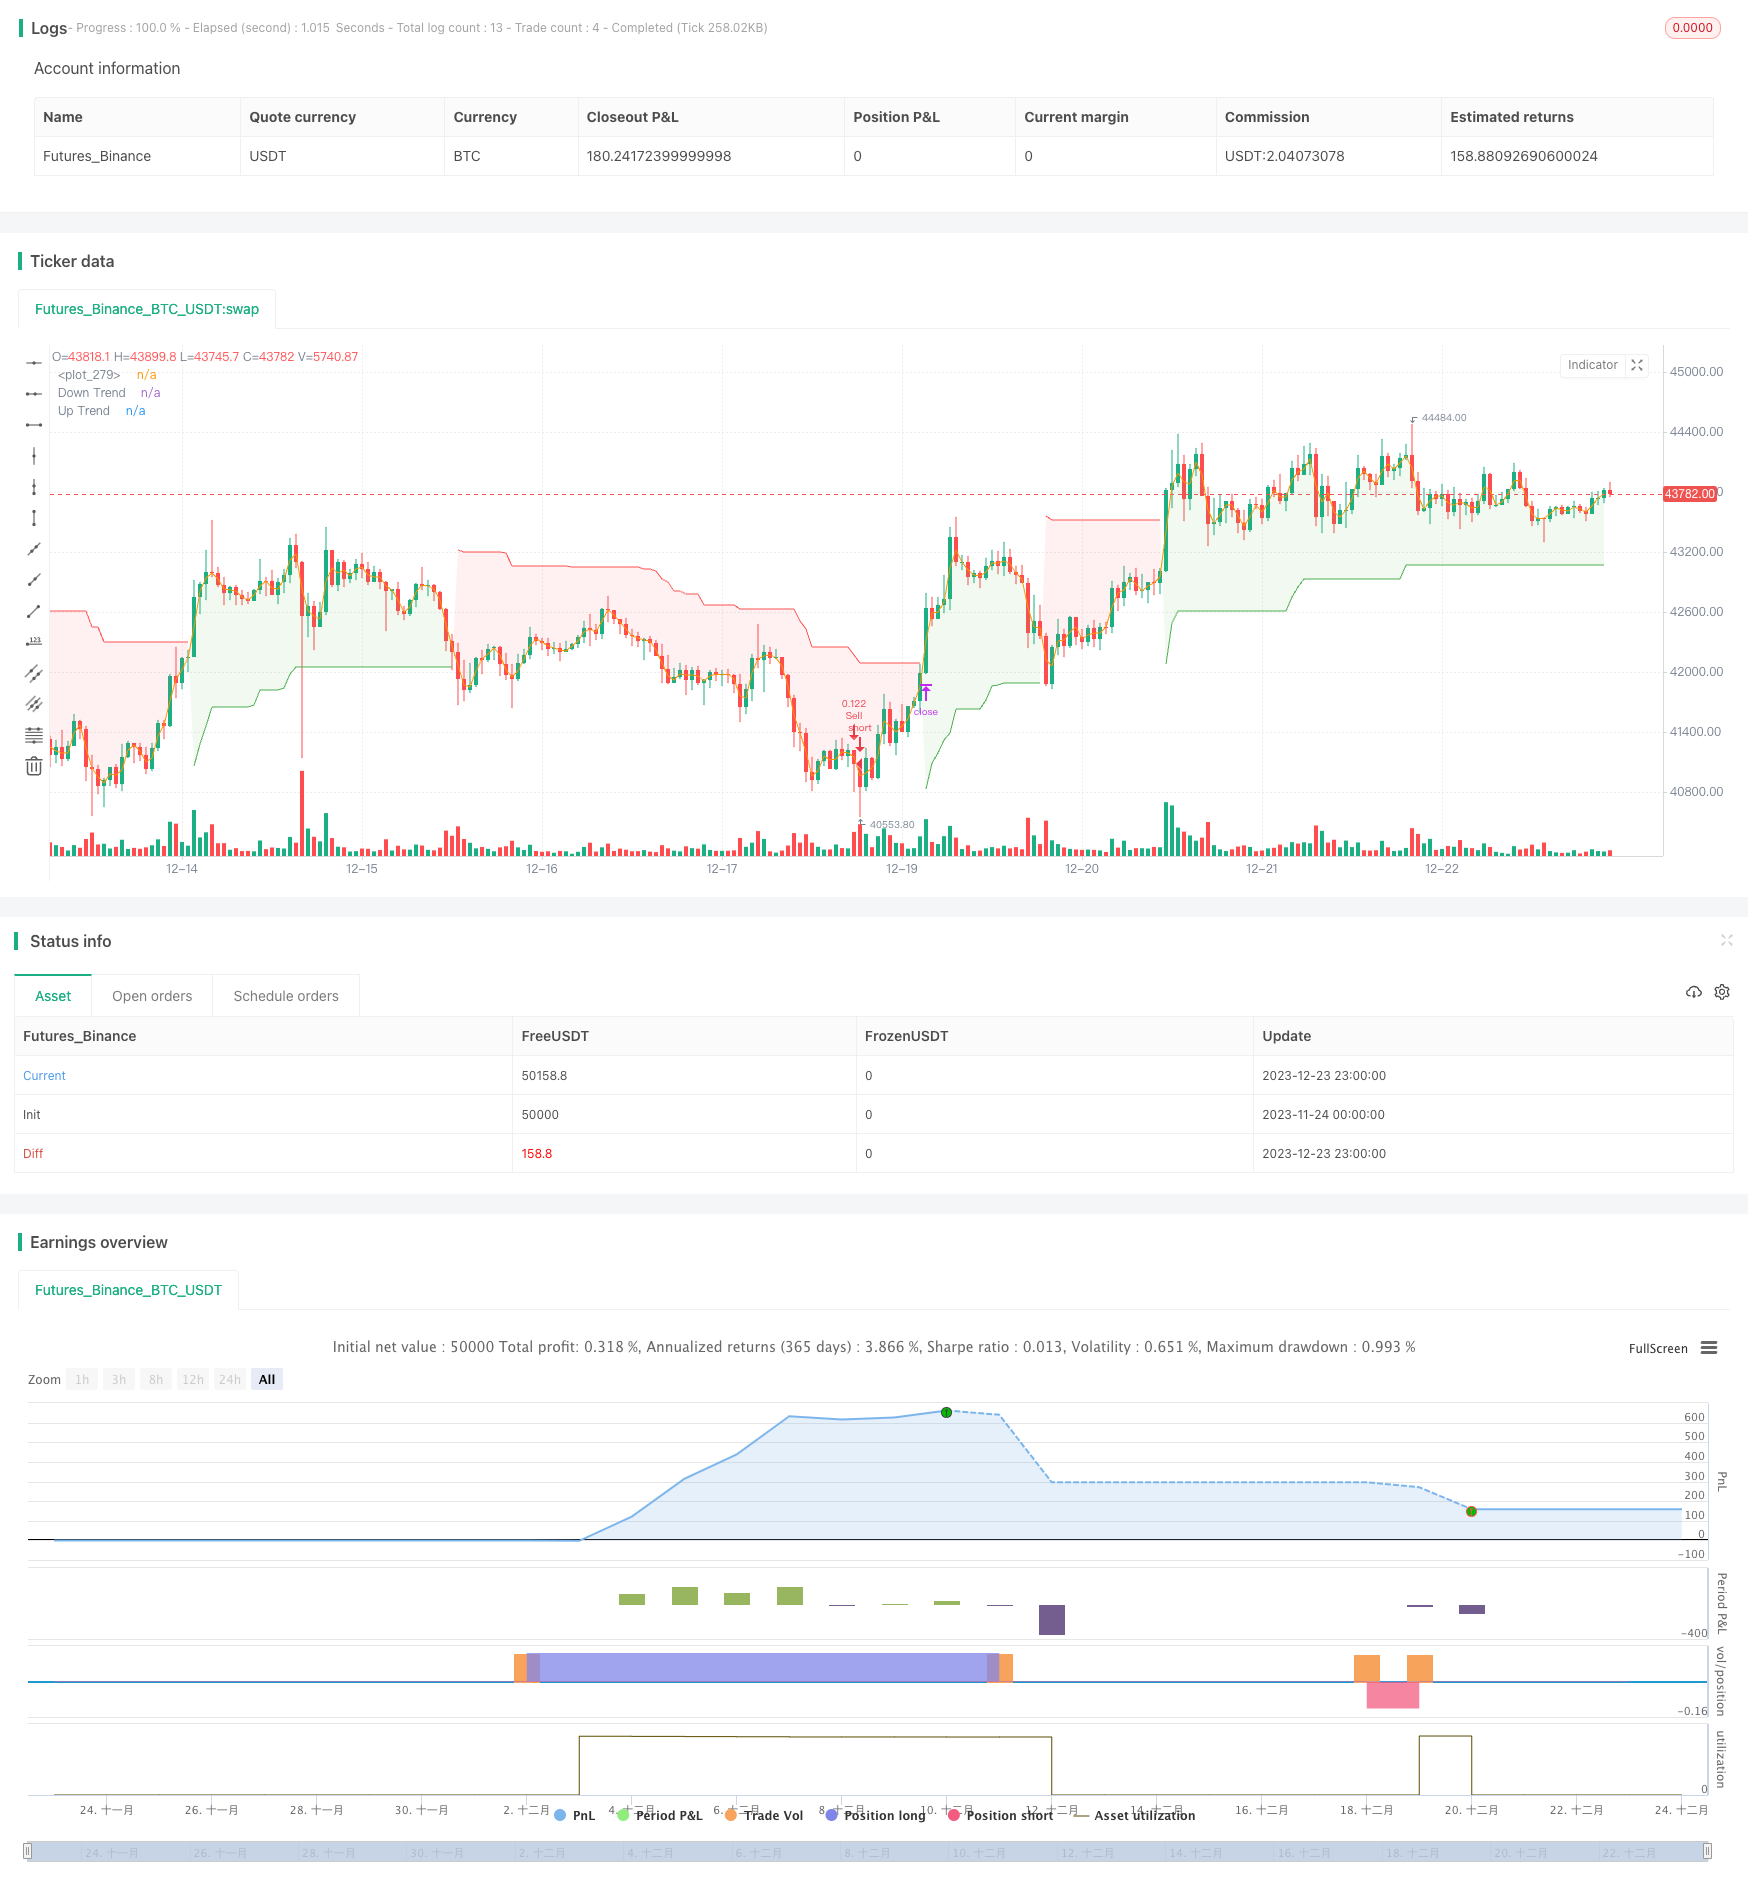
/*backtest
start: 2023-11-24 00:00:00
end: 2023-12-24 00:00:00
period: 1h
basePeriod: 15m
exchanges: [{"eid":"Futures_Binance","currency":"BTC_USDT"}]
*/

// This source code is subject to the terms of the Mozilla Public License 2.0 at https://mozilla.org/MPL/2.0/
// © Amphibiantrading

//@version=5
strategy("TrendGuard Flag Finder - Strategy [presentTrading]", overlay = true, precision=3, default_qty_type=strategy.cash,
 commission_value= 0.1, commission_type=strategy.commission.percent, slippage= 1,
  currency=currency.USD, default_qty_type = strategy.percent_of_equity, default_qty_value = 10, initial_capital= 10000)

//inputs
//user controlled settings for the indicator, separated into 4 different groups

// Add a button to choose the trading direction
tradingDirection = input.string("Both","Trading Direction", options=["Long", "Short", "Both"])

// Supertrend parameters
SupertrendPeriod = input(10, "Supertrend Length",group ='SuperTrend Criteria')
SupertrendFactor = input.float(4.0, "Supertrend Factor", step = 0.01,group ='SuperTrend Criteria')

// Flag parameters
var g1 = 'Bull Flag Criteria'

max_depth = input.float(5, 'Max Flag Depth', step = .25, minval = 2.0, group = g1, tooltip = 'Maximum pullback allowed from flag high to flag low')
max_flag = input.int(7, 'Max Flag Length', group = g1, tooltip = 'The maximum number of bars the flag can last')
min_flag = input.int(3, 'Min Flag Length', group = g1, tooltip = 'The minimum number of bars required for the flag')
poleMin = input.float(3.0, 'Prior Uptrend Minimum', group = g1, tooltip = 'The minimum percentage gain required before a flag forms')
poleMaxLen = input.int(13, 'Max Flag Pole Length', minval = 1, group = g1, tooltip = 'The maximum number of bars the flagpole can be')
poleMinLen = input.int(7, 'Min Flag Pole Length', minval = 1, group = g1, tooltip = 'The minimum number of bars required for the flag pole')

var g2 = 'Bear Flag Criteria'

max_rally = input.float(5, 'Max Flag Rally', step = .25, minval = 2.0, group = g2, tooltip = 'Maximum rally allowed from flag low to flag low')
max_flagBear = input.int(7, 'Max Flag Length', group = g2, tooltip = 'The maximum number of bars the flag can last')
min_flagBear = input.int(3, 'Min Flag Length', group = g2, tooltip = 'The minimum number of bars required for the flag')
poleMinBear = input.float(3.0, 'Prior Downtrend Minimum', group = g2, tooltip = 'The minimum percentage loss required before a flag forms')
poleMaxLenBear = input.int(13, 'Max Flag Pole Length', minval = 1, group = g2, tooltip = 'The maximum number of bars the flagpole can be')
poleMinLenBear = input.int(7, 'Min Flag Pole Length', minval = 1, group = g2, tooltip = 'The minimum number of bars required for the flag pole')

var g3 = 'Bull Flag Display Options'

showF = input.bool(true, 'Show Bull Flags', group = g3)
showBO = input.bool(true,'Show Bull Flag Breakouts', group = g3)
lineColor = input.color(color.green, 'Bull Line Color', group = g3)
lineWidth = input.int(2, 'Bull Line Width', minval = 1, maxval = 5, group = g3)

var g4 = 'Bear Flag Display Options'

showBF = input.bool(true, 'Show Bear Flags', group = g4)
showBD = input.bool(true,'Show Bear Flag Breakdowns', group = g4)
lineColorBear = input.color(color.red, 'Bear Flag Line Color', group = g4)
lineWidthBear = input.int(2, 'Bear Flag Line Width', minval = 1, maxval = 5, group = g4)


//variables
//declare starting variables used for identfying flags
var baseHigh = high, var startIndex = 0, var flagLength = 0, var baseLow = low
var lowIndex = 0, var flagBool = false, var poleLow = 0.0, var poleLowIndex = 0
var line flagHLine = na, var line flagLLine = na, var line flagPLine = na

// bear flag variables
var flagLowBear = high, var startIndexBear = 0, var flagLengthBear = 0, var flagHigh = low
var highIndex = 0, var flagBoolBear = false, var poleHigh = 0.0, var polehighIndex = 0
var line flagBearHLine = na, var line flagBearLLine = na, var line flagBearPLine = na

//find bull flag highs
// check to see if the current bars price is higher than the previous base high or na and then sets the variables needed for flag detection
if high > baseHigh or na(baseHigh)
    baseHigh := high
    startIndex := bar_index
    flagLength := 0
    baseLow := low
    lowIndex := bar_index
// check to see if the low of the current bar is lower than the base low, if it is set the base low to the low
if high <= baseHigh and low < baseLow
    baseLow := low
    lowIndex := bar_index
// moves the base low from the base high bar_index to prevent the high and low being the same bar
if high <= baseHigh and lowIndex == startIndex
    baseLow := low
    lowIndex := bar_index

//find bear flag lows
// check to see if the current bars price is lower than the previous flag low or na and then sets the variables needed for flag detection
if low < flagLowBear or na(flagLowBear)
    flagLowBear := low
    startIndexBear := bar_index
    flagLengthBear := 0
    flagHigh := high
    highIndex := bar_index
// check to see if the high of the current bar is higher than the flag high, if it is set the flag high to the high
if low >= flagLowBear and high > flagHigh
    flagHigh := high
    highIndex := bar_index
// moves the flag high from the flag low bar_index to prevent the high and low being the same bar
if low >= flagLowBear and highIndex == startIndexBear
    flagHigh := high
    highIndex := bar_index

//calulations bullish
findDepth = math.abs(((baseLow / baseHigh) - 1) * 100)  //calculate the depth of the flag
poleDepth = ((baseHigh / poleLow)- 1) * 100 // calculate the low of the flag pole to the base high
lower_close = close < close[1] // defines a lower close

//calculations bearish
findRally = math.abs(((flagHigh / flagLowBear) - 1) * 100)   //calculate the rally of the flag
poleDepthBear = ((flagLowBear / poleHigh)- 1) * 100 // calculate the high of the flag pole to the low high
higher_close = close > close[1] // defines a higher close

//start the counters
// begins starting bars once a high is less than the flag high
if high < baseHigh and findDepth <= max_depth or (high == baseHigh and lower_close)
    flagLength += 1
else
    flagLength := 0

// begins starting bars once a low is higher than the flag low
if low > flagLowBear and findRally <= max_rally or (low == flagLowBear and higher_close)
    flagLengthBear += 1
else
    flagLengthBear := 0

// check for prior uptrend / downtrend to meet requirements
// loops through all the bars from the minimum pole length to the maximum pole length to check if the prior uptrend requirements are met and sets the variables to their new values
if high == baseHigh
    for i = poleMinLen to poleMaxLen
        if ((high / low[i]) - 1) * 100 >= poleMin
            flagBool := true
            poleLow := low[i]
            poleLowIndex := bar_index[i]
            break

// loops through all the bars from the minimum pole length to the maximum pole length to check if the prior downtrend requirements are met and sets the variables to their new values
if low == flagLowBear
    for i = poleMinLenBear to poleMaxLenBear
        if math.abs(((low / high[i]) - 1) * 100) >= poleMinBear
            flagBoolBear := true
            poleHigh := high[i]
            polehighIndex := bar_index[i]
            break


// reset variables if criteria for a flag is broken
// if the depth of the bull flag is greater than the maximum depth limit or the flag lasts longer than the maximum length everything is reset to beging looking for a new flag
if findDepth >= max_depth or flagLength > max_flag
    flagBool := false
    flagLength := 0
    baseHigh := na
    startIndex := na
    lowIndex := na
    baseLow := na

// if the rally of the bear flag is greater than the maximum rally limit or the flag lasts longer than the maximum length everything is reset to beging looking for a new flag
if findRally >= max_rally or flagLengthBear > max_flagBear
    flagBoolBear := false
    flagLengthBear := 0
    flagLowBear := na
    startIndexBear := na
    highIndex := na
    flagHigh := na

// reset the variables and begin looking for a new bull flag if price continues higher before the minimum flag length requirement is met
if high > baseHigh[1] and flagLength < min_flag
    baseHigh := high
    flagLength := 0
    startIndex := bar_index
    lowIndex := bar_index
    baseLow := low

// reset the variables and begin looking for a new bear flag if price continues lower before the minimum bear flag length requirement is met
if low < flagLowBear[1] and flagLengthBear < min_flagBear
    flagLowBear := low
    flagLengthBear := 0
    startIndexBear := bar_index
    highIndex := bar_index
    flagHigh := high


//define the flags
// if all requirements are met a bull flag is true, flagBool is true, flag length is less than maximum set length and more than miminum required. The prior run up also meets the requirements for length and price
flag = flagBool == true and flagLength < max_flag and findDepth < max_depth and flagLength >= min_flag and startIndex - poleLowIndex <= poleMaxLen

// if all requirements are met a bear flag is true, flagBoolBear is true, flag length is less than maximum set length and more than miminum required. The prior downtrend also meets the requirements for length and price
bearFlag = flagBoolBear == true and flagLengthBear < max_flagBear and findRally < max_rally and flagLengthBear >= min_flagBear and startIndexBear - polehighIndex <= poleMaxLen


//define flags, breakouts, breadowns
// a breakout is defined as the high going above the flag high and the length of the flag is greater than the minimum requirement. The flag boolean must also be true
breakout = high > baseHigh[1] and flagLength >= min_flag and flagBool == true
//a breakdown is defined as the depth of the flag being larger than user set parameter or the length of the flag exceeded the maximum flag length
breakdown = findDepth >= max_depth or flagLength > max_flag
// a separate variable to have breakouts only plot once using a plotshape
plotBO = flag[1] and high > baseHigh[1] and flagLength[1] >= min_flag and flagBool == true

// a bear flag breakout is defined as the low going below the flag low and the length of the flag is greater than the minimum requirement. The flag boolean must also be true
breakoutBear = low < flagLowBear[1] and flagLengthBear >= min_flagBear and flagBoolBear == true
//a breakdown is defined as the rally of the flag being larger than user set parameter or the length of the flag exceeded the maximum flag length
breakdownBear = findRally >= max_rally or flagLengthBear > max_flagBear
// a separate variable to have breakouts only plot once using a plotshape
plotBD = bearFlag[1] and low < flagLowBear[1] and flagLengthBear[1] >= min_flagBear and flagBoolBear == true

// // if a bul flag is detected and the user has bull flags selected from the settings menu draw it on the chart
// if flag and showF
//     //if a flag was detected on the previous bar, delete those lines and allow for new lines to be drawn
//     if flag[1]
//         line.delete(flagHLine[1]), line.delete(flagLLine[1]), line.delete(flagPLine[1])
//     //draw new lines
//     flagHLine := line.new(startIndex, baseHigh, bar_index, baseHigh, color=lineColor, width = lineWidth)
//     flagLLine := line.new(startIndex, baseLow, bar_index, baseLow, color=lineColor, width = lineWidth)
//     flagPLine := line.new(poleLowIndex +1, poleLow, startIndex , baseLow, color=lineColor, width = lineWidth)

// // if a bear flag is detected and the user has bear flags selected from the settings menu draw it on the chart
// if bearFlag and showBF
//     //if a bear flag was detected on the previous bar, delete those lines and allow for new lines to be drawn
//     if bearFlag[1]
//         line.delete(flagBearHLine[1]), line.delete(flagBearLLine[1]), line.delete(flagBearPLine[1])
//     //draw new lines
//     flagBearHLine := line.new(startIndexBear, flagHigh, bar_index, flagHigh, color=lineColorBear, width = lineWidthBear)
//     flagBearLLine := line.new(startIndexBear, flagLowBear, bar_index, flagLowBear, color=lineColorBear, width = lineWidthBear)
//     flagBearPLine := line.new(polehighIndex + 1, poleHigh, startIndexBear , flagHigh, color=lineColorBear, width = lineWidthBear)

//reset variables if a breakout occurs
if breakout // bull flag - high gets above flag high
    flagLength := 0
    baseHigh := high
    startIndex := bar_index
    lowIndex := bar_index
    baseLow := low

if breakoutBear // bear flag - low gets below flag low
    flagLengthBear := 0
    flagLowBear := low
    startIndexBear := bar_index
    highIndex := bar_index
    flagHigh := high

//reset the variables and highs from a failed bull flag. This allows stocks below previous highs to find new flags
highest = ta.highest(high, 10) // built in variable that finds the highest high lookingback the past 10 bars
if breakdown or flagLength == max_flag
    flagBool := false
    baseHigh := highest
    startIndex := bar_index
    lowIndex := bar_index
    baseLow := low

//reset the variables and lows from a failed bear flag. This allows stocks above previous lows to find new flags
lowest = ta.lowest(low, 10) // built in variable that finds the lowest low lookingback the past 10 bars
if breakdownBear or flagLengthBear == max_flagBear
    flagBoolBear := false
    flagLowBear := lowest
    startIndexBear := bar_index
    highIndex := bar_index
    flagHigh := high

// if a flag breakdowns remove the lines from the chart
// if (breakdown and flag[1])
//     line.delete(flagHLine)
//     line.delete(flagLLine)
//     line.delete(flagPLine)

// if (breakdownBear and bearFlag[1])
//     line.delete(flagBearHLine)
//     line.delete(flagBearLLine)
//     line.delete(flagBearPLine)

//plot breakouts
// use a plotshape to check if there is a breakout and the show breakout option is selected. If both requirements are met plot a shape at the breakout bar
plotshape(plotBO and showBO and showF, 'Breakout', shape.triangleup, location.belowbar, color.green)

// use a plotshape to check if there is a breakout and the show breakout option is selected. If both requirements are met plot a shape at the breakout bar
plotshape(plotBD and showBD and showBF, 'Breakout', shape.triangledown, location.abovebar, color.red)

// Define entry and exit conditions based on the indicator
bullishEntryFlag = plotBO and showBO and showF
bearishEntryFlag = plotBD and showBD and showBF

// Calculate Supertrend
[supertrend, direction] = ta.supertrend(SupertrendFactor, SupertrendPeriod)

bodyMiddle = plot((open + close) / 2, display=display.none)
upTrend = plot(direction < 0 ? supertrend : na, "Up Trend", color = color.green, style=plot.style_linebr)
downTrend = plot(direction < 0? na : supertrend, "Down Trend", color = color.red, style=plot.style_linebr)

fill(bodyMiddle, upTrend, color.new(color.green, 90), fillgaps=false)
fill(bodyMiddle, downTrend, color.new(color.red, 90), fillgaps=false)

// Define entry and exit conditions based on the indicator
bullishEntryST = direction < 0
bearishEntryST = direction > 0

// Entry
bullishEntry = bullishEntryFlag and bullishEntryST
bearishEntry = bearishEntryFlag and bearishEntryST

// Modify entry and exit conditions based on the selected trading direction
if (bullishEntry and (tradingDirection == "Long" or tradingDirection == "Both"))
    strategy.entry("Buy", strategy.long)
    strategy.exit("Sell", "Buy", stop=supertrend)
if (bearishEntry and (tradingDirection == "Short" or tradingDirection == "Both"))
    strategy.entry("Sell", strategy.short)
    strategy.exit("Cover", "Sell", stop=supertrend)

// Exit conditions
if (strategy.position_size > 0 and bearishEntry and (tradingDirection == "Long" or tradingDirection == "Both")) // If in a long position and bearish entry condition is met
    strategy.close("Buy")
if (strategy.position_size < 0 and bullishEntry and (tradingDirection == "Short" or tradingDirection == "Both")) // If in a short position and bullish entry condition is met
    strategy.close("Sell")