Stratégie de suivi de tendance basée sur le RSI et la moyenne mobile pondérée
Aperçu
Cette stratégie est basée sur deux indicateurs bien connus: l’indicateur de relative faiblesse (RSI) et la moyenne mobile pondérée (WMA), utilisés pour identifier les tendances du marché et suivre leur direction. Le RSI est utilisé pour déterminer les surachats et les surventes, et le WMA pour déterminer les tendances des prix, qui, combinés, permettent de filtrer efficacement les signaux non pertinents et d’améliorer la probabilité de réalisation de profits.
Principe de stratégie
Indicateur RSI
Le RSI est l’un des indicateurs les plus connus de l’hyper-achat et de l’hyper-vente. Sa formule est:
\[RSI = 100 - \frac{100}{1+\frac{AvgGain}{AvgLoss}}\]
où AvgGain est la somme des prix de clôture supérieurs au prix d’ouverture sur une période donnée, divisée par le nombre de jours, et AvgLoss est la somme des valeurs absolues des prix de clôture inférieurs au prix d’ouverture, divisée par le nombre de jours.
La stratégie définit le cycle RSI à 20 comme indicateur de tendance. Un signal de tête blanche est généré lorsque le RSI est supérieur à 60 et un signal de tête blanche lorsque le RSI est inférieur à 40.
Moyenne mobile pondérée WMA
La WMA est plus forte que la SMA pour la correction des prix à court terme. La formule de calcul est:
\[WMA = \frac{\sum_{i=1}^n w_i x_i}{\sum_{i=1}^n w_i}\]
w est le poids, qui augmente de façon exponentielle à mesure que i augmente. La formule de poids utilisée dans cette stratégie est:
\[w = \begin{cases} 100/(4+(n-4)*1.3), & i <= 3 \ 1.3*w, & i > 3 \end{cases}\]
Le poids des 3 derniers jours est le même, puis chaque jour précédent le poids augmente de 1,3 fois. Cela permet de souligner l’impact des prix récents.
Dans cette stratégie, la durée du WMA est de 20 jours.
Signaux stratégiques
Signaux multiples: RSI > 60 et WMA 20 jours ROC < -1
Signal de tête vide: RSI < 40 et WMA 20 jours ROC > 1
La formule pour calculer le ROC de 20 jours de la WMA est la suivante:
Donc, vous pouvez voir que la valeur de la valeur de la valeur de la valeur de la valeur de la valeur de la valeur.
Avantages stratégiques
- Utilisez le RSI pour déterminer la direction de la tendance et éviter de perdre votre argent dans un marché en crise
- La WMA juge les principales tendances en réévaluant la réduction du bruit
- Le RSI et le WMA ROC sont utilisés en combinaison pour filtrer efficacement les signaux non liés
- Le suivi des arrêts permet de verrouiller les bénéfices de manière flexible avec plusieurs arrêts aléatoires ATR.
- Les méthodes de gestion de fonds permettent d’ajuster la taille des positions en fonction des pertes et des gains, et de contrôler les risques.
Risque stratégique
- Des paramètres stratégiques inappropriés peuvent entraîner des transactions fréquentes et des paramètres d’optimisation sont recommandés
- Une mauvaise configuration des points de rupture peut augmenter les pertes
- La stratégie de suivi des tendances n’est pas adaptée aux marchés de stockage de choc.
- Attention aux changements macroéconomiques et, le cas échéant, à la compensation manuelle
Orientation de l’optimisation de la stratégie
- Tester la longueur du RSI, la longueur du WMA et le seuil du ROC pour trouver la combinaison optimale de paramètres
- Tester différentes méthodes de gestion de fonds pour trouver le meilleur plan de redressement de position
- Ajout d’autres indicateurs pour filtrer davantage les signaux
- Combiné à une stratégie de stop-loss, réduire le risque de perte individuelle
- Optimiser les stratégies de freinage pour maximiser les bénéfices dans la tendance
Résumer
Cette stratégie utilise l’ensemble des indicateurs RSI et WMA pour déterminer la direction de la tendance et tirer profit des principales tendances. En utilisant à la fois la gestion des fonds et la stratégie de contrôle des risques, elle a une certaine valeur de combat. Cependant, les paramètres de configuration et le mécanisme d’arrêt des pertes doivent être constamment testés et optimisés pour obtenir de meilleurs résultats.
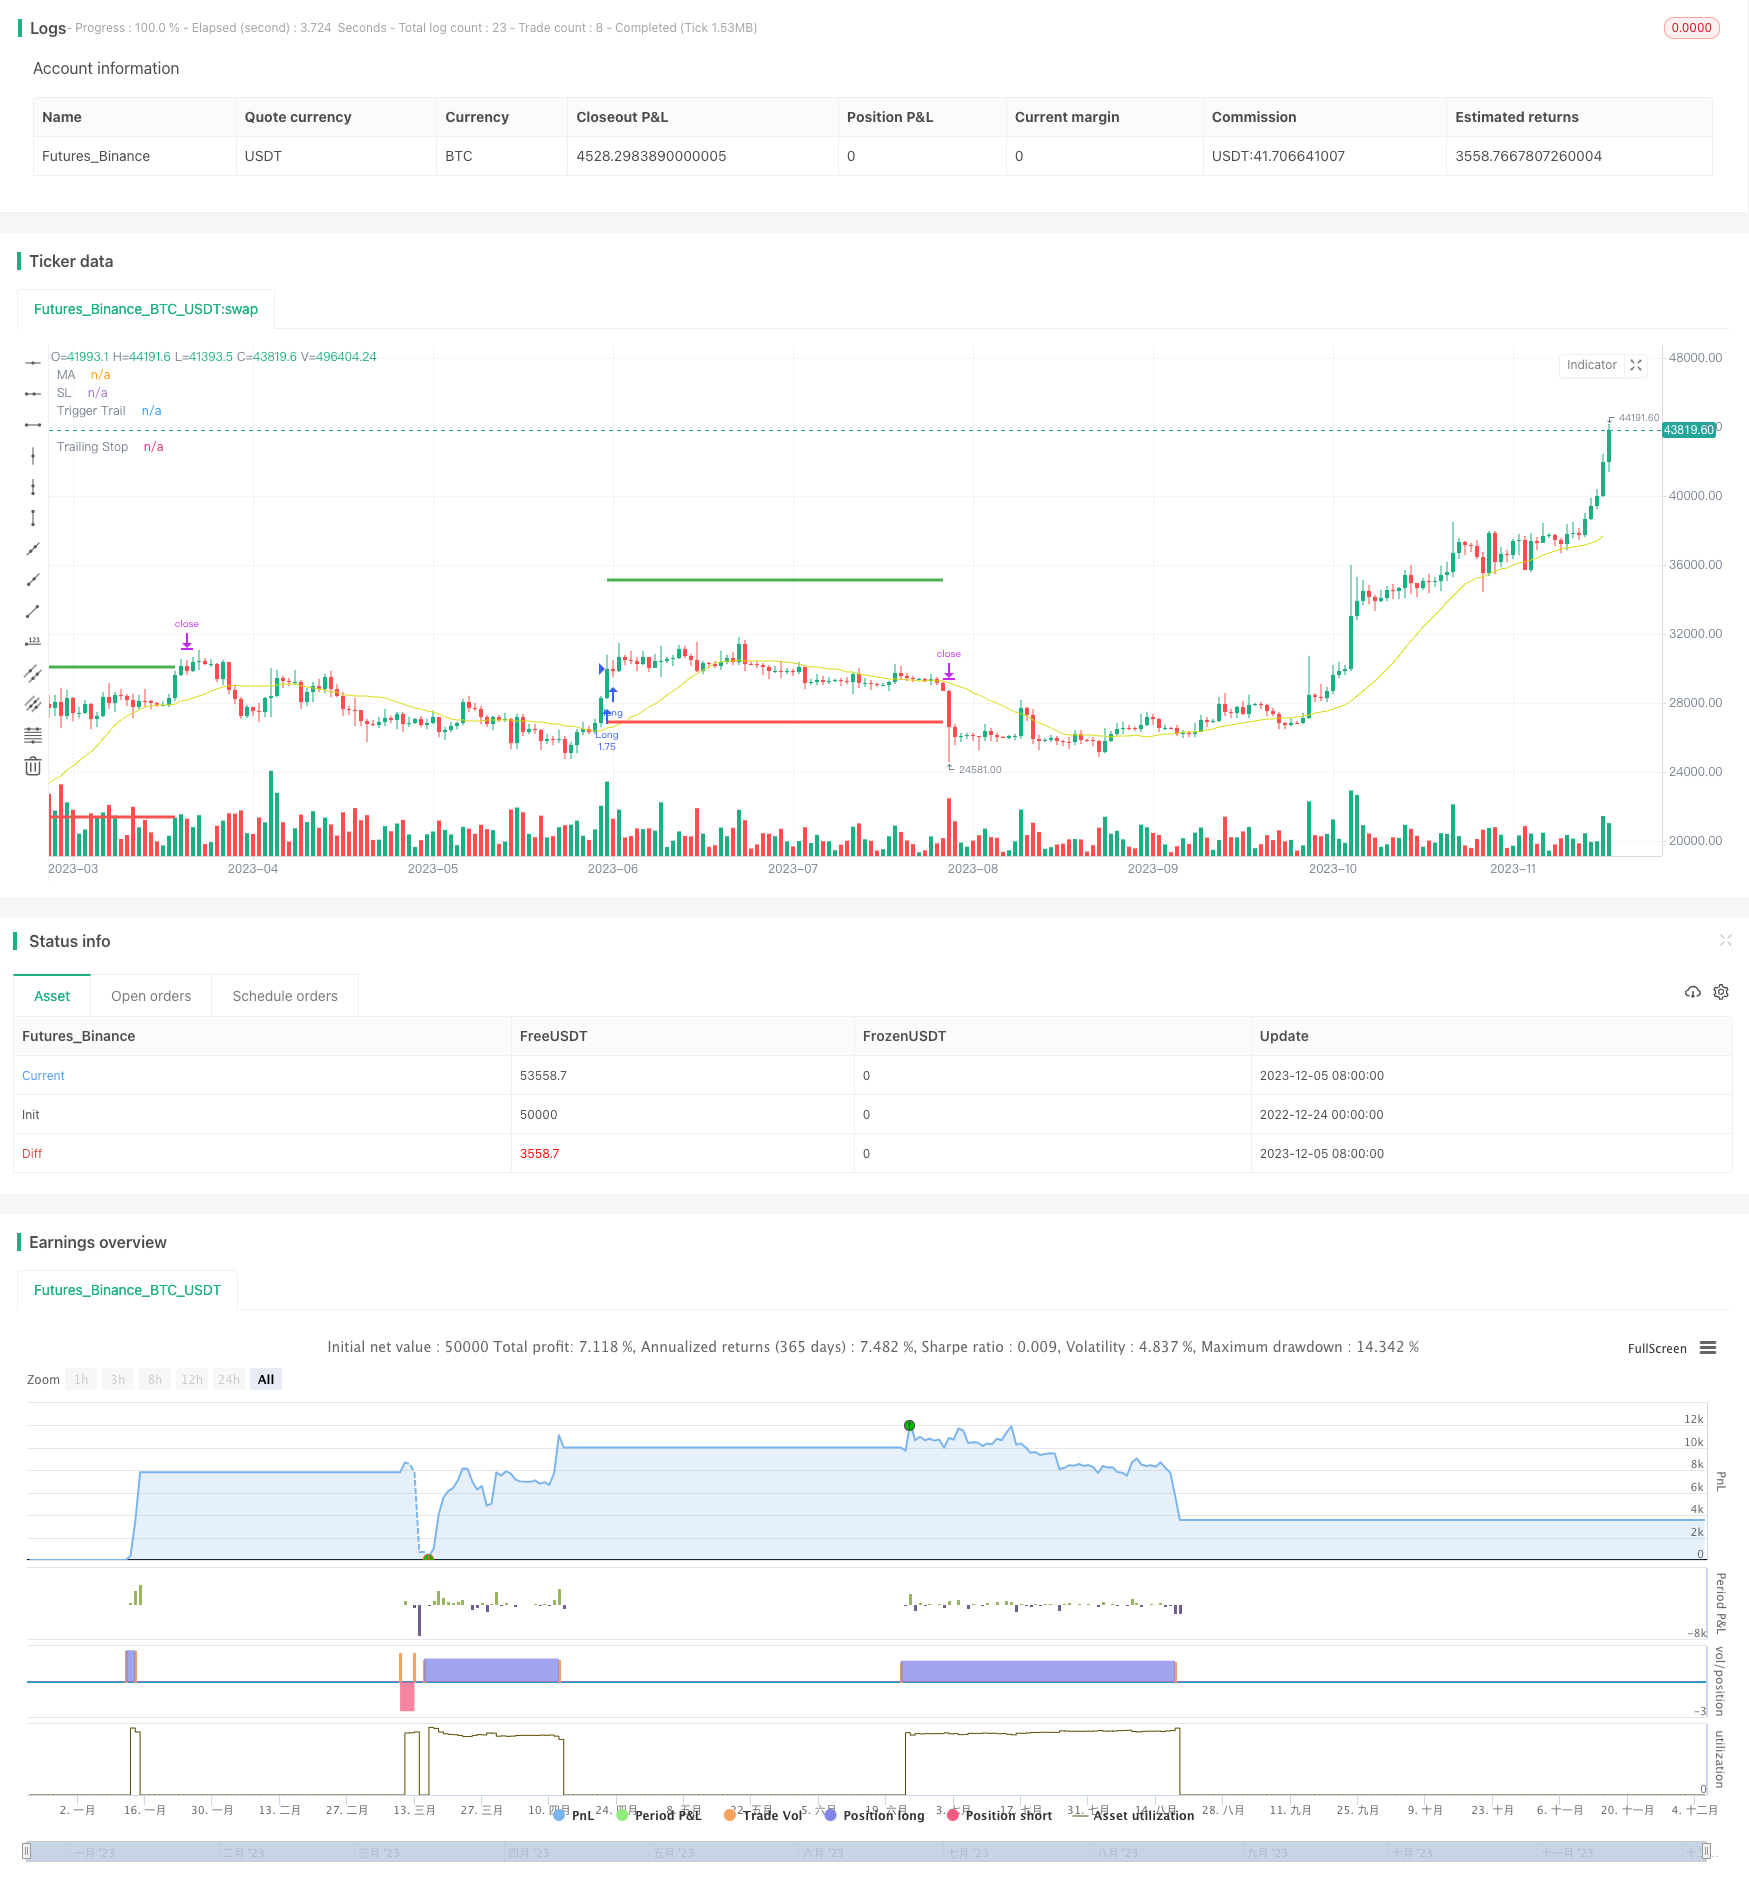
/*backtest
start: 2022-12-24 00:00:00
end: 2023-12-06 05:20:00
period: 1d
basePeriod: 1h
exchanges: [{"eid":"Futures_Binance","currency":"BTC_USDT"}]
*/

// This source code is subject to the terms of the Mozilla Public License 2.0 at https://mozilla.org/MPL/2.0/
// © gsanson66


//This code is based on RSI and a backed weighted MA
//@version=5
strategy("RSI + MA BACKTESTING", overlay=true, initial_capital=1000, default_qty_type=strategy.fixed, commission_type=strategy.commission.percent, commission_value=0.18, slippage=3)


//------------------------TOOL TIPS---------------------------//

t1 = "Choice between a Standard MA (SMA) or a backed-weighted MA (RWMA) which permits to minimize the impact of short term reversal. Default is RWMA."
t2 = "Value of RSI to send a LONG or a SHORT signal. RSI above 60 is a LONG signal and RSI below 40 is a SHORT signal."
t3 = "Rate of Change Value of selected MA to send a LONG or a SHORT signal. By default : ROC MA below -1 is a LONG signal and ROC MA above 1 is a SHORT signal"
t4 = "Threshold value to trigger trailing Take Profit. This threshold is calculated as a multiple of the ATR (Average True Range)."
t5 = "Percentage value of trailing Take Profit. This Trailing TP follows the profit if it increases, remaining selected percentage below it, but stops if the profit decreases."
t6 = "Each gain or losse (relative to the previous reference) in an amount equal to this fixed ratio will change quantity of orders."
t7 = "The amount of money to be added to or subtracted from orders once the fixed ratio has been reached."


//------------------------FUNCTIONS---------------------------//

//@function which calculate a retro weighted moving average to minimize the impact of short term reversal
rwma(source, length) =>
    sum = 0.0
    denominator = 0.0
    weight = 0.0
    weight_x = 100/(4+(length-4)*1.30)
    weight_y = 1.30*weight_x
    for i=0 to length - 1
        if i <= 3
            weight := weight_x
        else
            weight := weight_y
        sum := sum + source[i] * weight
        denominator := denominator + weight
    rwma = sum/denominator

//@function which permits the user to choose a moving average type
ma(source, length, type) =>
    switch type
        "SMA" => ta.sma(source, length)
        "RWMA" => rwma(source, length)

//@function Displays text passed to `txt` when called.
debugLabel(txt, color) =>
    label.new(bar_index, high, text = txt, color=color, style = label.style_label_lower_right, textcolor = color.black, size = size.small)

//@function which looks if the close date of the current bar falls inside the date range
inBacktestPeriod(start, end) => (time >= start) and (time <= end)


//--------------------------------USER INPUTS-------------------------------//

//Technical parameters
rsiLengthInput = input.int(20, minval=1, title="RSI Length", group="RSI Settings")
maTypeInput = input.string("RWMA", title="MA Type", options=["SMA", "RWMA"], group="MA Settings", inline="1", tooltip=t1)
maLenghtInput = input.int(20, minval=1, title="MA Length", group="MA Settings", inline="1")
rsiLongSignalValue = input.int(60, minval=1, maxval=99, title="RSI Long Signal", group="Strategy parameters", inline="3")
rsiShortSignalValue = input.int(40, minval=1, maxval=99, title="RSI Short Signal", group="Strategy parameters", inline="3", tooltip=t2)
rocMovAverLongSignalValue = input.float(-1, maxval=0, title="ROC MA Long Signal", group="Strategy parameters", inline="4")
rocMovAverShortSignalValue = input.float(1, minval=0, title="ROC MA Short Signal", group="Strategy parameters", inline="4", tooltip=t3)
//TP Activation and Trailing TP
takeProfitActivationInput = input.float(5, minval=1.0, title="TP activation in multiple of ATR", group="Strategy parameters", tooltip=t4)
trailingStopInput = input.float(3, minval=0, title="Trailing TP in percentage", group="Strategy parameters", tooltip=t5)
//Money Management
fixedRatio = input.int(defval=400, minval=1, title="Fixed Ratio Value ($)", group="Money Management", tooltip=t6)
increasingOrderAmount = input.int(defval=200, minval=1, title="Increasing Order Amount ($)", group="Money Management", tooltip=t7)
//Backtesting period
startDate = input(title="Start Date", defval=timestamp("1 Jan 2018 00:00:00"), group="Backtesting Period")
endDate = input(title="End Date", defval=timestamp("1 July 2024 00:00:00"), group="Backtesting Period")


//------------------------------VARIABLES INITIALISATION-----------------------------//

float rsi = ta.rsi(close, rsiLengthInput)
float ma = ma(close, maLenghtInput, maTypeInput)
float roc_ma = ((ma/ma[maLenghtInput]) - 1)*100
float atr = ta.atr(20)
var float trailingStopOffset = na
var float trailingStopActivation = na
var float trailingStop = na
var float stopLoss = na
var bool long = na
var bool short = na
var bool bufferTrailingStopDrawing = na
float theoreticalStopPrice = na
bool inRange = na
equity = math.abs(strategy.equity - strategy.openprofit)
strategy.initial_capital = 50000
var float capital_ref = strategy.initial_capital
var float cashOrder = strategy.initial_capital * 0.95


//------------------------------CHECKING SOME CONDITIONS ON EACH SCRIPT EXECUTION-------------------------------//

//Checking if the date belong to the range
inRange := true

//Checking performances of the strategy
if equity > capital_ref + fixedRatio
    spread = (equity - capital_ref)/fixedRatio
    nb_level = int(spread)
    increasingOrder = nb_level * increasingOrderAmount
    cashOrder := cashOrder + increasingOrder
    capital_ref := capital_ref + nb_level*fixedRatio
if equity < capital_ref - fixedRatio
    spread = (capital_ref - equity)/fixedRatio
    nb_level = int(spread)
    decreasingOrder = nb_level * increasingOrderAmount
    cashOrder := cashOrder - decreasingOrder
    capital_ref := capital_ref - nb_level*fixedRatio

//Checking if we close all trades in case where we exit the backtesting period
if strategy.position_size!=0 and not inRange
    debugLabel("END OF BACKTESTING PERIOD : we close the trade", color=color.rgb(116, 116, 116))
    strategy.close_all()
    bufferTrailingStopDrawing := false
    stopLoss := na
    trailingStopActivation := na
    trailingStop := na
    short := false
    long := false


//------------------------------STOP LOSS AND TRAILING STOP ACTIVATION----------------------------//

// We handle the stop loss and trailing stop activation
if (low <= stopLoss or high >= trailingStopActivation) and long
    if high >= trailingStopActivation
        bufferTrailingStopDrawing := true
    else if low <= stopLoss
        long := false
    stopLoss := na
    trailingStopActivation := na
if (low <= trailingStopActivation or high >= stopLoss) and short
    if low <= trailingStopActivation
        bufferTrailingStopDrawing := true
    else if high >= stopLoss
        short := false
    stopLoss := na
    trailingStopActivation := na


//-------------------------------------TRAILING STOP--------------------------------------//

// If the traling stop is activated, we manage its plotting with the bufferTrailingStopDrawing
if bufferTrailingStopDrawing and long
    theoreticalStopPrice := high - trailingStopOffset * syminfo.mintick
    if na(trailingStop)
        trailingStop := theoreticalStopPrice
    else if theoreticalStopPrice > trailingStop
        trailingStop := theoreticalStopPrice
    else if low <= trailingStop
        trailingStop := na
        bufferTrailingStopDrawing := false
        long := false
if bufferTrailingStopDrawing and short
    theoreticalStopPrice := low + trailingStopOffset * syminfo.mintick
    if na(trailingStop)
        trailingStop := theoreticalStopPrice
    else if theoreticalStopPrice < trailingStop
        trailingStop := theoreticalStopPrice
    else if high >= trailingStop
        trailingStop := na
        bufferTrailingStopDrawing := false
        short := false


//---------------------------------LONG CONDITION--------------------------//

if rsi >= 60 and roc_ma <= rocMovAverLongSignalValue and inRange and not long
    if short
        bufferTrailingStopDrawing := false
        stopLoss := na
        trailingStopActivation := na
        trailingStop := na
        short := false
    trailingStopActivation := close + takeProfitActivationInput*atr
    trailingStopOffset := (trailingStopActivation * trailingStopInput/100) / syminfo.mintick
    stopLoss := close - 3*atr
    long := true
    qty = cashOrder/close
    strategy.entry("Long", strategy.long, qty)
    strategy.exit("Exit Long", "Long", stop = stopLoss, trail_price = trailingStopActivation,
                 trail_offset = trailingStopOffset)


//--------------------------------SHORT CONDITION-------------------------------//

if rsi <= 40 and roc_ma >= rocMovAverShortSignalValue and inRange and not short
    if long
        bufferTrailingStopDrawing := false
        stopLoss := na
        trailingStopActivation := na
        trailingStop := na
        long := false
    trailingStopActivation := close - takeProfitActivationInput*atr
    trailingStopOffset := (trailingStopActivation * trailingStopInput/100) / syminfo.mintick
    stopLoss := close + 3*atr
    short := true
    qty = cashOrder/close
    strategy.entry("Short", strategy.short, qty)
    strategy.exit("Exit Short", "Short", stop = stopLoss, trail_price = trailingStopActivation,
                 trail_offset = trailingStopOffset)


//--------------------------------PLOTTING ELEMENT---------------------------------//

// Plotting of element in the graph
plotchar(rsi, "RSI", "", location.top, color.rgb(0, 214, 243))
plot(ma, "MA", color.rgb(219, 219, 18))
plotchar(roc_ma, "ROC MA", "", location.top, color=color.orange)
// Visualizer trailing stop and stop loss movement
plot(stopLoss, "SL", color.red, 3, plot.style_linebr)
plot(trailingStopActivation, "Trigger Trail", color.green, 3, plot.style_linebr)
plot(trailingStop, "Trailing Stop",  color.blue, 3, plot.style_linebr)