Stratégie de suivi de tendance basée sur le croisement de l'indicateur TEMA sur plusieurs périodes de temps
Aperçu
La stratégie est basée sur le croisement de plusieurs périodes de l’indicateur TEMA pour identifier la direction de la tendance du marché, et est combinée avec le croisement de l’indicateur TEMA sur des périodes de temps plus basses pour rechercher des moments d’entrée et de sortie spécifiques. La stratégie peut être configurée pour faire uniquement des transactions en plus, uniquement en négatif ou dans les deux sens.
Principe de stratégie
La stratégie utilise deux indicateurs TEMA, l’un basé sur des lignes rapides et lentes à 5 et 15 cycles, et l’autre basé sur un cadre temporel à haute période personnalisé par l’utilisateur, tel que la ligne solaire ou la ligne circulaire. Le croisement des indicateurs TEMA à haute période détermine la direction de la tendance globale, passant à la hausse et à la baisse lorsque la ligne rapide traverse la ligne lente; le croisement des indicateurs TEMA à basse période est utilisé pour trouver des opportunités d’entrée et de sortie spécifiques.
Lorsque la ligne TEMA à haute période est traversée lentement, la ligne TEMA à basse période est traversée lentement et peut entrer en jeu; lorsque la ligne TEMA à basse période est traversée lentement, elle doit sortir. De même, lorsque la ligne TEMA à haute période est traversée lentement, la ligne TEMA à basse période est traversée lentement et peut entrer en jeu.
Avantages stratégiques
- Le croisement est basé sur les indicateurs de TEMA pour éviter d’être induit en erreur par le bruit
- La définition d’un cadre temporel multiple, combinée à des jugements de haute et basse fréquence, améliore la précision
- Il peut être négocié unilatéralement ou bilatéralement, avec une configuration flexible.
- Des règles claires et faciles à comprendre
Analyse des risques
- L’indicateur TEMA est en retard et risque de manquer le premier moment de la variation des prix
- Les ajustements à court terme dans les jugements de tendance à hautes cycles peuvent entraîner des inversions inutiles.
- La sélection des réglages à haute fréquence peut ne pas refléter les tendances réelles
- La mauvaise sélection du réglage de basse fréquence peut augmenter le risque de stop loss
Comment gérer les risques:
- Adaptation des paramètres TEMA pour un équilibre
- Une marge de freinage appropriée
- Optimiser les paramètres de haute et basse fréquence Setting
- Test de la robustesse des différentes variétés
Direction d’optimisation
- Modifier dynamiquement les paramètres de TEMA pour optimiser la sensibilité des indicateurs
- Augmenter le filtrage des indicateurs de dynamique pour éviter de rater une tendance
- Augmentation de l’indicateur de volatilité et ajustement dynamique de l’amplitude des arrêts
- Paramètres d’optimisation de l’apprentissage automatique
Résumer
Le concept global de la stratégie est clair et compréhensible, la direction de la tendance est jugée sur la base de la croix de plusieurs périodes de l’indicateur TEMA, et la recherche d’une entrée de temps est combinée avec une croix de basse période. Il y a certains avantages, mais il y a aussi de la place pour l’amélioration.
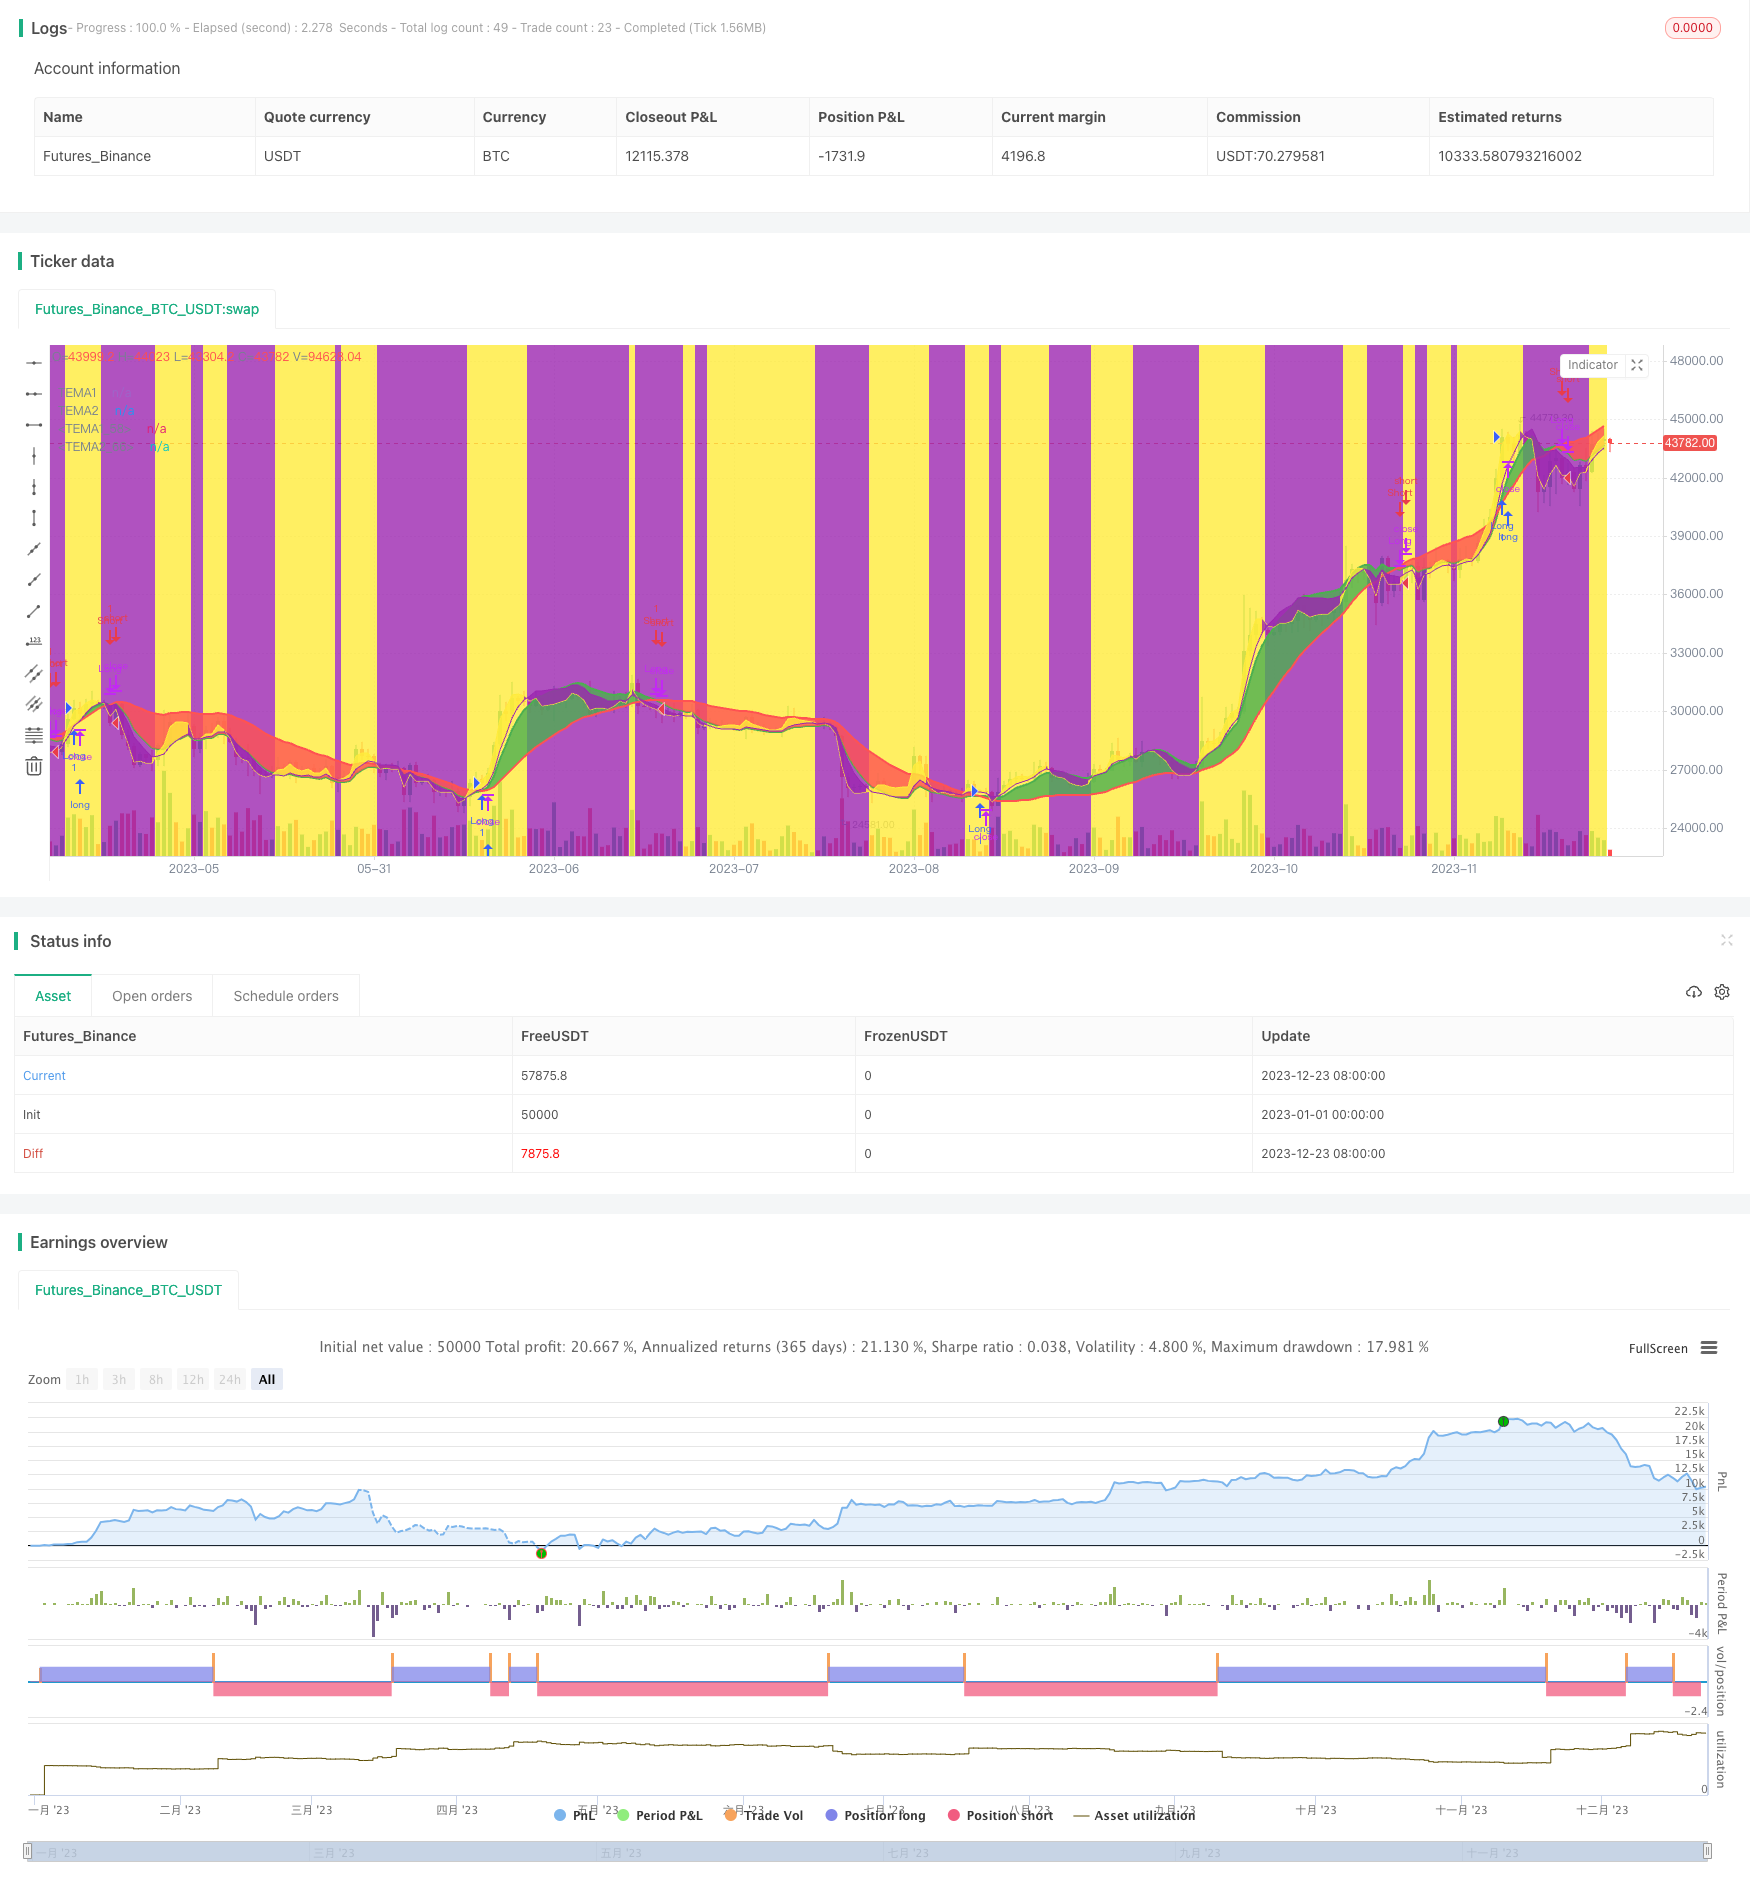
/*backtest
start: 2023-01-01 00:00:00
end: 2023-12-24 00:00:00
period: 1d
basePeriod: 1h
exchanges: [{"eid":"Futures_Binance","currency":"BTC_USDT"}]
*/

// This source code is subject to the terms of the Mozilla Public License 2.0 at https://mozilla.org/MPL/2.0/
// © Seltzer_

//@version=4
strategy(title="TEMA Cross +HTF Backtest", shorttitle="TEMA_X_+HTF_BT", overlay=true)

orderType = input("Longs+Shorts",title="What type of Orders", options=["Longs+Shorts","LongsOnly","ShortsOnly"])
isLong   = (orderType != "ShortsOnly")
isShort  = (orderType != "LongsOnly")

// Backtest Section {

// Backtest inputs
FromMonth = input(defval=1, title="From Month", minval=1, maxval=12)
FromDay = input(defval=1, title="From Day", minval=1, maxval=31)
FromYear = input(defval=2020, title="From Year", minval=2010)
ToMonth = input(defval=1, title="To Month", minval=1, maxval=12)
ToDay = input(defval=1, title="To Day", minval=1, maxval=31)
ToYear = input(defval=9999, title="To Year", minval=2017)

// Define backtest timewindow
start = timestamp(FromYear, FromMonth, FromDay, 00, 00)  // backtest start window
finish = timestamp(ToYear, ToMonth, ToDay, 23, 59)  // backtest finish window
window() => true

// }

//TEMA Section {

//LTF Section
xLength = input(20, minval=1, title="Fast Length")
xPrice = close
xEMA1 = ema(xPrice, xLength)
xEMA2 = ema(xEMA1, xLength)
xEMA3 = ema(xEMA2, xLength)
xnRes = (3 * xEMA1) - (3 * xEMA2) + xEMA3
xnResP = plot(xnRes, color=color.green, linewidth=2, title="TEMA1")

yLength = input(60, minval=1, title="Slow Length")
yPrice = close
yEMA1 = ema(yPrice, yLength)
yEMA2 = ema(yEMA1, yLength)
yEMA3 = ema(yEMA2, yLength)
ynRes = (3 * yEMA1) - (3 * yEMA2) + yEMA3
ynResP = plot(ynRes, color=color.red, linewidth=2, title="TEMA2")

fill(xnResP, ynResP, color=xnRes > ynRes ? color.green : color.red, transp=65, editable=true)

//HTF Section
HTFres = input(defval="D", type=input.resolution, title="HTF Resolution")

HTFxLength = input(5, minval=1, title="HTF Fast Length")
HTFxPrice = close
HTFxEMA1 = security(syminfo.tickerid, HTFres, ema(HTFxPrice, HTFxLength), barmerge.gaps_off, barmerge.lookahead_on)
HTFxEMA2 = security(syminfo.tickerid, HTFres, ema(HTFxEMA1, HTFxLength), barmerge.gaps_off, barmerge.lookahead_on)
HTFxEMA3 = security(syminfo.tickerid, HTFres, ema(HTFxEMA2, HTFxLength), barmerge.gaps_off, barmerge.lookahead_on)
HTFxnRes = (3 * HTFxEMA1) - (3 * HTFxEMA2) + HTFxEMA3
HTFxnResP = plot(HTFxnRes, color=color.yellow, linewidth=1,transp=30, title="TEMA1")

HTFyLength = input(15, minval=1, title="HTF Slow Length")
HTFyPrice = close
HTFyEMA1 = security(syminfo.tickerid, HTFres, ema(HTFyPrice, HTFyLength), barmerge.gaps_off, barmerge.lookahead_on)
HTFyEMA2 = security(syminfo.tickerid, HTFres, ema(HTFyEMA1, HTFyLength), barmerge.gaps_off, barmerge.lookahead_on)
HTFyEMA3 = security(syminfo.tickerid, HTFres, ema(HTFyEMA2, HTFyLength), barmerge.gaps_off, barmerge.lookahead_on)
HTFynRes = (3 * HTFyEMA1) - (3 * HTFyEMA2) + HTFyEMA3
HTFynResP = plot(HTFynRes, color=color.purple, linewidth=1, transp=30, title="TEMA2")

fill(HTFxnResP, HTFynResP, color=HTFxnRes > HTFynRes ? color.yellow : color.purple, transp=90, editable=true)
bgcolor(HTFxnRes > HTFynRes ? color.yellow : na, transp=90, editable=true)
bgcolor(HTFxnRes < HTFynRes ? color.purple : na, transp=90, editable=true)

// }

// Buy and Sell Triggers
LongEntryAlert = xnRes > ynRes and HTFxnRes > HTFynRes and window()
LongCloseAlert = xnRes < ynRes and window()
ShortEntryAlert = xnRes < ynRes and HTFxnRes < HTFynRes and window()
ShortCloseAlert = xnRes > ynRes

// Entry & Exit signals
if isLong
    strategy.entry("Long", strategy.long, when = LongEntryAlert)
    strategy.close("Long", when = LongCloseAlert)

if isShort
    strategy.entry("Short", strategy.short, when = ShortEntryAlert)
    strategy.close("Short", when = ShortCloseAlert)