Stratégie à deux lignes RSI du canal de la bande de Bollinger
Aperçu
Cette stratégie combine la ligne de Brin avec un indicateur relativement faible (RSI) et nécessite une rupture correspondante de la ligne de Brin, ce qui rend le signal de négociation de la stratégie plus rigoureux et plus fiable.
Principe de stratégie
- Utilisez la ligne de Brin pour calculer la ligne moyenne, la ligne supérieure et la ligne inférieure en fonction du prix de clôture des n jours précédents.
- Calculer l’indicateur RSI pour déterminer si le marché est trop optimiste ou trop pessimiste.
- Il est préférable d’effectuer une position en position courte que si l’indicateur RSI indique une survente (au-dessus du paramètre rsi_overbought) et que le prix franchit la ligne de Brin.
- Il n’est possible de faire des transactions à plusieurs têtes que lorsque le RSI indique une survente (inférieure au paramètre rsi_oversold) et que le prix a franchi la ligne de sous-traitance de Brin.
Ainsi, cette stratégie exploite à la fois les caractéristiques de la chaîne de Brin et les signaux de survente et de survente de l’indicateur RSI, évitant ainsi les erreurs de jugement d’un seul indicateur, et est plus fiable.
Avantages stratégiques
- L’utilisation de l’indicateur RSI et de la ligne de Brin a pour effet de rendre le jugement plus strict et d’éviter les erreurs.
- Les lignes de Brin constituent un canal dynamique permettant de saisir les lois de la fluctuation du marché.
- Le RSI détermine la survente et évite les hausses et les baisses.
Risque stratégique
- Si les paramètres de la ligne de broyage sont mal définis, la trajectoire ascendante et descendante ne peut pas couvrir efficacement le prix.
- Si les paramètres RSI sont mal définis, il est impossible de juger efficacement si une situation de survente est réelle.
- Les stratégies ne peuvent pas déterminer la direction des tendances par elles-mêmes, elles doivent être combinées avec d’autres indicateurs.
Les paramètres doivent être optimisés pour ces risques, les modèles doivent être rigoureusement testés et les grandes tendances doivent être évaluées à l’aide d’autres indicateurs.
Orientation de l’optimisation de la stratégie
- Testez les lignes de Brill pour différents paramètres de périodicité et trouvez le paramètre de périodicité optimal.
- Tester les différents paramètres de l’indicateur RSI pour déterminer les meilleurs.
- D’autres indicateurs, tels que la moyenne mobile, peuvent être ajoutés pour juger de la tendance générale.
Résumer
Cette stratégie a réussi à combiner les avantages de la ligne de Brin et de l’indicateur RSI, en émettant des instructions de négociation lorsque les deux signaux apparaissent simultanément, ce qui permet d’éviter efficacement l’erreur de jugement d’un seul indicateur, ce qui rend la négociation plus fiable. En même temps, il faut également optimiser les paramètres, tester rigoureusement et juger les grandes tendances avec d’autres indicateurs, ce qui améliore encore la stabilité et le rendement de la stratégie.
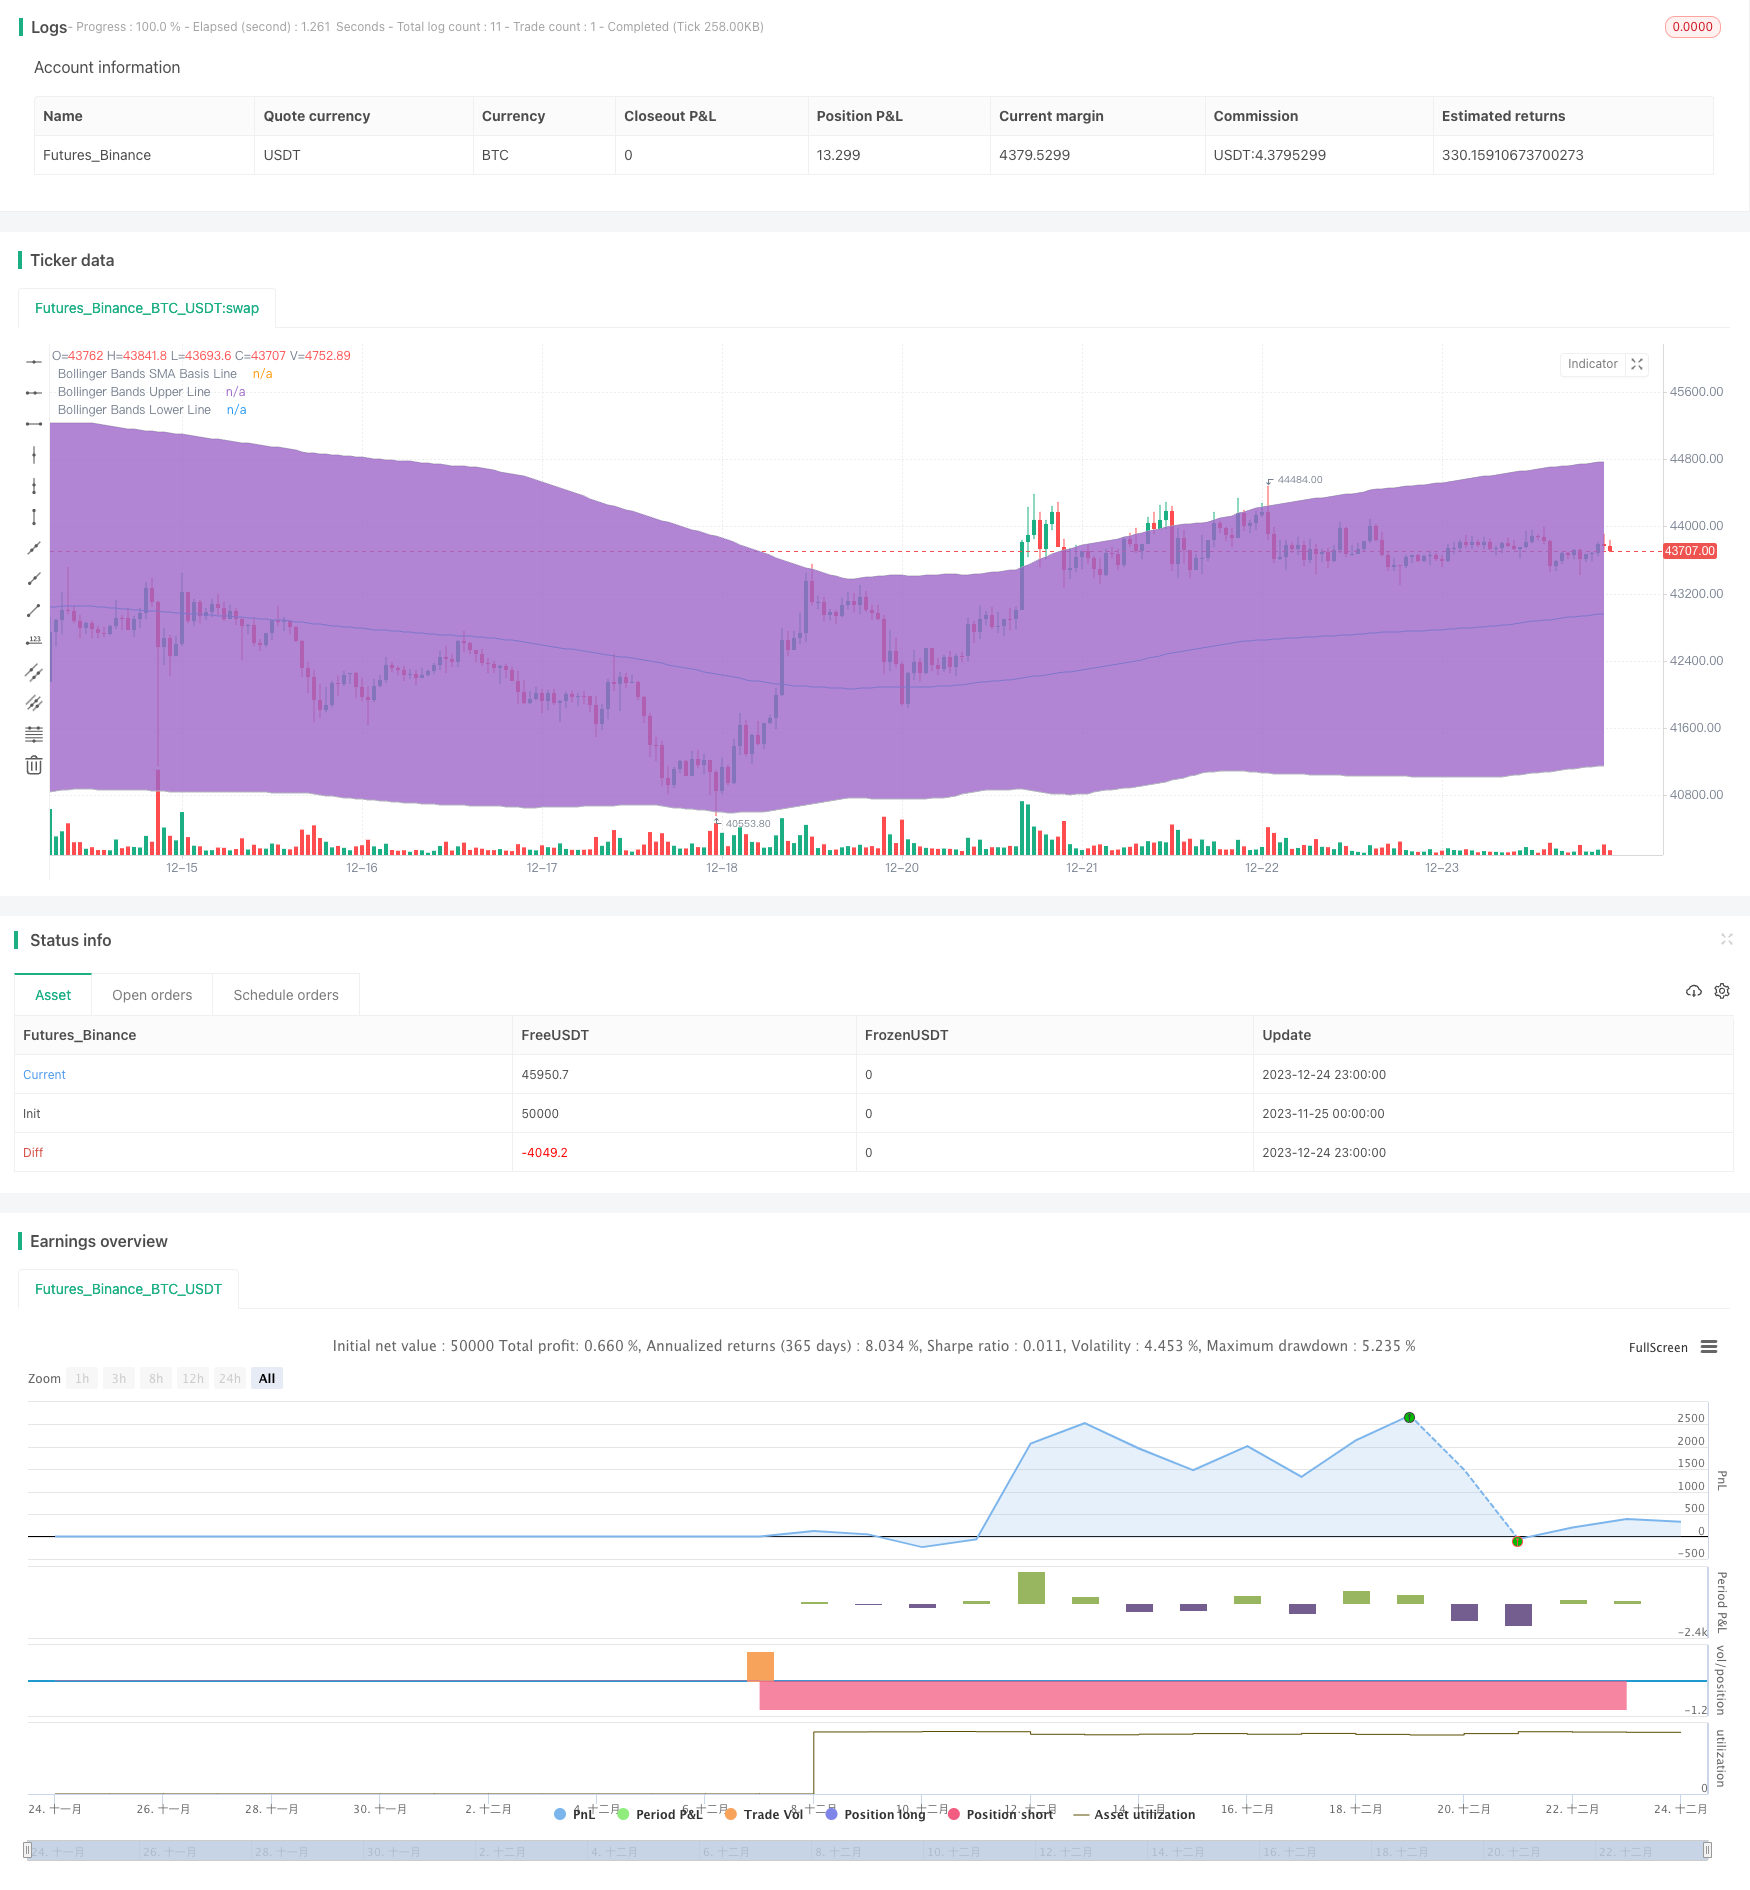
/*backtest
start: 2023-11-25 00:00:00
end: 2023-12-25 00:00:00
period: 1h
basePeriod: 15m
exchanges: [{"eid":"Futures_Binance","currency":"BTC_USDT"}]
*/

//@version=2
strategy("Bollinger + RSI, Double Strategy (by ChartArt) v1.1", shorttitle="CA_-_RSI_Bol_Strat_1.1", overlay=true)

// ChartArt's RSI + Bollinger Bands, Double Strategy - Update
//
// Version 1.1
// Idea by ChartArt on January 18, 2015.
//
// This strategy uses the RSI indicator
// together with the Bollinger Bands
// to sell when the price is above the
// upper Bollinger Band (and to buy when
// this value is below the lower band).
//
// This simple strategy only triggers when
// both the RSI and the Bollinger Bands
// indicators are at the same time in
// a overbought or oversold condition.
//
// In this version 1.1 the strategy was
// both simplified for the user and
// made more successful in backtesting.
//
// List of my work:
// https://www.tradingview.com/u/ChartArt/
//
//  __             __  ___       __  ___
// /  ` |__|  /\  |__)  |   /\  |__)  |
// \__, |  | /~~\ |  \  |  /~~\ |  \  |
//
//


///////////// RSI
RSIlength = input(6,title="RSI Period Length")
RSIoverSold = 50
RSIoverBought = 50
price = close
vrsi = rsi(price, RSIlength)


///////////// Bollinger Bands
BBlength = input(200, minval=1,title="Bollinger Period Length")
BBmult = 2 // input(2.0, minval=0.001, maxval=50,title="Bollinger Bands Standard Deviation")
BBbasis = sma(price, BBlength)
BBdev = BBmult * stdev(price, BBlength)
BBupper = BBbasis + BBdev
BBlower = BBbasis - BBdev
source = close
buyEntry = crossover(source, BBlower)
sellEntry = crossunder(source, BBupper)
plot(BBbasis, color=aqua,title="Bollinger Bands SMA Basis Line")
p1 = plot(BBupper, color=silver,title="Bollinger Bands Upper Line")
p2 = plot(BBlower, color=silver,title="Bollinger Bands Lower Line")
fill(p1, p2)


///////////// Colors
switch1=input(true, title="Enable Bar Color?")
switch2=input(true, title="Enable Background Color?")
TrendColor = RSIoverBought and (price[1] > BBupper and price < BBupper) and BBbasis < BBbasis[1] ? red : RSIoverSold and (price[1] < BBlower and price > BBlower) and BBbasis > BBbasis[1] ? green : na
barcolor(switch1?TrendColor:na)
bgcolor(switch2?TrendColor:na,transp=50)


///////////// RSI + Bollinger Bands Strategy
if (not na(vrsi))

    if (crossover(vrsi, RSIoverSold) and crossover(source, BBlower))
        strategy.entry("RSI_BB_L", strategy.long, stop=BBlower,  comment="RSI_BB_L")
    else
        strategy.cancel(id="RSI_BB_L")

    if (crossunder(vrsi, RSIoverBought) and crossunder(source, BBupper))
        strategy.entry("RSI_BB_S", strategy.short, stop=BBupper,  comment="RSI_BB_S")
    else
        strategy.cancel(id="RSI_BB_S")

//plot(strategy.equity, title="equity", color=red, linewidth=2, style=areabr)