Stratégie de suivi des tendances d'Ichimoku Kinko Hyo
Aperçu
La stratégie d’équilibre à vue est une stratégie de suivi de tendance qui permet de déterminer la direction de la tendance en calculant la moyenne et en combinant l’indicateur Ichimoku Kinko Hyo pour réaliser des transactions de suivi de tendance à faible risque.
Principe de stratégie
La stratégie est basée sur l’indicateur Ichimoku Kinko Hyo pour déterminer la direction de la tendance. L’Ichimoku Kinko Hyo, également appelé tableau d’équilibre de la première vue, est composé de la ligne de conversion ((Tenkan-sen), de la ligne de référence ((Kijun-sen), de la ligne de tête ((Senkou Span A) et de la ligne de confirmation ((Senkou Span B), formant une zone d’équilibre entre l’avant et l’arrière, appelée zone de nuage de craie.
Cette stratégie combine la relation entre le prix et la ligne moyenne pour déterminer la direction de la tendance. Elle génère un signal d’achat lorsque le prix est au-dessus de la ligne de référence et de la ligne de conversion; Elle génère un signal de vente lorsque le prix est en dessous de la bande de nuages.
Analyse des avantages
- L’indicateur Ichimoku Kinko Hyo est utilisé pour évaluer les tendances et éviter d’être trompé par les fausses percées des marchés en crise.
- Les paramètres de la ligne moyenne sont réglables et optimisés pour différents cycles
- Le jugement de la relation homogène permet de localiser efficacement la direction de la tendance
- Le Cloud Banding permet de suivre les tendances et de réaliser des transactions à faible risque
Analyse des risques
- Les tremblements de terre sont sujets à de faux signaux.
- Une mauvaise configuration des paramètres peut entraîner des signaux de transaction trop fréquents ou inopportuns.
- Il est nécessaire de déterminer manuellement la direction de la tendance et d’ajuster les paramètres.
Direction d’optimisation
Cette stratégie peut être optimisée dans les domaines suivants:
- Optimisation des paramètres Ichimoku pour plus de cycles de temps
- Augmenter les stratégies de stop-loss et contrôler les pertes individuelles
- Combiner les indicateurs pour juger de la force ou de la faiblesse de la tendance et éviter d’être trompé par les événements choquants
- Augmentation des conditions d’ouverture des positions afin d’éviter les situations extrêmes
Résumer
Dans l’ensemble, la stratégie d’équilibrage au premier coup d’œil permet de déterminer la direction de la tendance à l’aide de l’indicateur Ichimoku Kinko Hyo, de localiser efficacement la tendance et de générer des signaux de négociation avec la détermination de la relation de l’équilibre, permettant des transactions de suivi de la tendance à faible risque. La stratégie peut être ajustée et optimisée par paramètres pour s’adapter à différents environnements de marché et mérite d’être étudiée et utilisée par les investisseurs.
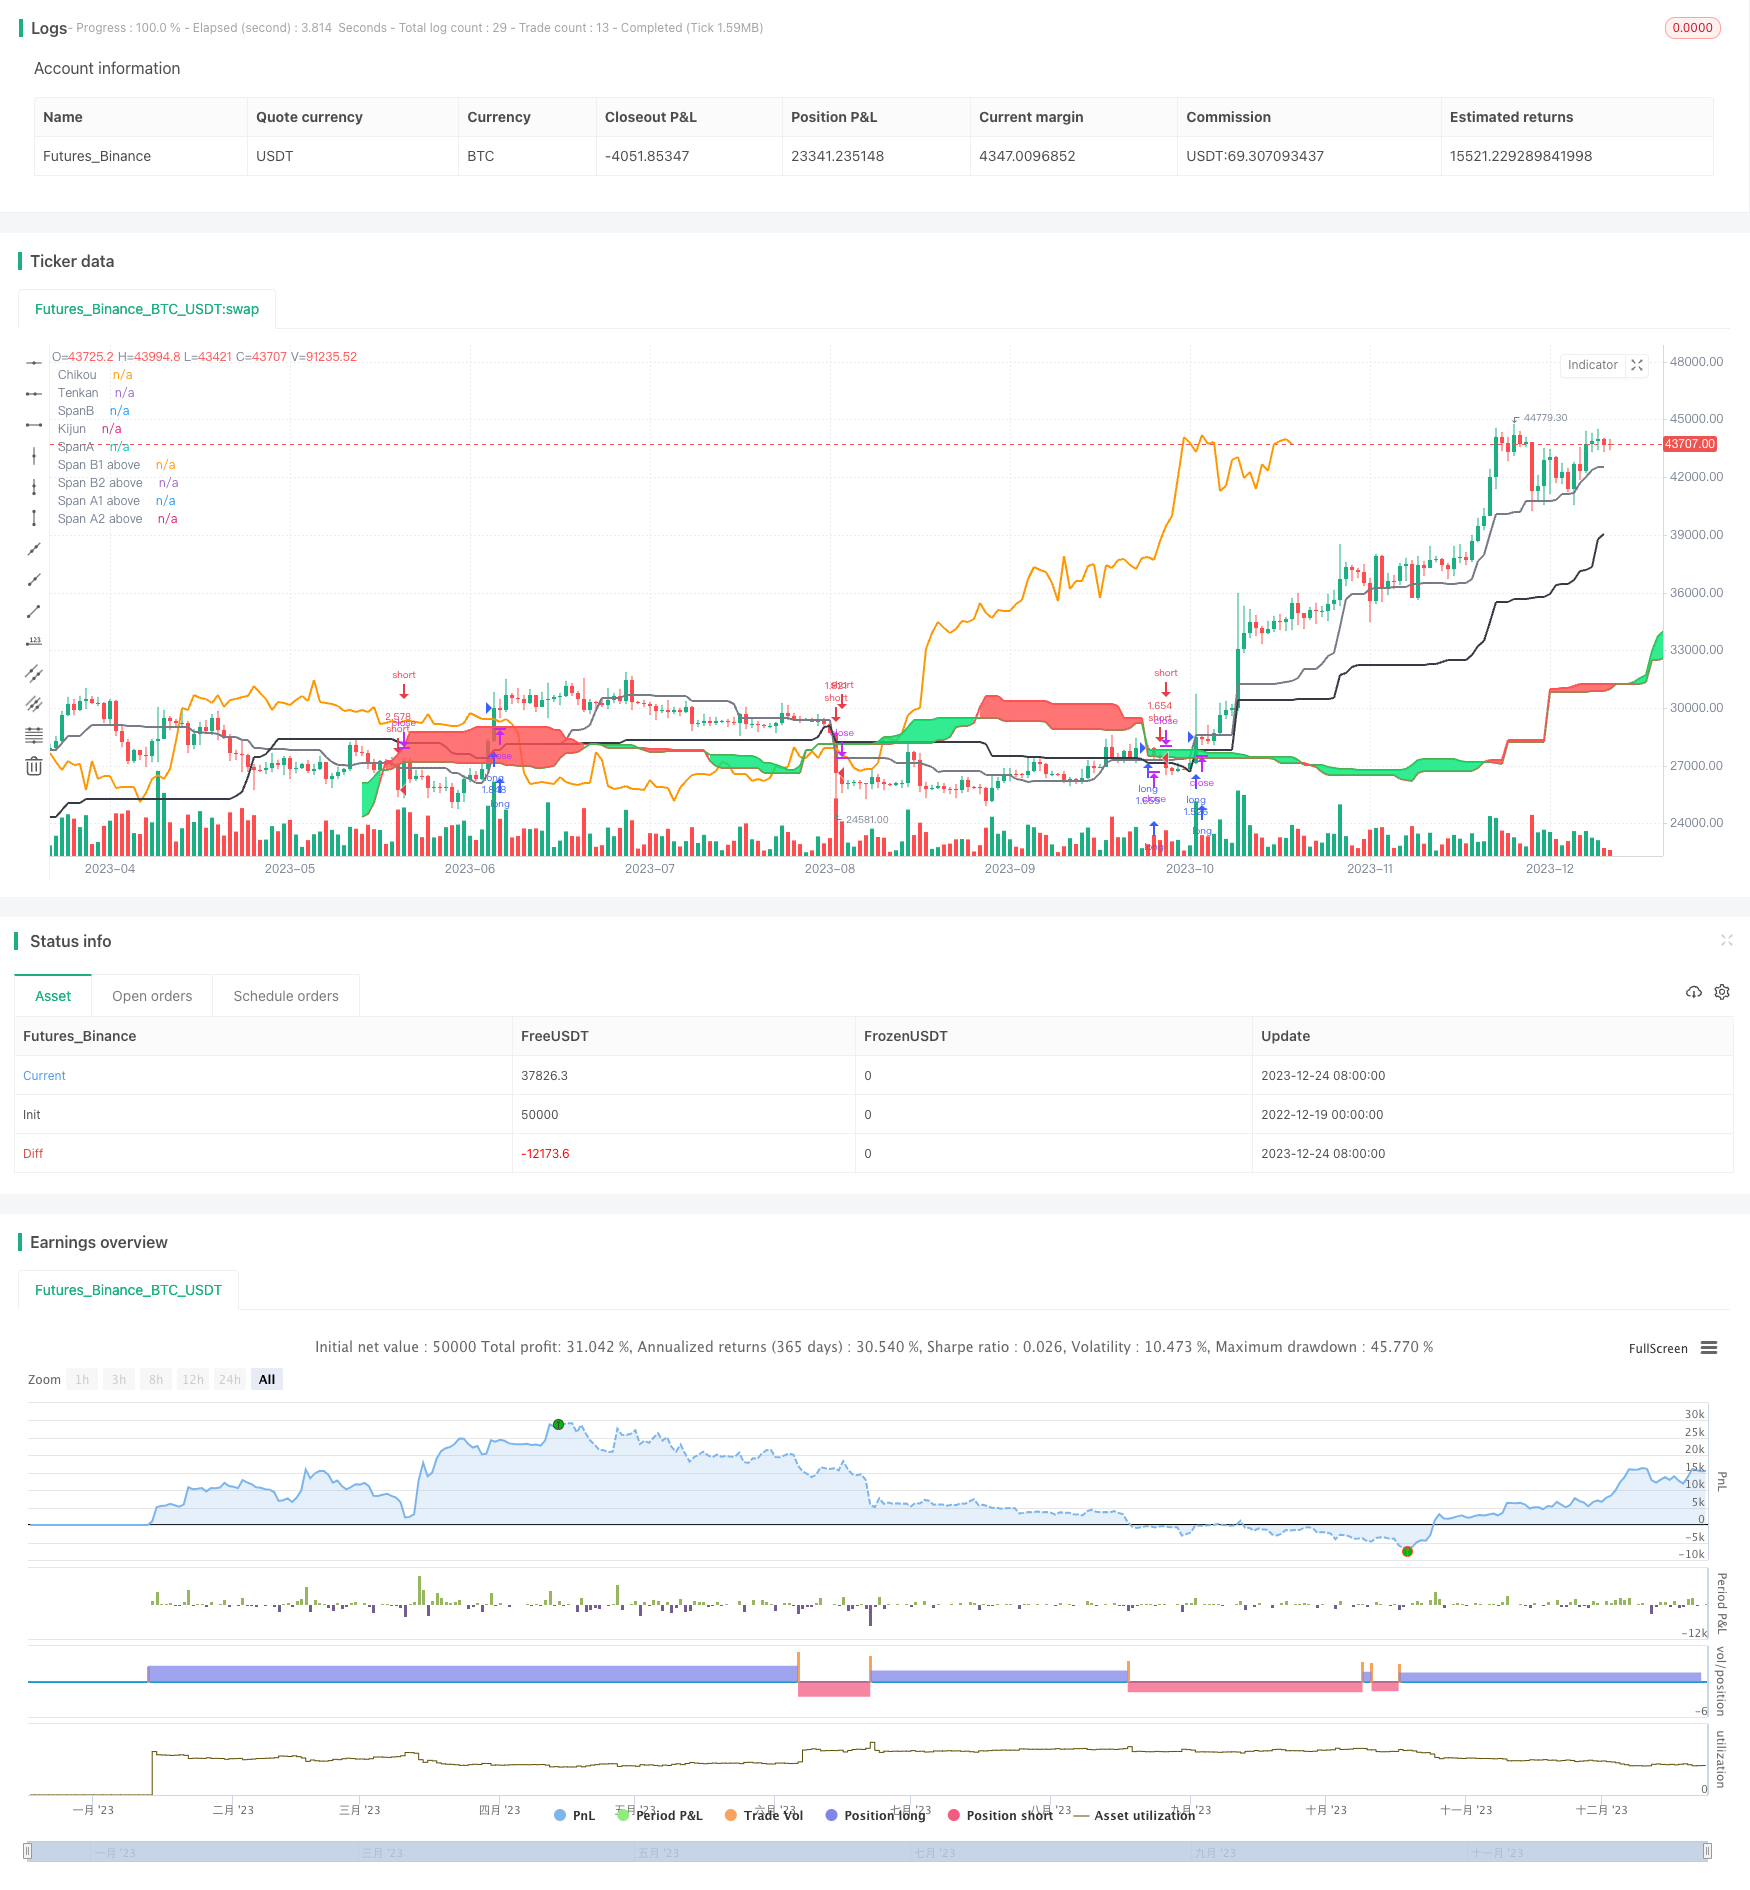
/*backtest
start: 2022-12-19 00:00:00
end: 2023-12-25 00:00:00
period: 1d
basePeriod: 1h
exchanges: [{"eid":"Futures_Binance","currency":"BTC_USDT"}]
*/

//@version=3
// Credit for the initial code to nathanhoffer - I simply added the ability to select a time period
//
strategy("Cloud Breakout", overlay=true, initial_capital=10000, default_qty_type=strategy.percent_of_equity, default_qty_value=100, commission_type=strategy.commission.percent, commission_value=0.0)

/////////////// Component Code Start ///////////////
testStartYear = input(2016, "Backtest Start Year")
testStartMonth = input(1, "Backtest Start Month")
testStartDay = input(1, "Backtest Start Day")
testPeriodStart = timestamp(testStartYear,testStartMonth,testStartDay, 0, 0)

testStopYear = input(2019, "Backtest Stop Year")
testStopMonth = input(12, "Backtest Stop Month")
testStopDay = input(31, "Backtest Stop Day")
testPeriodStop = timestamp(testStopYear,testStopMonth,testStopDay, 0, 0)

testPeriod() => true

Ten = input(18, minval=1, title="Tenkan")
Kij = input(60, minval=1, title="Kijun")
LeadSpan = input(30, minval=1, title="Senkou B")
Displace = input(52, minval=1, title="Senkou A")
SpanOffset = input(52, minval=1, title="Span Offset")

sts = input(true, title="Show Tenkan")
sks = input(true, title="Show Kijun")
ssa = input(true, title="Show Span A")
ssb = input(true, title="Show Span B")
sc = input(true, title="Show Chikou")

source = close

//Script for Ichimoku Indicator
donchian(len) => avg(lowest(len), highest(len))
TS = donchian(Ten)
KS = donchian(Kij)
SpanA = avg(TS, KS)
SpanB = donchian(LeadSpan)

CloudTop = max(TS, KS)

Chikou = source[Displace]
SpanAA = avg(TS, KS)[SpanOffset]
SpanBB = donchian(LeadSpan)[SpanOffset]

//Kumo Breakout (Long)
SpanA_Top = SpanAA >= SpanBB ? 1 : 0
SpanB_Top = SpanBB >= SpanAA ? 1 : 0

SpanA_Top2 = SpanA >= SpanB ? 1 : 0
SpanB_Top2 = SpanB >= SpanA ? 1 : 0

SpanA1 = SpanA_Top2 ? SpanA : na
SpanA2 = SpanA_Top2 ? SpanB : na

SpanB1 = SpanB_Top2 ? SpanA : na
SpanB2 = SpanB_Top2 ? SpanB : na

//plot for Tenkan and Kijun (Current Timeframe)
p1= plot(sts and TS ? TS : na, title="Tenkan", linewidth = 2, color = gray)
p2 = plot(sks and KS ? KS : na, title="Kijun", linewidth = 2, color = black)
//p5 = plot(sc and KS ? KS : na, title="Chikou", linewidth = 2, color = orange)
p5 = plot(sc and Displace ? close: na, title="Chikou", linewidth = 2, offset=-Displace, color = orange)

//Plot for Kumo Cloud (Dynamic Color)
p3 = plot(ssa and SpanA ? SpanA : na, title="SpanA", linewidth=2, offset=Displace, color=green)
p4 = plot(ssb and SpanB ? SpanB : na, title="SpanB", linewidth=2, offset=Displace, color=red)

p8 = plot(ssa and SpanA1 ? SpanA1 : na, title="Span A1 above", style=linebr, linewidth=1, offset=Displace, color=green)
p9 = plot(ssa and SpanA2 ? SpanA2 : na, title="Span A2 above", style=linebr, linewidth=1, offset=Displace, color=green)
p10 = plot(ssb and SpanB1 ? SpanB1 : na, title="Span B1 above", style=linebr, linewidth=1, offset=Displace, color=red)
p11 = plot(ssb and SpanB2 ? SpanB2 : na, title="Span B2 above", style=linebr, linewidth=1, offset=Displace, color=red)

fill(p8, p9, color = lime, transp=70, title="Kumo Cloud Up")
fill (p10, p11, color=red, transp=70, title="Kumo Cloud Down")

LongSpan = (SpanA_Top and source[1] < SpanAA[1] and source > SpanAA) or (SpanB_Top and source[1] < SpanBB[1] and source > SpanBB) ? 1 : 0
cupSpan = LongSpan  == 1 ? LongSpan : 0

Long_Breakout = (SpanA_Top ==1 and crossover(source, SpanAA)) or (SpanB_Top ==1 and crossover(source, SpanBB))

ShortSpan = (SpanB_Top and source[1] > SpanAA[1] and source < SpanAA) or (SpanA_Top and source[1] > SpanBB[1] and source < SpanBB) ? 1 : 0
cdnSpan = ShortSpan == 1 ? ShortSpan : 0

Short_Breakout = (SpanA_Top ==1 and crossunder(source, SpanBB)) or (SpanB_Top ==1 and crossunder(source, SpanAA))

//Kumo Twist
Kumo_Twist_Long = SpanA[1] < SpanB[1] and SpanA > SpanB ? 1 : 0
Kumo_Twist_Short = SpanA[1] > SpanB[1] and SpanA < SpanB ? 1 : 0

cupD = Kumo_Twist_Long == 1 ? Kumo_Twist_Long : 0
cdnD = Kumo_Twist_Short == 1 ? Kumo_Twist_Short : 0

Chikou_Above = close > Chikou
Chikou_Below = close < Chikou

long = (cross(TS, SpanA) or cross(TS, SpanB)) and TS>SpanA and TS>SpanB and TS>=KS
short = cross(TS, KS) and KS >= TS

if testPeriod()
    strategy.entry("long", strategy.long, when=Long_Breakout)
    strategy.entry("short", strategy.short, when=Short_Breakout)