Stratégie de ratio de moyenne mobile de chaîne filtrée à double tendance
Aperçu
Cette stratégie est basée sur une stratégie de suivi de la tendance basée sur un double indicateur de ratio de moyenne mobile, combiné à un filtre à bulle et à un double indicateur de filtrage de la tendance, et utilisant un mécanisme de sortie en chaîne. La stratégie vise à utiliser l’indicateur de ratio de moyenne mobile pour identifier la direction de la tendance de la ligne moyenne longue, choisir le meilleur point d’entrée lorsque la direction de la tendance est claire, et mettre en place un stop loss et un stop loss exit mécanisme pour verrouiller les bénéfices et réduire les pertes.
Principe de stratégie
- Calculer les moyennes mobiles rapides (lignes de 10 jours) et les moyennes mobiles lentes (lignes de 50 jours) et calculer leur ratio, appelé le ratio des moyennes mobiles de prix. Ce ratio permet d’identifier efficacement les variations de la tendance de la ligne longue dans les prix.
- Convertissez le ratio de la moyenne mobile des prix en un pourcentage, c’est-à-dire la force relative du ratio actuel au cours de la période précédente. Ce pourcentage est défini comme un oscillateur.
- Lorsque l’oscillateur dépasse le seuil d’achat défini (< 10), il génère un signal d’achat, et lorsque le seuil de vente dépasse (< 90), il génère un signal de vente, pour suivre la tendance.
- Le filtrage des signaux de transaction est effectué en combinaison avec l’indicateur de la bande passante de Brin, et l’opération est effectuée lorsque la bande passante de Brin se rétrécit.
- L’indicateur de double filtrage de tendance produit un signal d’achat uniquement lorsque le prix est dans un canal de tendance haussière et un signal de vente uniquement lorsque le prix est dans un canal de tendance baissière, évitant ainsi les opérations de revers.
- La configuration d’un mécanisme de sortie en chaîne, comprenant un arrêt, un arrêt de perte et une sortie combinée, permet de pré-configurer plusieurs conditions de sortie, en donnant la priorité à la sortie la plus rentable.
Avantages stratégiques
- Un double mécanisme de filtrage des tendances permet de déterminer de manière fiable la direction des tendances dominantes et d’éviter les opérations de contre-courant.
- L’indicateur de ratio des moyennes mobiles est plus efficace que la moyenne mobile unique pour déterminer les changements de tendance.
- L’indicateur de la bande passante de Brin est efficace pour repérer les périodes de faible volatilité du marché, où les signaux de transaction sont plus fiables.
- Le mécanisme de sortie en chaîne permet de stabiliser les bénéfices et de maximiser l’ensemble des bénéfices.
Les risques et les solutions
- La solution consiste à combiner le filtrage de la bande passante de Brin avec le filtrage de la bande passante de Brin et le filtrage de la bande passante de Brin.
- Lorsqu’il y a un renversement de tendance évident, les moyennes mobiles sont en retard et ne peuvent pas être détectées au premier coup d’œil. La solution consiste à raccourcir de manière appropriée les paramètres de cycle des moyennes mobiles.
- Dans le cas d’une faille de saut en vol, le point d’arrêt peut être frappé instantanément, ce qui entraîne de lourdes pertes. La solution est de relâcher le paramètre de l’arrêt de manière appropriée.
Orientation de l’optimisation de la stratégie
- Optimisation des paramètres. Les cycles des moyennes mobiles, les points d’achat et de vente des oscillateurs, les paramètres des bandes de Brin et les paramètres de filtrage des tendances peuvent être testés à la main pour trouver la combinaison optimale de paramètres.
- L’intégration d’autres indicateurs. Il est possible d’envisager d’ajouter d’autres indicateurs de réversion de tendance, tels que l’indicateur KD, l’indicateur MACD, etc., pour améliorer la précision de la stratégie.
- L’apprentissage automatique permet de collecter des données historiques, d’utiliser des modèles d’apprentissage automatique pour la formation des algorithmes, d’optimiser dynamiquement les paramètres et d’adapter les paramètres.
Résumer
Cette stratégie utilise une combinaison d’indicateurs de ratio de doubles moyennes mobiles et d’indicateurs de courbe de Bryn pour déterminer la direction de la tendance de la ligne moyenne longue, pour trouver le meilleur point d’entrée après la confirmation de la tendance, et pour configurer un mécanisme de sortie en chaîne pour bloquer les bénéfices. La fiabilité est élevée et l’efficacité est évidente. La stratégie peut être améliorée et améliorée par l’optimisation des paramètres, l’ajout d’autres indicateurs de jugement auxiliaires et l’apprentissage automatique.
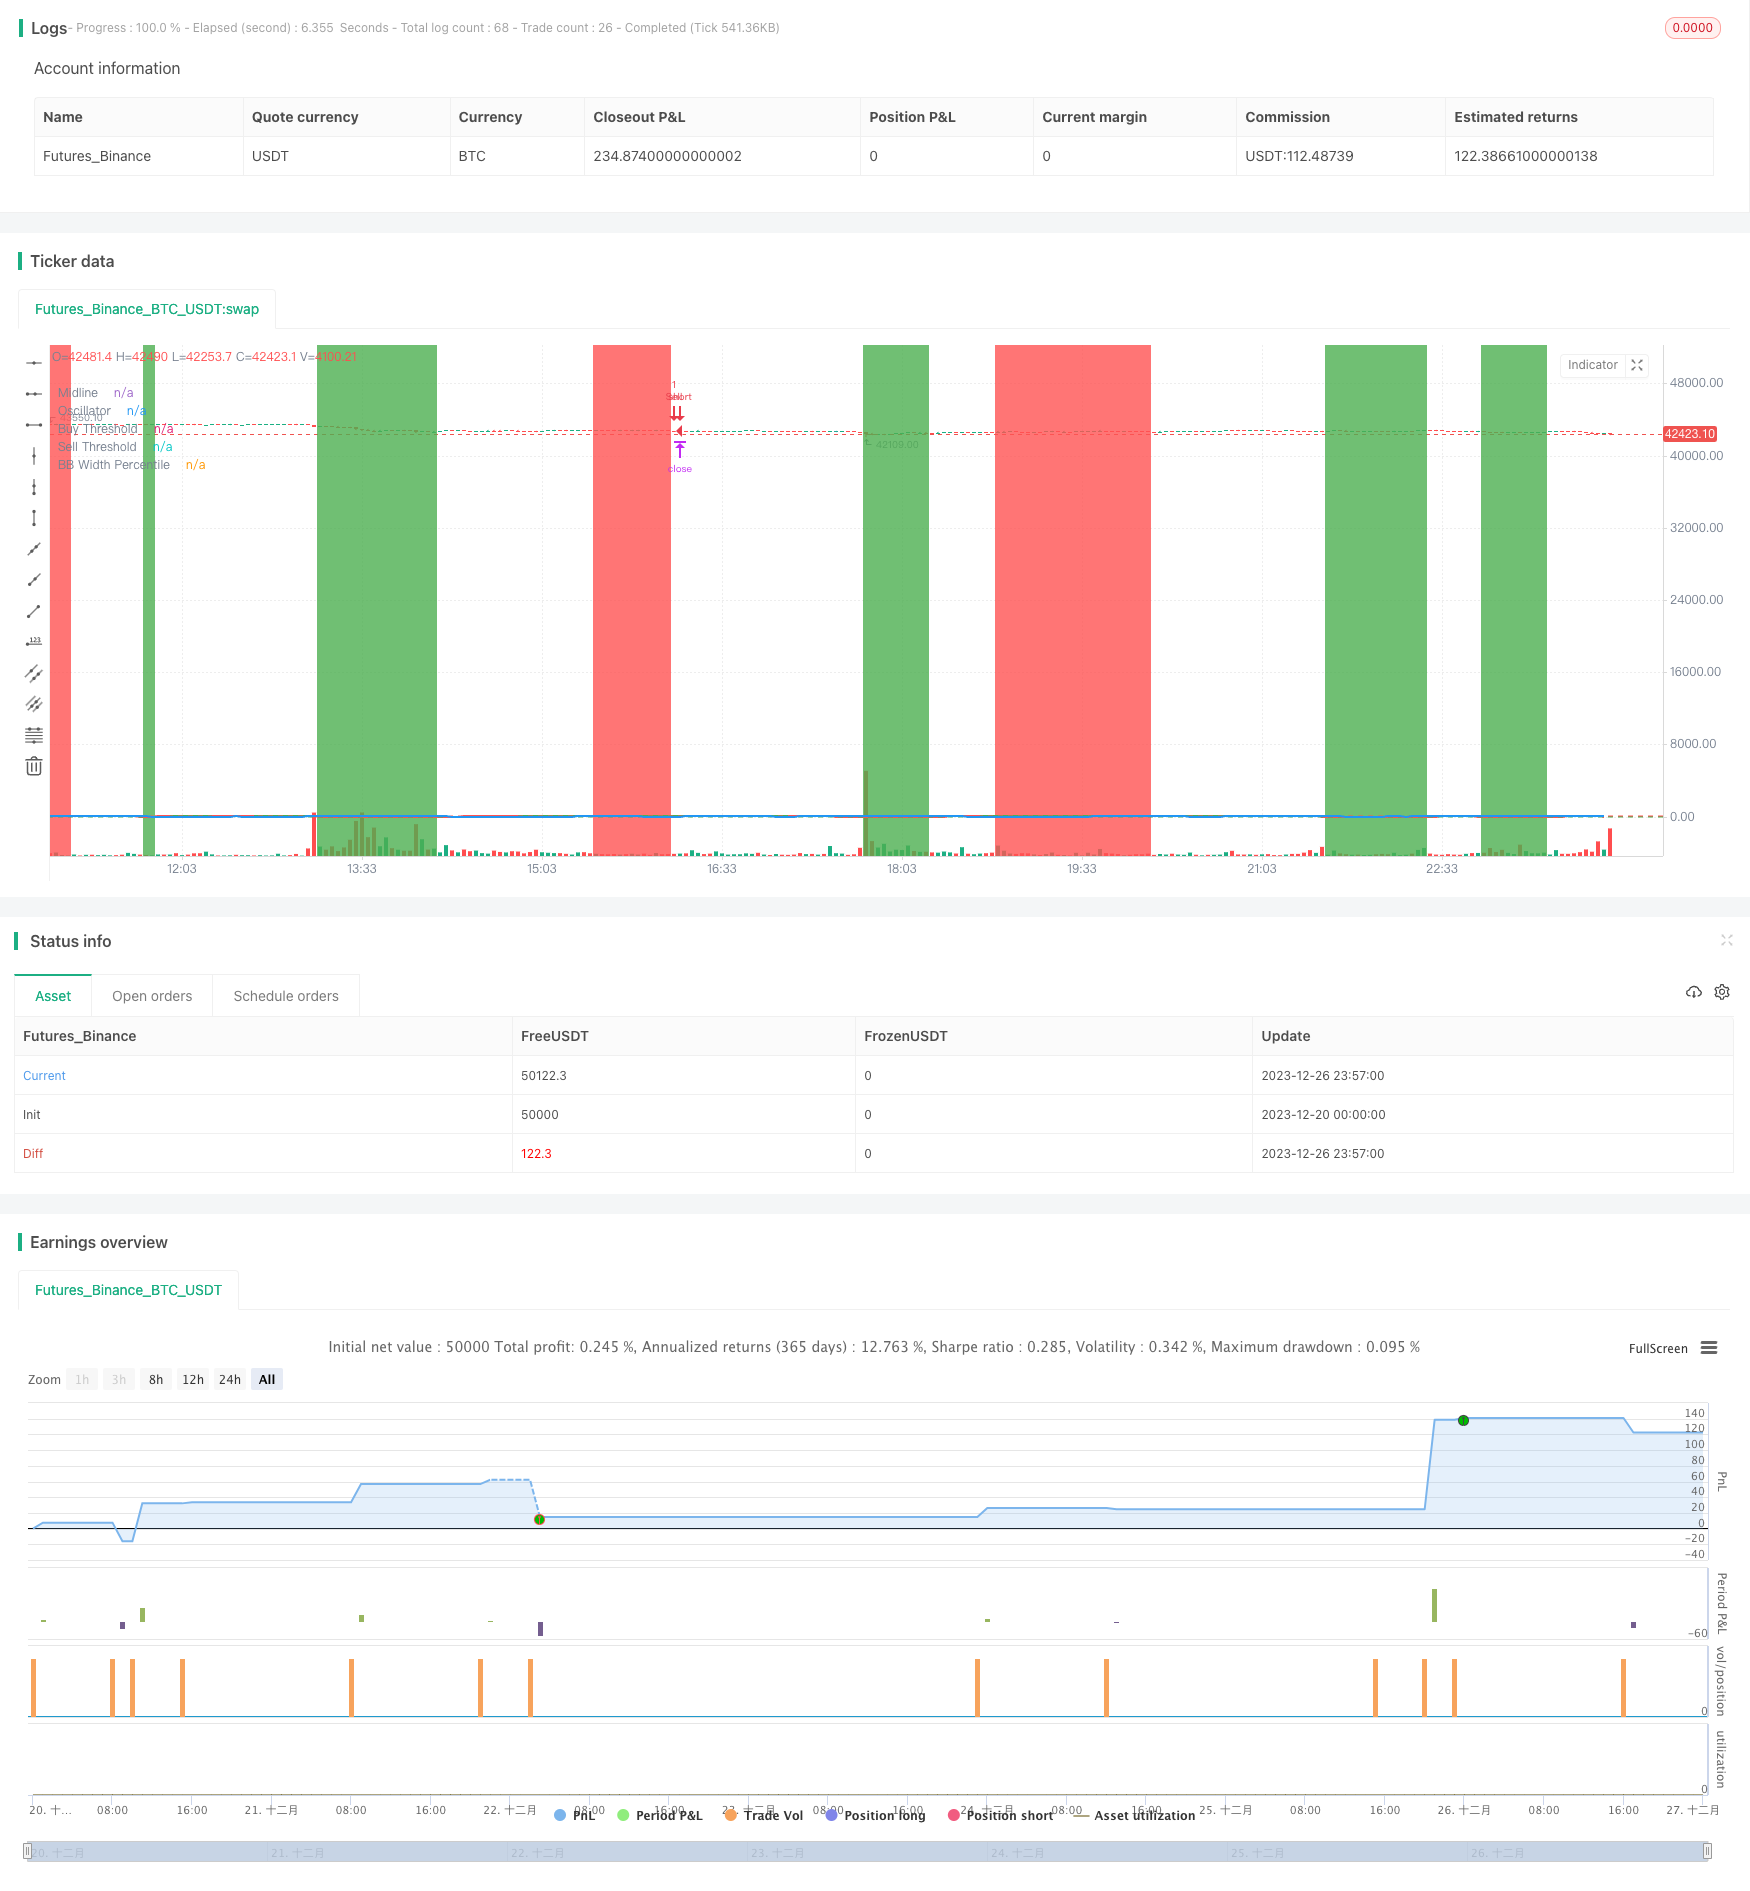
/*backtest
start: 2023-12-20 00:00:00
end: 2023-12-27 00:00:00
period: 3m
basePeriod: 1m
exchanges: [{"eid":"Futures_Binance","currency":"BTC_USDT"}]
*/

//@version=4
strategy("Premium MA Ratio Strategy", overlay = true)

// Input: Adjustable parameters for Premium MA Ratio
fast_length = input(10, title = "Fast MA Length")
slow_length = input(50, title = "Slow MA Length")
oscillator_threshold_buy = input(10, title = "Oscillator Buy Threshold")
oscillator_threshold_sell = input(90, title = "Oscillator Sell Threshold")

// Input: Adjustable parameters for Bollinger Bands
bb_length = input(20, title = "Bollinger Bands Length")
bb_source = input(close, title = "Bollinger Bands Source")
bb_deviation = input(2.0, title = "Bollinger Bands Deviation")
bb_width_threshold = input(30, title = "BB Width Threshold")
use_bb_filter = input(true, title = "Use BB Width Filter?")

// Input: Adjustable parameters for Trend Filter
use_trend_filter = input(true, title = "Use Trend Filter?")
trend_filter_period_1 = input(50, title = "Trend Filter Period 1")
trend_filter_period_2 = input(200, title = "Trend Filter Period 2")
use_second_trend_filter = input(true, title = "Use Second Trend Filter?")

// Input: Adjustable parameters for Exit Strategies
use_exit_strategies = input(true, title = "Use Exit Strategies?")
use_take_profit = input(true, title = "Use Take Profit?")
take_profit_ticks = input(150, title = "Take Profit in Ticks")
use_stop_loss = input(true, title = "Use Stop Loss?")
stop_loss_ticks = input(100, title = "Stop Loss in Ticks")
use_combined_exit = input(true, title = "Use Combined Exit Strategy?")
combined_exit_ticks = input(50, title = "Combined Exit Ticks")

// Input: Adjustable parameters for Time Filter
use_time_filter = input(false, title = "Use Time Filter?")
start_hour = input(8, title = "Start Hour")
end_hour = input(16, title = "End Hour")

// Calculate moving averages
fast_ma = sma(close, fast_length)
slow_ma = sma(close, slow_length)

// Calculate the premium price moving average ratio
premium_ratio = fast_ma / slow_ma * 100

// Calculate the percentile rank of the premium ratio
percentile_rank(src, length) =>
    rank = 0.0
    for i = 1 to length
        if src > src[i]
            rank := rank + 1.0
    percentile = rank / length * 100

// Calculate the percentile rank for the premium ratio using slow_length periods
premium_ratio_percentile = percentile_rank(premium_ratio, slow_length)

// Calculate the oscillator based on the percentile rank
oscillator = premium_ratio_percentile

// Dynamic coloring for the oscillator line
oscillator_color = oscillator > 50 ? color.green : color.red

// Plot the oscillator on a separate subplot as a line
hline(50, "Midline", color = color.gray)
plot(oscillator, title = "Oscillator", color = oscillator_color, linewidth = 2)

// Highlight the overbought and oversold areas
bgcolor(oscillator > oscillator_threshold_sell ? color.red : na, transp = 80)
bgcolor(oscillator < oscillator_threshold_buy ? color.green : na, transp = 80)

// Plot horizontal lines for threshold levels
hline(oscillator_threshold_buy, "Buy Threshold", color = color.green)
hline(oscillator_threshold_sell, "Sell Threshold", color = color.red)

// Calculate Bollinger Bands width
bb_upper = sma(bb_source, bb_length) + bb_deviation * stdev(bb_source, bb_length)
bb_lower = sma(bb_source, bb_length) - bb_deviation * stdev(bb_source, bb_length)
bb_width = bb_upper - bb_lower

// Calculate the percentile rank of Bollinger Bands width
bb_width_percentile = percentile_rank(bb_width, bb_length)

// Plot the Bollinger Bands width percentile line
plot(bb_width_percentile, title = "BB Width Percentile", color = color.blue, linewidth = 2)

// Calculate the trend filters
trend_filter_1 = sma(close, trend_filter_period_1)
trend_filter_2 = sma(close, trend_filter_period_2)

// Strategy logic
longCondition = crossover(premium_ratio_percentile, oscillator_threshold_buy)
shortCondition = crossunder(premium_ratio_percentile, oscillator_threshold_sell)

// Apply Bollinger Bands width filter if enabled
if (use_bb_filter)
    longCondition := longCondition and bb_width_percentile < bb_width_threshold
    shortCondition := shortCondition and bb_width_percentile < bb_width_threshold

// Apply trend filters if enabled
if (use_trend_filter)
    longCondition := longCondition and (close > trend_filter_1)
    shortCondition := shortCondition and (close < trend_filter_1)

// Apply second trend filter if enabled
if (use_trend_filter and use_second_trend_filter)
    longCondition := longCondition and (close > trend_filter_2)
    shortCondition := shortCondition and (close < trend_filter_2)

// Apply time filter if enabled
if (use_time_filter)
    longCondition := longCondition and (hour >= start_hour and hour <= end_hour)
    shortCondition := shortCondition and (hour >= start_hour and hour <= end_hour)

// Generate trading signals with exit strategies
if (use_exit_strategies)
    strategy.entry("Buy", strategy.long, when = longCondition)
    strategy.entry("Sell", strategy.short, when = shortCondition)

    // Define unique exit names for each order
    buy_take_profit_exit = "Buy Take Profit"
    buy_stop_loss_exit = "Buy Stop Loss"
    sell_take_profit_exit = "Sell Take Profit"
    sell_stop_loss_exit = "Sell Stop Loss"
    combined_exit = "Combined Exit"

    // Exit conditions for take profit
    if (use_take_profit)
        strategy.exit(buy_take_profit_exit, from_entry = "Buy", profit = take_profit_ticks)
        strategy.exit(sell_take_profit_exit, from_entry = "Sell", profit = take_profit_ticks)

    // Exit conditions for stop loss
    if (use_stop_loss)
        strategy.exit(buy_stop_loss_exit, from_entry = "Buy", loss = stop_loss_ticks)
        strategy.exit(sell_stop_loss_exit, from_entry = "Sell", loss = stop_loss_ticks)

    // Combined exit strategy
    if (use_combined_exit)
        strategy.exit(combined_exit, from_entry = "Buy", loss = combined_exit_ticks, profit = combined_exit_ticks)