Stratégie de signal de croisement de moyenne mobile
Date de création:
2024-01-08 15:54:32
Dernière modification:
2024-01-08 15:54:32
Copier:
0
Nombre de clics:
799
1
Suivre
1750
Abonnés
Aperçu
Cette stratégie permet de réaliser des signaux de croisement entre les moyennes mobiles en calculant et en traçant différents types de moyennes mobiles pour émettre des signaux d’achat et de vente.
Principe de stratégie
- Les stratégies permettent de choisir différents types de moyennes mobiles, y compris les SMA, EMA, WMA, etc.
- La stratégie calcule la moyenne mobile principale et permet de choisir une deuxième moyenne mobile.
- La volatilité du marché est jugée par la croisée des moyennes mobiles principales et secondaires.
- Un signal d’achat est généré lorsque la moyenne mobile de sa propre période est traversée par la moyenne mobile principale; un signal de vente est généré lorsque la moyenne mobile de sa propre période est traversée par la moyenne mobile principale.
- De cette façon, on peut juger plus clairement de l’état d’excédent du marché en croisant les moyennes mobiles.
Avantages stratégiques
- Les types de moyennes mobiles peuvent être personnalisés pour répondre à différents besoins.
- Une deuxième moyenne mobile peut être ajoutée pour rendre le signal plus clair.
- Une moyenne mobile personnalisable pour différentes périodes de temps
- Le rendu des couleurs est lisse, ce qui rend les graphiques plus clairs.
- L’utilisation d’un mécanisme de signaux croisés permet de déterminer avec précision la situation de la pluralité des aéroports.
Risques stratégiques et optimisation
- Les moyennes mobiles ont un retard et peuvent donner de faux signaux. La courbe peut être choisie de manière appropriée pour s’adapter à la moyenne mobile.
- La mauvaise configuration des cycles de la moyenne mobile peut entraîner des opportunités de transactions manquées. Vous pouvez tester plus de combinaisons pour trouver les meilleurs paramètres.
- Il est recommandé d’effectuer des vérifications en combinaison avec d’autres indicateurs, tels que l’indicateur d’énergie du volume des transactions, afin de réduire le risque.
- Il est possible d’envisager de changer la moyenne mobile du signal en moyenne curl, ce qui améliore la précision du signal.
- Les modèles d’apprentissage en profondeur, tels que LSTM, peuvent être combinés pour optimiser la stratégie.
Résumer
La stratégie est globalement bien pensée, utilise le principe de la croisée des moyennes mobiles pour juger de la volatilité du marché et peut être personnalisée pour répondre à des besoins différents. Il existe également des problèmes, mais ils peuvent être améliorés en optimisant les modèles et les paramètres.
Code source de la stratégie
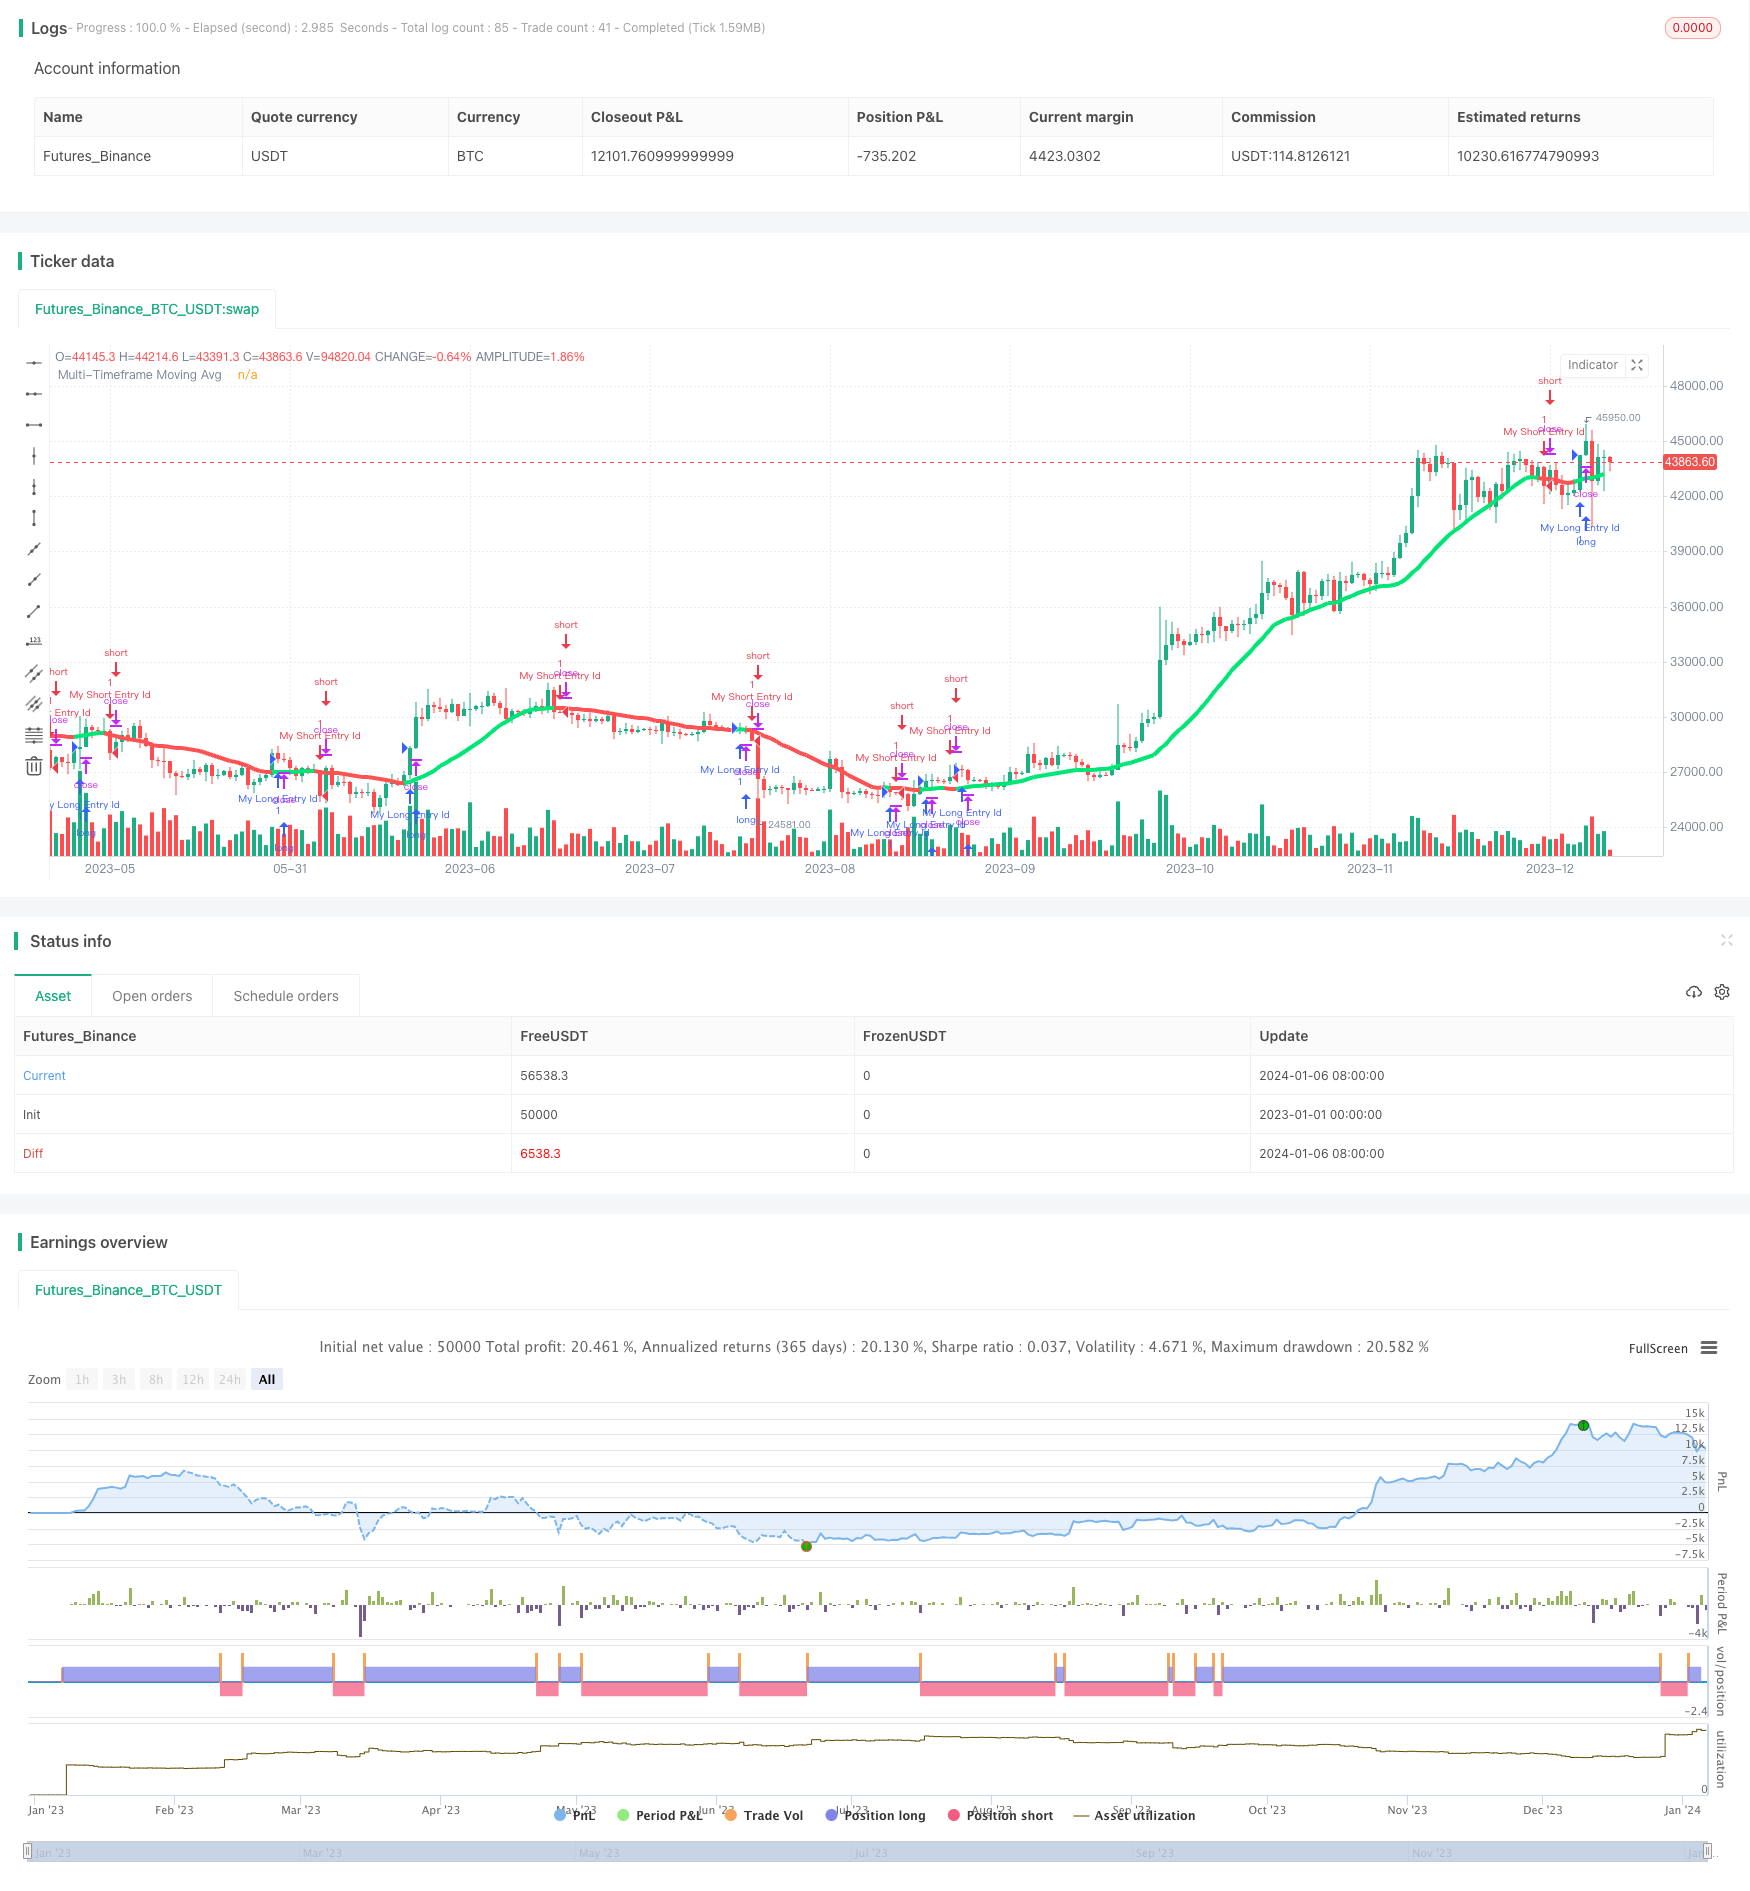
/*backtest
start: 2023-01-01 00:00:00
end: 2024-01-07 00:00:00
period: 1d
basePeriod: 1h
exchanges: [{"eid":"Futures_Binance","currency":"BTC_USDT"}]
*/

//@version=3
strategy("Moving averages-Strategy", overlay=true)
//Created by user ChrisMoody 4-24-2014
//Plots The Majority of Moving Averages
//Defaults to Current Chart Time Frame --- But Can Be Changed to Higher Or Lower Time Frames
//2nd MA Capability with Show Crosses Feature

//inputs
src = close
useCurrentRes = input(true, title="Use Current Chart Resolution?")
resCustom = input(title="Use Different Timeframe? Uncheck Box Above",defval="D")
len = input(20, title="Moving Average Length - LookBack Period")
atype = input(1,minval=1,maxval=7,title="1=SMA, 2=EMA, 3=WMA, 4=HullMA, 5=VWMA, 6=RMA, 7=TEMA")
cc = input(true,title="Change Color Based On Direction?")
smoothe = input(2, minval=1, maxval=10, title="Color Smoothing - 1 = No Smoothing")
doma2 = input(false, title="Optional 2nd Moving Average")
len2 = input(50, title="Moving Average Length - Optional 2nd MA")
atype2 = input(1,minval=1,maxval=7,title="1=SMA, 2=EMA, 3=WMA, 4=HullMA, 5=VWMA, 6=RMA, 7=TEMA")
cc2 = input(true,title="Change Color Based On Direction 2nd MA?")
warn = input(false, title="***You Can Turn On The Show Dots Parameter Below Without Plotting 2nd MA to See Crosses***")
warn2 = input(false, title="***If Using Cross Feature W/O Plotting 2ndMA - Make Sure 2ndMA Parameters are Set Correctly***")
sd = input(false, title="Show Dots on Cross of Both MA's")


res = useCurrentRes ? timeframe.period : resCustom
//hull ma definition
hullma = wma(2*wma(src, len/2)-wma(src, len), round(sqrt(len)))
//TEMA definition
ema1 = ema(src, len)
ema2 = ema(ema1, len)
ema3 = ema(ema2, len)
tema = 3 * (ema1 - ema2) + ema3

avg = atype == 1 ? sma(src,len) : atype == 2 ? ema(src,len) : atype == 3 ? wma(src,len) : atype == 4 ? hullma : atype == 5 ? vwma(src, len) : atype == 6 ? rma(src,len) : tema
//2nd Ma - hull ma definition
hullma2 = wma(2*wma(src, len2/2)-wma(src, len2), round(sqrt(len2)))
//2nd MA TEMA definition
sema1 = ema(src, len2)
sema2 = ema(sema1, len2)
sema3 = ema(sema2, len2)
stema = 3 * (sema1 - sema2) + sema3

avg2 = atype2 == 1 ? sma(src,len2) : atype2 == 2 ? ema(src,len2) : atype2 == 3 ? wma(src,len2) : atype2 == 4 ? hullma2 : atype2 == 5 ? vwma(src, len2) : atype2 == 6 ? rma(src,len2) : tema

out = avg
out_two = avg2

out1 = request.security(syminfo.tickerid, res, out)
out2 = request.security(syminfo.tickerid, res, out_two)

ma_up = out1 >= out1[smoothe]
ma_down = out1 < out1[smoothe]

col = cc ? ma_up ? lime : ma_down ? red : aqua : aqua
col2 = cc2 ? ma_up ? lime : ma_down ? red : aqua : aqua

circleYPosition = out2

plot(out1, title="Multi-Timeframe Moving Avg", style=line, linewidth=4, color = col)
plot(doma2 and out2 ? out2 : na, title="2nd Multi-TimeFrame Moving Average", style=circles, linewidth=4, color=col2)
plot(sd and cross(out1, out2) ? circleYPosition : na,style=cross, linewidth=5, color=yellow)


longCondition = crossover(out1, out1[smoothe])
if (longCondition)
    strategy.entry("My Long Entry Id", strategy.long)

shortCondition = crossunder(out1, out1[smoothe])
if (shortCondition)
    strategy.entry("My Short Entry Id", strategy.short)