Stratégie d'optimisation du suivi des tendances dynamiques
Date de création:
2024-01-12 11:20:04
Dernière modification:
2024-01-12 11:20:04
Copier:
2
Nombre de clics:
661
1
Suivre
1750
Abonnés
Aperçu
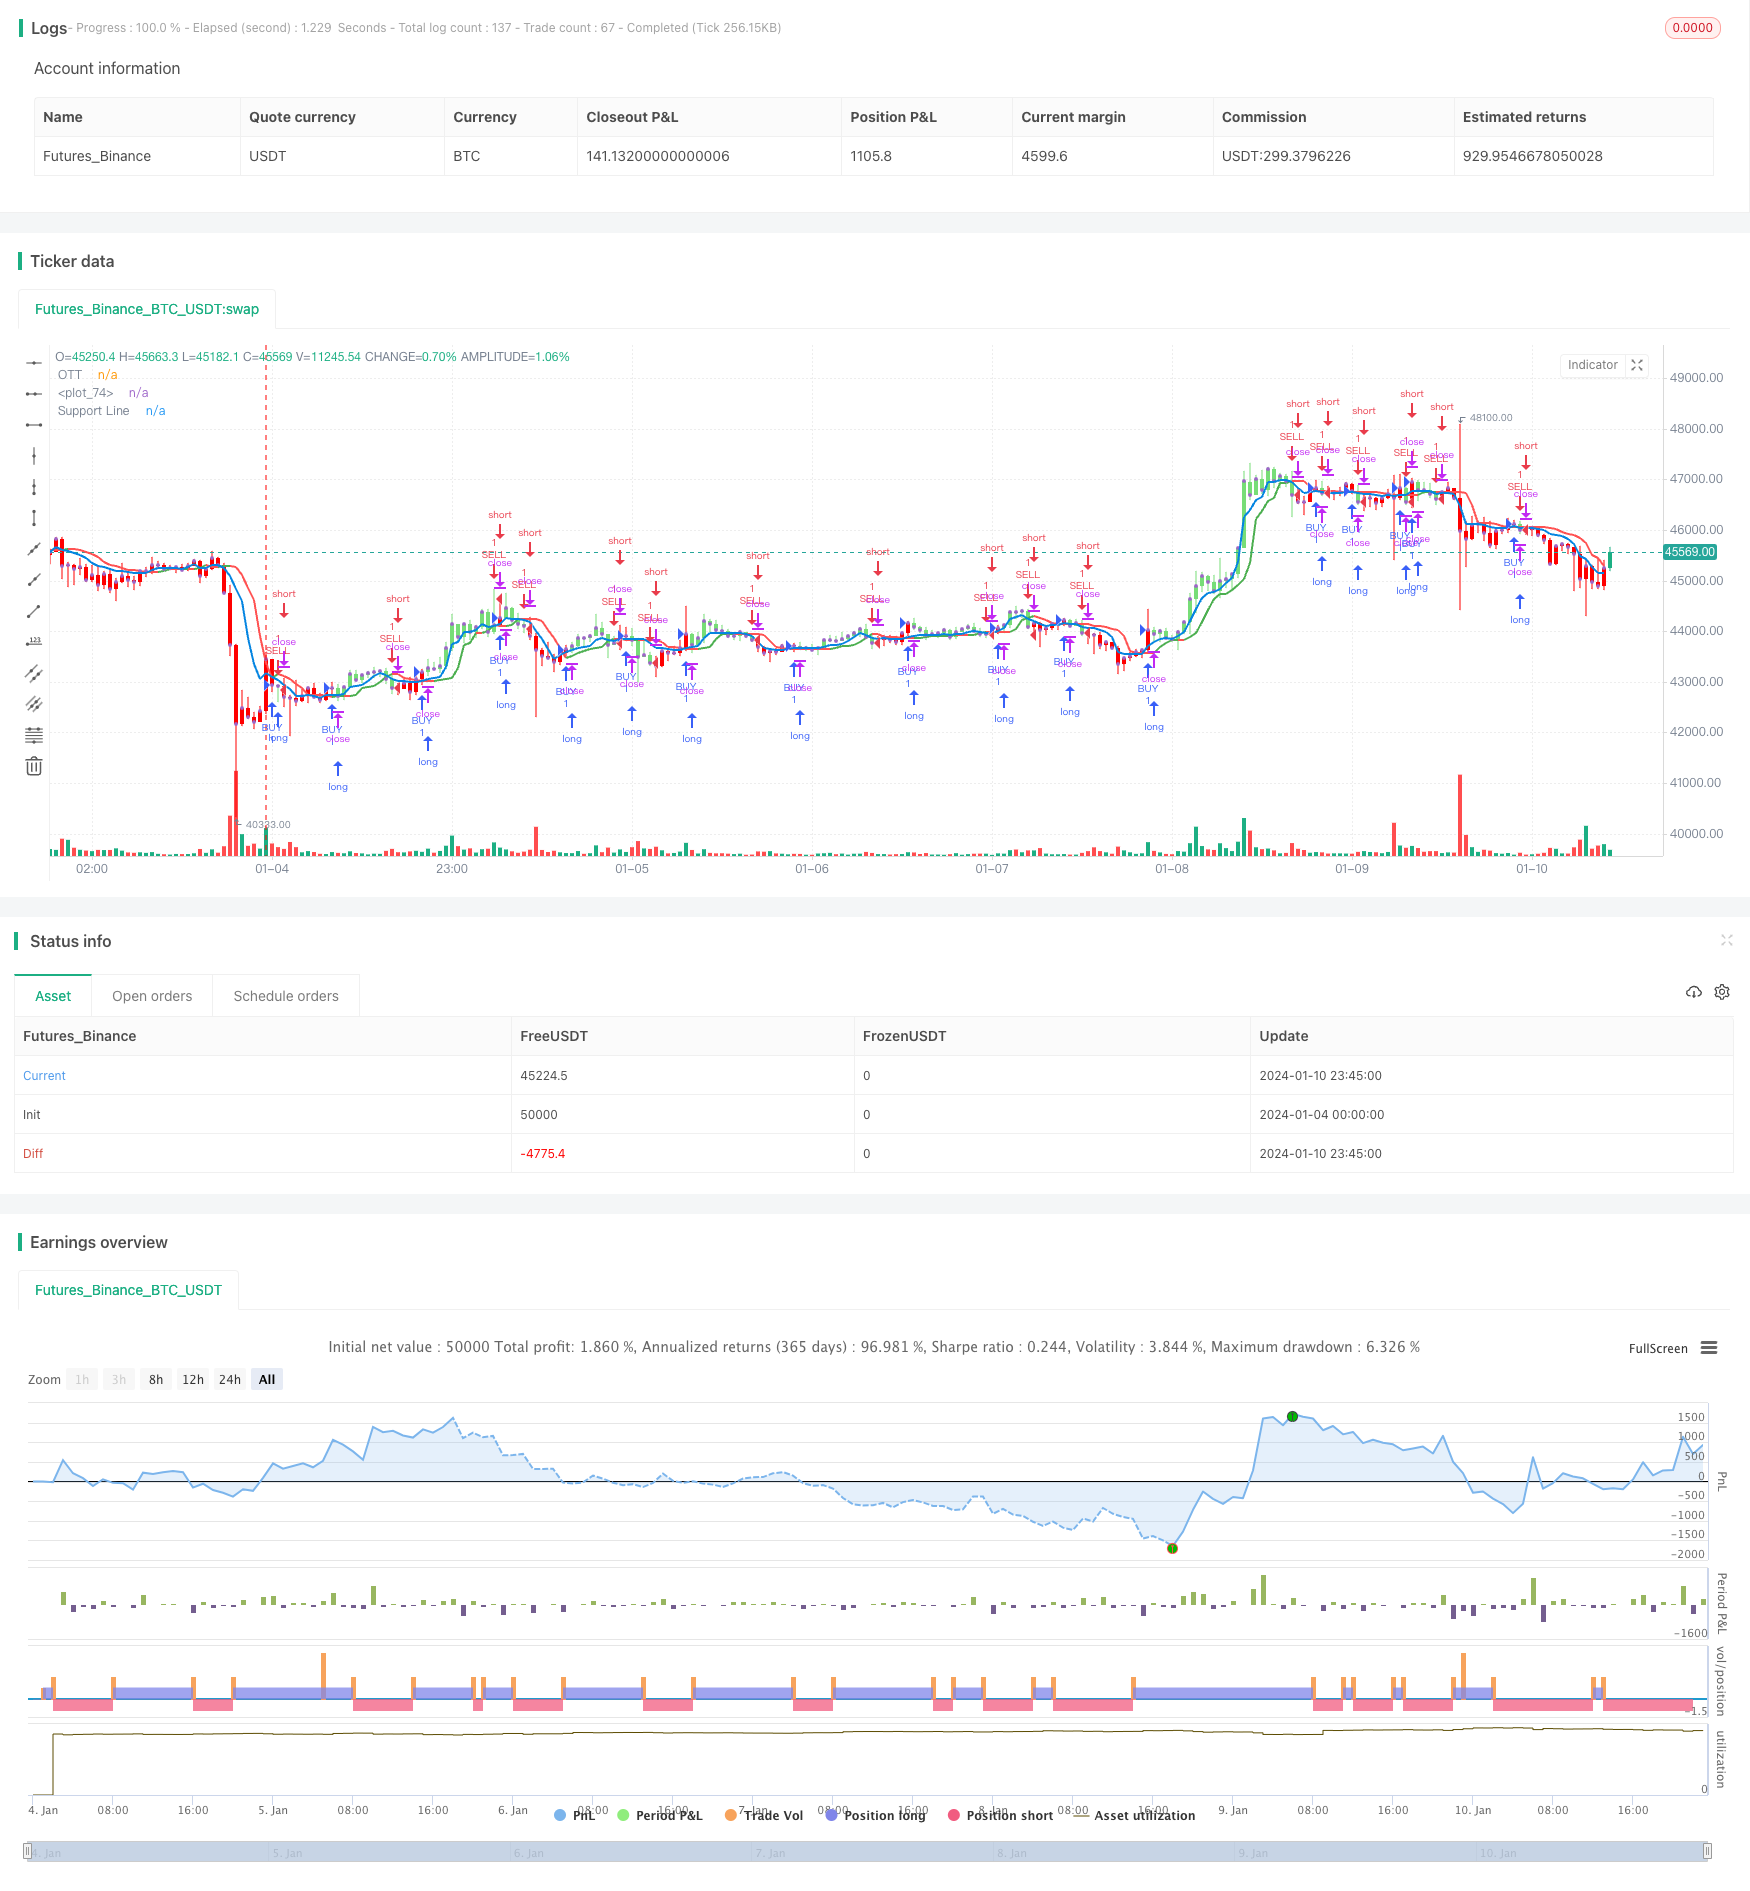
La stratégie calcule les indicateurs du CMO et le taux de variation, trace dynamiquement les lignes de support. Elle génère des signaux de transaction lorsque le prix franchit les lignes de support. La stratégie bloque également plus de profits en optimisant la zone d’arrêt près des lignes de support.
Principe de stratégie
- Calculer les indicateurs CMO pour déterminer les tendances des prix
- Calcul du taux de variation Var, qui reflète la tendance des variations de prix
- Tracer une ligne de soutien en fonction du taux de variation
- Calculer le longStop et le shortStop de la ligne de perte optimisée
- Un signal de transaction est généré lorsque le prix franchit la ligne de support
Analyse des avantages
- Utilisez l’indicateur CMO pour évaluer les tendances des prix et éviter les faux-bonds
- Les lignes de support permettent de déterminer clairement la direction de la tendance
- Une ligne de stop optimisée pour bloquer plus de profits
- Les signaux de transaction sont simples et clairs et faciles à suivre
Analyse des risques
- Les indicateurs des CMO sont en retard et risquent de manquer le tournant des prix
- Les lignes de soutien ont été brisées, ce qui pourrait créer de faux signaux.
- Une mauvaise optimisation du seuil de rupture peut entraîner des pertes plus importantes
Comment gérer les risques:
- Adaptation des paramètres du CMO pour réduire le retard
- Combiné à d’autres indicateurs de filtrage de faux signaux
- Test pour déterminer le bon taux d’optimisation de la rupture
Direction d’optimisation
- Plus d’indicateurs combinés pour filtrer les faux signaux
- L’IA optimise automatiquement la portée des arrêts
- Adaptation automatique du volume des transactions
Résumer
La stratégie est globalement efficace, en utilisant la ligne de soutien pour déterminer clairement la direction de la tendance. Elle est également efficace en combinant les indicateurs du CMO et l’optimisation de la capacité de stop loss. Cependant, il existe un certain risque de faux signaux qui peuvent être optimisés par une combinaison de plusieurs indicateurs.
Code source de la stratégie
/*backtest
start: 2024-01-04 00:00:00
end: 2024-01-11 00:00:00
period: 45m
basePeriod: 5m
exchanges: [{"eid":"Futures_Binance","currency":"BTC_USDT"}]
*/

// This source code is subject to the terms of the Mozilla Public License 2.0 at https://mozilla.org/MPL/2.0/
// © melihtuna

//@version=4
strategy("Optimized Trend Tracker - Strategy Version", shorttitle="OTT-Strategy", overlay=true, default_qty_type=strategy.percent_of_equity, default_qty_value=100, initial_capital=10000, currency=currency.USD, commission_value=0.1, commission_type=strategy.commission.percent)

src = input(close, title="Source")
pds=input(1, "OTT Period", minval=1)
percent=input(0.1, "OTT Percent", type=input.float, step=0.1, minval=0)
condition = input(title="Condition", defval="Support Line Crossing Signals", options=["Price/OTT Crossing Signals", "Support Line Crossing Signals"])
showsupport = input(title="Show Support Line?", type=input.bool, defval=true)
highlight = input(title="Show OTT Color Changes?", type=input.bool, defval=true)
highlighting = input(title="Highlighter On/Off ?", type=input.bool, defval=true)
barcoloing = input(title="Barcolor On/Off ?", type=input.bool, defval=true)
showlabels = input(title="Show OTT BUY/SELl Labels?", type=input.bool, defval=false)

// === INPUT BACKTEST RANGE ===
FromMonth = input(defval = 1, title = "From Month", minval = 1, maxval = 12)
FromDay   = input(defval = 1, title = "From Day", minval = 1, maxval = 31)
FromYear  = input(defval = 2020, title = "From Year", minval = 2017)
ToMonth   = input(defval = 1, title = "To Month", minval = 1, maxval = 12)
ToDay     = input(defval = 1, title = "To Day", minval = 1, maxval = 31)
ToYear    = input(defval = 9999, title = "To Year", minval = 2017)

// === FUNCTION EXAMPLE ===
start     = timestamp(FromYear, FromMonth, FromDay, 00, 00)  // backtest start window
finish    = timestamp(ToYear, ToMonth, ToDay, 23, 59)        // backtest finish window
window()  => time >= start and time <= finish ? true : false // create function "within window of time"

alpha=2/(pds+1)
ud1=src>src[1] ? src-src[1] : src
dd1=src<src[1] ? src[1]-src : src
UD=sum(ud1,9)
DD=sum(dd1,9)
CMO=(UD-DD)/(UD+DD)
k= abs(CMO)
Var=0.0
Var:=(alpha*k*src)+(1-alpha*k)*nz(Var[1])
fark=Var*percent*0.01
longStop = Var - fark
longStopPrev = nz(longStop[1], longStop)
longStop := Var > longStopPrev ? max(longStop, longStopPrev) : longStop
shortStop =  Var + fark
shortStopPrev = nz(shortStop[1], shortStop)
shortStop := Var < shortStopPrev ? min(shortStop, shortStopPrev) : shortStop
dir = 1
dir := nz(dir[1], dir)
dir := dir == -1 and Var > shortStopPrev ? 1 : dir == 1 and Var < longStopPrev ? -1 : dir
MT = dir==1 ? longStop: shortStop
OTT=Var>MT ? MT*(200+percent)/200 : MT*(200-percent)/200
plot(showsupport ? Var : na, color=#0585E1, linewidth=2, title="Support Line")
OTTC = highlight ? OTT[2] > OTT[3] ? color.green : color.red : #B800D9
pALL=plot(nz(OTT[2]), color=OTTC, linewidth=2, title="OTT", transp=0)

buySignalk = window() and crossover(Var, OTT[2])
sellSignallk = window() and crossunder(Var, OTT[2])
buySignalc = window() and crossover(src, OTT[2])
sellSignallc = window() and crossunder(src, OTT[2])

plotshape(condition == "Support Line Crossing Signals" ? showlabels and buySignalk ? OTT*0.995 : na : showlabels and buySignalc ? OTT*0.995 : na, title="BUY", text="BUY", location=location.belowbar, style=shape.labelup, size=size.tiny, color=#0F18BF, textcolor=color.white, transp=0)
plotshape(condition == "Support Line Crossing Signals" ? showlabels and sellSignallk ? OTT*1.005 : na : showlabels and sellSignallc ? OTT*1.005 : na, title="SELL", text="SELL", location=location.abovebar, style=shape.labeldown, size=size.tiny, color=#0F18BF, textcolor=color.white, transp=0)

ottBuyColor=#77DD77
ottSellColor=#FF0000
vColor = strategy.position_size > 0 ? ottBuyColor : ottSellColor

if condition == "Support Line Crossing Signals"
    strategy.entry("BUY", true, 1, when = buySignalk)
    strategy.entry("SELL", false, 1, when = sellSignallk)
else
    strategy.entry("BUY", true, 1, when = buySignalc)
    strategy.entry("SELL", false, 1, when = sellSignallc)

mPlot = plot(close, title="", style=plot.style_circles, linewidth=0,display=display.none)

longFillColor = highlighting ? (Var>OTT ? color.green : na) : na
shortFillColor = highlighting ? (Var<OTT ? color.red : na) : na
fill(mPlot, pALL, title="UpTrend Highligter", color=longFillColor)
fill(mPlot, pALL, title="DownTrend Highligter", color=shortFillColor)

barcolor(barcoloing ? vColor : na)