Stratégie de croisement de moyenne mobile pondérée par le momentum avec double moyenne mobile
Date de création:
2024-01-12 12:04:55
Dernière modification:
2024-01-12 12:04:55
Copier:
1
Nombre de clics:
771
1
Suivre
1750
Abonnés
Aperçu
La stratégie consiste à calculer des moyennes mobiles pondérées en énergie (MAEMA) de deux périodes différentes, générant des signaux d’achat et de vente lorsqu’ils se croisent. Les courts cycles sont utilisés pour déterminer les tendances du marché et les signaux de revers à court terme, tandis que les longs cycles sont utilisés pour déterminer la direction des principales tendances.
Le principe
- Calculer le MAEMA des lignes rapides ((80 cycles) et des lignes lentes ((144 cycles)
- Les lignes rapides reflètent les tendances à court terme et les points de retournement. Les lignes lentes reflètent les principales tendances.
- Lorsque la ligne rapide traverse la ligne lente, un signal d’achat est généré. Lorsque la ligne rapide traverse la ligne lente, un signal de vente est généré.
- La stratégie trace simultanément 3 points de prévision, représentant les valeurs probables pour le prochain cycle, afin de juger des tendances futures de croisement.
- La stratégie doit tirer pleinement parti de la dynamique et des capacités de prévision de l’indicateur MAEMA.
Analyse des avantages
- MAEMA a intégré un facteur de dynamique lui-même, qui permet de saisir plus rapidement les changements de tendance.
- Une stratégie de double équilibre pour juger de la direction des tendances sur différentes périodes.
- La combinaison de l’intersection des lignes rapides et lentes et des points de prévision du MAEMA lui-même rendent les signaux d’achat et de vente plus fiables.
- Les cartes automatiques sont complètes et reflètent intuitivement les fluctuations du marché.
Analyse des risques
- En cas de fluctuation anormale du marché, la sensibilité de l’indicateur MAEMA peut être trop élevée et générer un faux signal. Le point de rupture peut être assoupli de manière appropriée.
- Le système de ligne moyenne est susceptible de générer de faux signaux pour les marchés à plat. D’autres filtres peuvent être ajoutés.
- Les réglages périodiques de la ligne rapide et de la ligne lente nécessitent de déterminer les paramètres optimaux en fonction des différentes variétés.
Direction d’optimisation
- Optimiser les paramètres de périodicité des lignes rapides et lentes MAEMA pour trouver la combinaison optimale de paramètres.
- Ajout de conditions de filtrage pour éviter l’ouverture de positions dans des conditions de choc. Par exemple, l’introduction de DMI, MACD et autres tendances de jugement.
- Le coefficient d’ATR est ajusté en fonction des résultats des tests de retour, le point de rupture est déplacé pour réduire les faux positifs et contrôler le risque.
Résumer
La stratégie utilise une moyenne mobile dynamique pondérée pour juger des changements de tendance du marché, les principes de base sont clairs et simples. En combinaison avec la dynamique et les fonctions de prévision de MAEMA, il est préférable d’identifier les signaux de renversement.
Code source de la stratégie
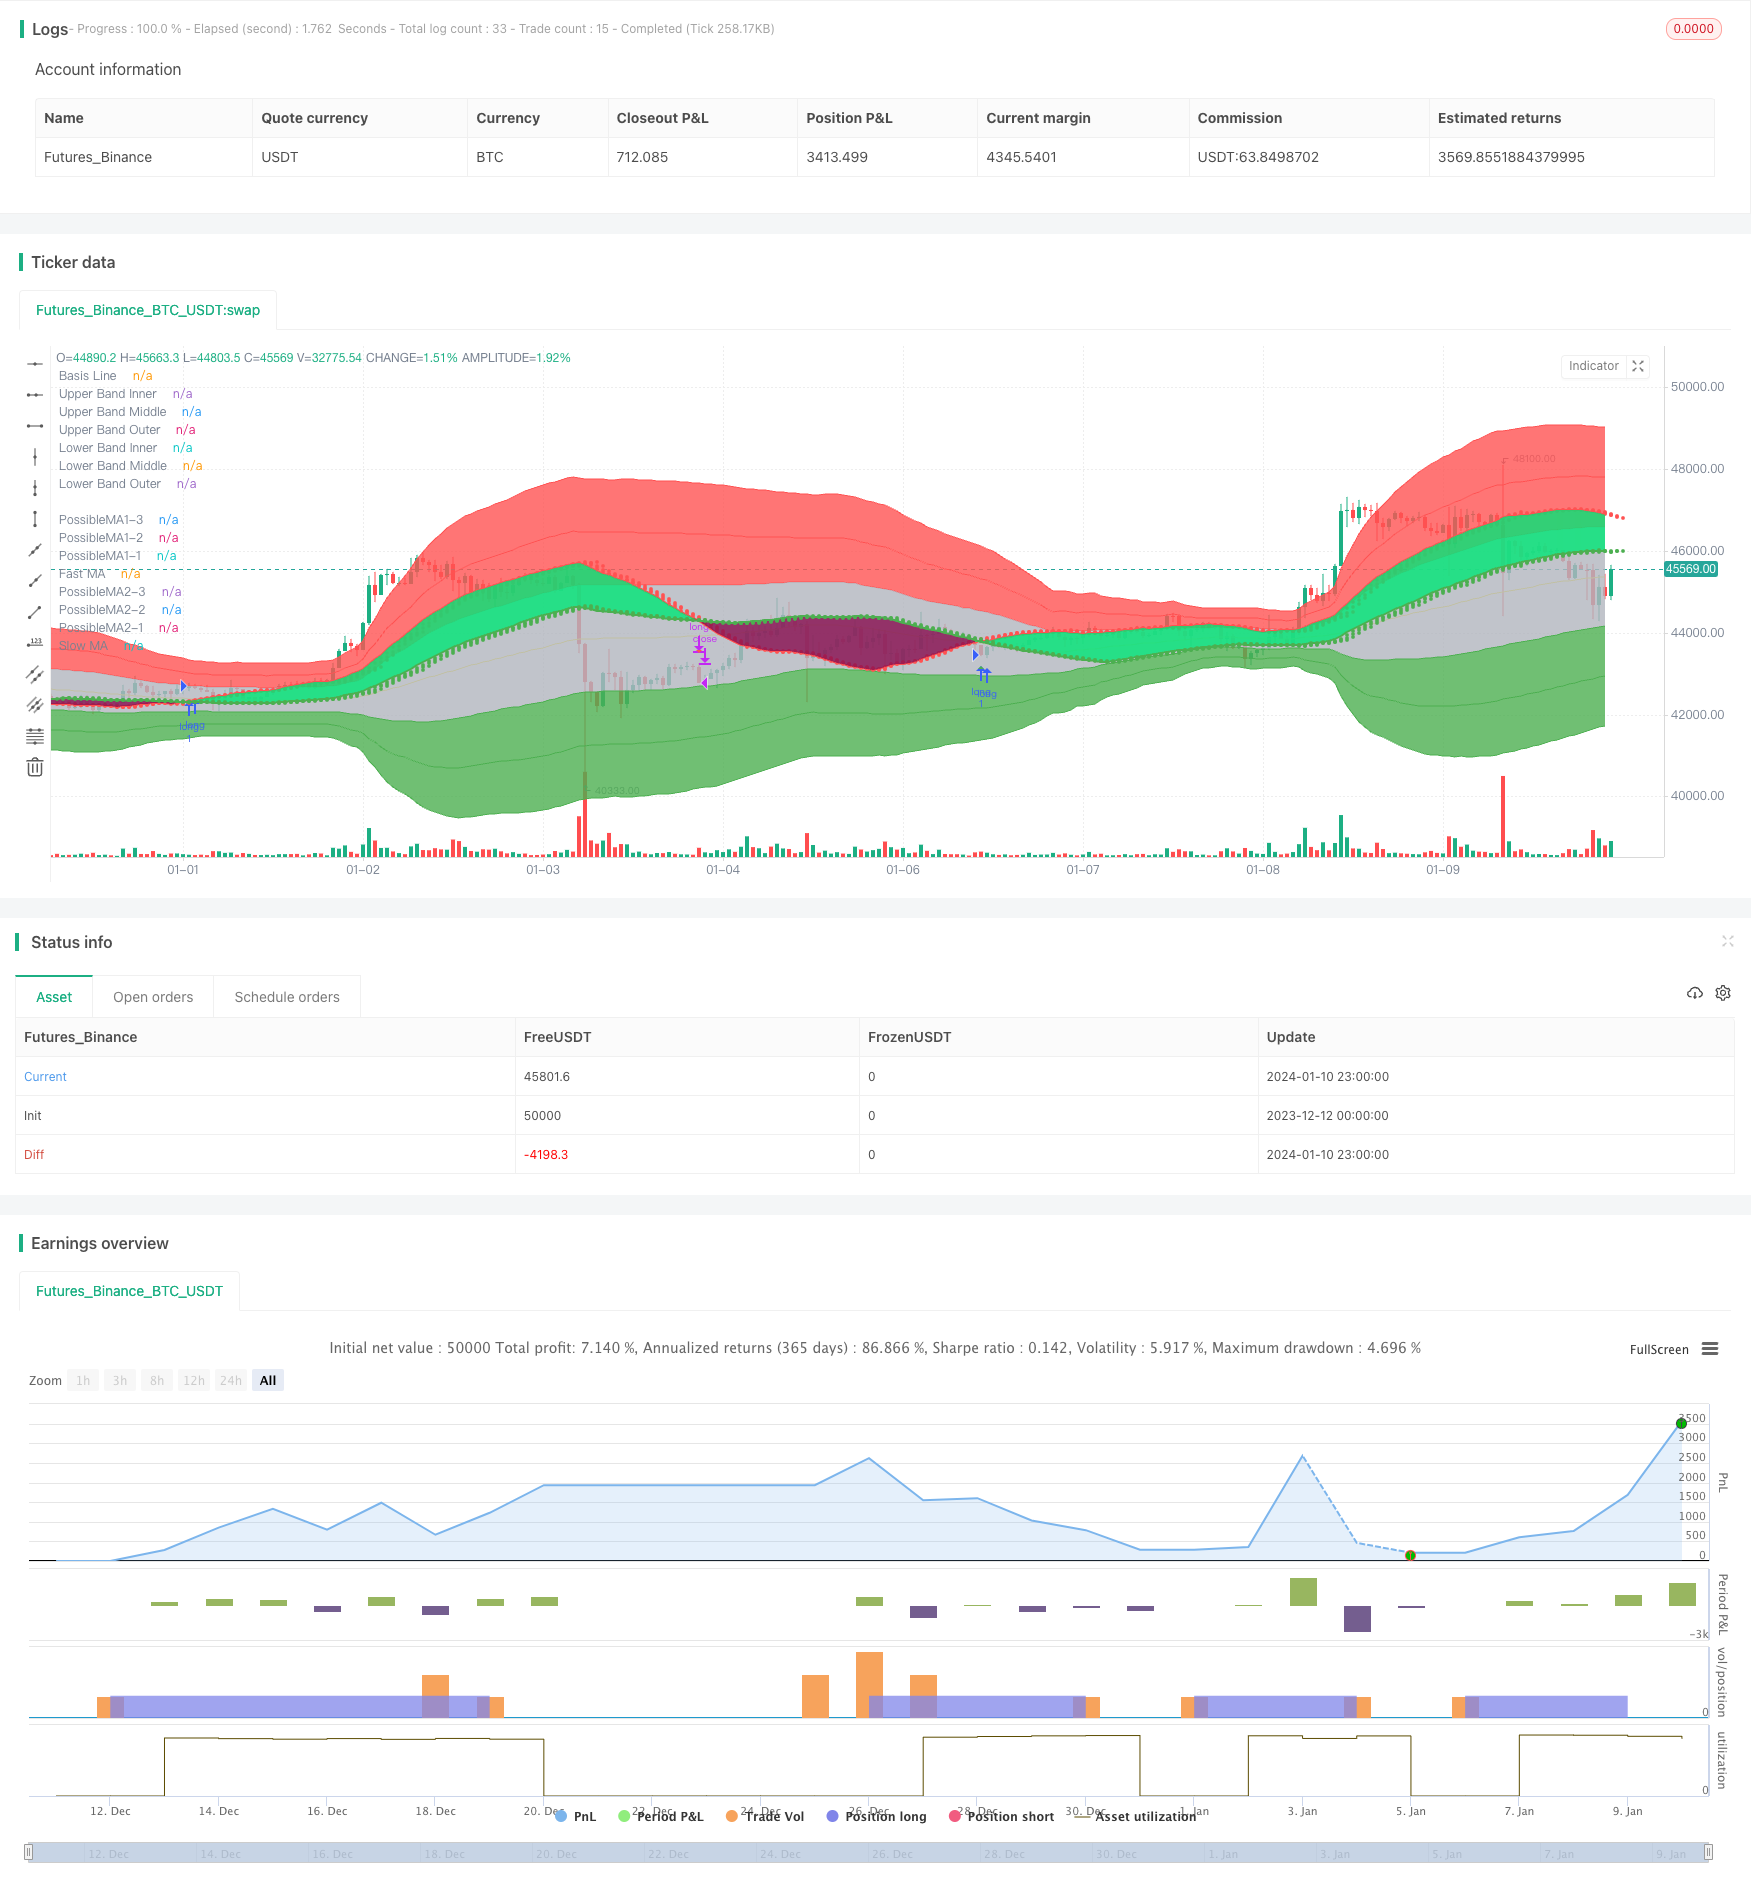
/*backtest
start: 2023-12-12 00:00:00
end: 2024-01-11 00:00:00
period: 1h
basePeriod: 15m
exchanges: [{"eid":"Futures_Binance","currency":"BTC_USDT"}]
*/

// © informanerd
//@version=4

strategy("MultiType Shifting Predictive MAs Crossover", shorttitle = "MTSPMAC + MBHB Strategy", overlay = true)

//inputs

predict = input(true, "Show MA Prediction Tails")
trendFill = input(true, "Fill Between MAs Based on Trend")
signal = input(true, "Show Cross Direction Signals")

showMA1 = input(true, "[ Show Fast Moving Average ]══════════")
type1 = input("MAEMA (Momentum Adjusted Exponential)", "Fast MA Type", options = ["MAEMA (Momentum Adjusted Exponential)", "DEMA (Double Exponential)", "EMA (Exponential)", "HMA (Hull)", "LSMA (Least Squares)", "RMA (Adjusted Exponential)", "SMA (Simple)", "SWMA (Symmetrically Weighted)", "TEMA (Triple Exponential)", "TMA (Triangular)", "VMA / VIDYA (Variable Index Dynamic Average)", "VWMA (Volume Weighted)", "WMA (Weighted)"])
src1 = input(high, "Fast MA Source")
len1 = input(80, "Fast MA Length", minval = 2)
shift1 = input(0, "Fast MA Shift")
maThickness1 = input(2, "Fast MA Thickness", minval = 1)
trendColor1 = input(false, "Color Fast MA Based on Detected Trend")
showBand1 = input(false, "Show Fast MA Range Band")
atrPer1 = input(20, "Fast Band ATR Lookback Period")
atrMult1 = input(3, "Fast Band ATR Multiplier")

showMA2 = input(true, "[ Show Slow Moving Average ]══════════")
type2 = input("MAEMA (Momentum Adjusted Exponential)", "Slow MA Type", options = ["MAEMA (Momentum Adjusted Exponential)", "DEMA (Double Exponential)", "EMA (Exponential)", "HMA (Hull)", "LSMA (Least Squares)", "RMA (Adjusted Exponential)", "SMA (Simple)", "SWMA (Symmetrically Weighted)", "TEMA (Triple Exponential)", "TMA (Triangular)", "VMA / VIDYA (Variable Index Dynamic Average)", "VWMA (Volume Weighted)", "WMA (Weighted)"])
src2 = input(close, "Slow MA Source")
len2 = input(144, "Slow MA Length", minval = 2)
shift2 = input(0, "Slow MA Shift")
maThickness2 = input(2, "Slow MA Thickness", minval = 1)
trendColor2 = input(false, "Color Slow MA Based on Detected Trend")
showBand2 = input(false, "Show Slow MA Range Band")
atrPer2 = input(20, "Slow Band ATR Lookback Period")
atrMult2 = input(3, "Slow Band ATR Multiplier")

//ma calculations

ma(type, src, len) =>
    if type == "MAEMA (Momentum Adjusted Exponential)"
        goldenRatio = (1 + sqrt(5)) / 2
        momentumLen = round(len / goldenRatio), momentum = change(src, momentumLen), probabilityLen = len / goldenRatio / goldenRatio
        ema(src + (momentum + change(momentum, momentumLen) * 0.5) * sum(change(src) > 0 ? 1 : 0, round(probabilityLen)) / probabilityLen, len)
    else if type == "DEMA (Double Exponential)"
        2 * ema(src, len) - ema(ema(src, len), len)
    else if type == "EMA (Exponential)"
        ema(src, len)
    else if type == "HMA (Hull)"
        wma(2 * wma(src, len / 2) - wma(src, len), round(sqrt(len)))
    else if type == "LSMA (Least Squares)"
        3 * wma(src, len) - 2 * sma(src, len)
    else if type == "RMA (Adjusted Exponential)"
        rma(src, len)
    else if type == "SMA (Simple)"
        sma(src, len)
    else if type == "SWMA (Symmetrically Weighted)"
        swma(src)
    else if type == "TEMA (Triple Exponential)"
        3 * ema(src, len) - 3 * ema(ema(src, len), len) + ema(ema(ema(src, len), len), len)
    else if type == "TMA (Triangular)"
        swma(wma(src, len))
    else if type == "VMA / VIDYA (Variable Index Dynamic Average)"
        smoothing = 2 / len, volIndex = abs(cmo(src, len) / 100)
        vma = 0., vma := (smoothing * volIndex * src) + (1 - smoothing * volIndex) * nz(vma[1])
    else if type == "VWMA (Volume Weighted)"
        vwma(src, len)
    else if type == "WMA (Weighted)"
        wma(src, len)

ma1 = ma(type1, src1, len1)
ma2 = ma(type2, src2, len2)

//ma predictions

pma11 = len1 > 2 ? (ma(type1, src1, len1 - 1) * (len1 - 1) + src1 * 1) / len1 : na
pma12 = len1 > 3 ? (ma(type1, src1, len1 - 2) * (len1 - 2) + src1 * 2) / len1 : na
pma13 = len1 > 4 ? (ma(type1, src1, len1 - 3) * (len1 - 3) + src1 * 3) / len1 : na

pma21 = len2 > 2 ? (ma(type2, src2, len2 - 1) * (len2 - 1) + src2 * 1) / len2 : na
pma22 = len2 > 3 ? (ma(type2, src2, len2 - 2) * (len2 - 2) + src2 * 2) / len2 : na
pma23 = len2 > 4 ? (ma(type2, src2, len2 - 3) * (len2 - 3) + src2 * 3) / len2 : na

//ma range bands

r1 = atr(atrPer1) * atrMult1
hBand1 = ma1 + r1
lBand1 = ma1 - r1

r2 = atr(atrPer2) * atrMult2
hBand2 = ma2 + r2
lBand2 = ma2 - r2

//drawings

ma1Plot = plot(showMA1 ? ma1 : na, "Fast MA", trendColor1 and ma1 > src1 ? color.maroon : trendColor1 and ma1 < src1 ? color.lime : trendColor1 ? color.gray : color.red, maThickness1, offset = shift1)
ma2Plot = plot(showMA2 ? ma2 : na, "Slow MA", trendColor2 and ma2 > src2 ? color.maroon : trendColor2 and ma2 < src2 ? color.lime : trendColor2 ? color.gray : color.green, maThickness2, offset = shift2)
fill(ma1Plot, ma2Plot, trendFill and ma1 > ma2 ? color.lime : trendFill and ma1 < ma2 ? color.maroon : na, 90)

plot(showMA1 and predict ? pma11 : na, "PossibleMA1-1", trendColor1 and ma1 > src1 ? color.maroon : trendColor1 and ma1 < src1 ? color.lime : trendColor1 ? color.gray : color.red, style = plot.style_circles, offset = shift1 + 1, show_last = 1)
plot(showMA1 and predict ? pma12 : na, "PossibleMA1-2", trendColor1 and ma1 > src1 ? color.maroon : trendColor1 and ma1 < src1 ? color.lime : trendColor1 ? color.gray : color.red, style = plot.style_circles, offset = shift1 + 2, show_last = 1)
plot(showMA1 and predict ? pma13 : na, "PossibleMA1-3", trendColor1 and ma1 > src1 ? color.maroon : trendColor1 and ma1 < src1 ? color.lime : trendColor1 ? color.gray : color.red, style = plot.style_circles, offset = shift1 + 3, show_last = 1)
plot(showMA2 and predict ? pma21 : na, "PossibleMA2-1", trendColor2 and ma2 > src2 ? color.maroon : trendColor2 and ma2 < src2 ? color.lime : trendColor2 ? color.gray : color.green, style = plot.style_circles, offset = shift2 + 1, show_last = 1)
plot(showMA2 and predict ? pma22 : na, "PossibleMA2-2", trendColor2 and ma2 > src2 ? color.maroon : trendColor2 and ma2 < src2 ? color.lime : trendColor2 ? color.gray : color.green, style = plot.style_circles, offset = shift2 + 2, show_last = 1)
plot(showMA2 and predict ? pma23 : na, "PossibleMA2-3", trendColor2 and ma2 > src2 ? color.maroon : trendColor2 and ma2 < src2 ? color.lime : trendColor2 ? color.gray : color.green, style = plot.style_circles, offset = shift2 + 3, show_last = 1)

plot(showBand1 ? hBand1 : na, "Fast Higher Band", trendColor1 and ma1 > src1 ? color.maroon : trendColor1 and ma1 < src1 ? color.lime : trendColor1 ? color.gray : color.red, offset = shift1)
plot(showBand1 ? lBand1 : na, "Fast Lower Band", trendColor1 and ma1 > src1 ? color.maroon : trendColor1 and ma1 < src1 ? color.lime : trendColor1 ? color.gray : color.red, offset = shift1)
plot(showBand2 ? hBand2 : na, "Slow Higher Band", trendColor2 and ma2 > src2 ? color.maroon : trendColor2 and ma2 < src2 ? color.lime : trendColor2 ? color.gray : color.green, offset = shift2)
plot(showBand2 ? lBand2 : na, "Slow Lower Band", trendColor2 and ma2 > src2 ? color.maroon : trendColor2 and ma2 < src2 ? color.lime : trendColor2 ? color.gray : color.green, offset = shift2)

//crosses & alerts

up = crossover(ma1, ma2)
down = crossover(ma2, ma1)

plotshape(signal ? up : na, "Buy", shape.triangleup, location.belowbar, color.green, offset = shift1, size = size.small)
plotshape(signal ? down : na, "Sell", shape.triangledown, location.abovebar, color.red, offset = shift1, size = size.small)

alertcondition(up, "Buy", "Buy")
alertcondition(down, "Sell", "Sell")

// @version=1

// Title: "Multi Bollinger Heat Bands - EMA/Breakout options".
// Author: JayRogers
//
// * Description *
//   Short: It's your Basic Bollinger Bands, but 3 of them, and some pointy things.
//
//   Long:  Three stacked sma based Bollinger Bands designed just to give you a quick visual on the "heat" of movement.
//          Set inner band as you would expect, then set your preferred additional multiplier increments for the outer 2 bands.
//          Option to use EMA as alternative basis, rather than SMA.
//          Breakout indication shapes, which have their own multiplier seperate from the BB's; but still tied to same length/period.

// strategy(shorttitle="[JR]MBHB_EBO", title="[JR] Multi Bollinger Heat Bands - EMA/Breakout options", overlay=true)

// Bollinger Bands Inputs
bb_use_ema = input(false, title="Use EMA Basis?")
bb_length = input(80, minval=1, title="Bollinger Length")
bb_source = input(close, title="Bollinger Source")
bb_mult = input(1.0, title="Base Multiplier", minval=0.001, maxval=50)
bb_mult_inc = input(1, title="Multiplier Increment", minval=0.001, maxval=2)
// Breakout Indicator Inputs
break_mult = input(3, title="Breakout Multiplier", minval=0.001, maxval=50)
breakhigh_source = input(high, title="High Break Source")
breaklow_source = input(low, title="Low Break Source")

bb_basis = bb_use_ema ? ema(bb_source, bb_length) : sma(bb_source, bb_length)

// Deviation
// * I'm sure there's a way I could write some of this cleaner, but meh.
dev = stdev(bb_source, bb_length)
bb_dev_inner = bb_mult * dev
bb_dev_mid = (bb_mult + bb_mult_inc) * dev
bb_dev_outer = (bb_mult + (bb_mult_inc * 2)) * dev
break_dev = break_mult * dev

// Upper bands
inner_high = bb_basis + bb_dev_inner
mid_high = bb_basis + bb_dev_mid
outer_high = bb_basis + bb_dev_outer
// Lower Bands
inner_low = bb_basis - bb_dev_inner
mid_low = bb_basis - bb_dev_mid
outer_low = bb_basis - bb_dev_outer

// Breakout Deviation
break_high = bb_basis + break_dev
break_low = bb_basis - break_dev

// plot basis
plot(bb_basis, title="Basis Line", color=color.yellow, transp=50)

// plot and fill upper bands
ubi = plot(inner_high, title="Upper Band Inner", color=color.red, transp=90)
ubm = plot(mid_high, title="Upper Band Middle", color=color.red, transp=85)
ubo = plot(outer_high, title="Upper Band Outer", color=color.red, transp=80)
fill(ubi, ubm, title="Upper Bands Inner Fill", color=color.red, transp=90)
fill(ubm, ubo, title="Upper Bands Outer Fill",color=color.red, transp=80)

// plot and fill lower bands
lbi = plot(inner_low, title="Lower Band Inner", color=color.green, transp=90)
lbm = plot(mid_low, title="Lower Band Middle", color=color.green, transp=85)
lbo = plot(outer_low, title="Lower Band Outer", color=color.green, transp=80)
fill(lbi, lbm, title="Lower Bands Inner Fill", color=color.green, transp=90)
fill(lbm, lbo, title="Lower Bands Outer Fill", color=color.green, transp=80)

// center channel fill
fill(ubi, lbi, title="Center Channel Fill", color=color.silver, transp=100)

// plot breakouts
plotshape(breakhigh_source >= break_high, title="High Breakout", style=shape.triangledown, location=location.abovebar, size=size.tiny, color=color.white, transp=0)
plotshape(breaklow_source <= break_low, title="Low Breakout", style=shape.triangleup, location=location.belowbar, size=size.tiny, color=color.white, transp=0)
High_Break = breakhigh_source >= break_high
Low_Break = breaklow_source <= break_low

// Conditions
Stop_Momentum = low < ma1

//Strategy Tester

strategy.entry("long", strategy.long, when=(up and (hlc3 < inner_high)))
strategy.close("long", when=down)

strategy.entry("longwickdown", strategy.long, when=Low_Break)
strategy.close("longwickdown", when=(high > ma1))

//true signals test

//var winCount = 0, var loseCount = 0, testBarIndex = 1
//if (up[testBarIndex] and close > close[testBarIndex]) or (down[testBarIndex] and close < close[testBarIndex])
//    label.new(bar_index, 0, "W", yloc = yloc.abovebar, color = color.green)
//    winCount := winCount + 1
//else if (up[testBarIndex] and close < close[testBarIndex]) or (down[testBarIndex] and close > close[testBarIndex])
//    label.new(bar_index, 0, "L", yloc = yloc.abovebar, color = color.red)
//    loseCount := loseCount + 1
//winRate = label.new(time + (time - time[1]) * 2, ohlc4, tostring(round(winCount / (winCount + loseCount) * 100)) + "%", xloc = xloc.bar_time, color = color.orange, style = label.style_label_left)
//if not na(winRate[1])
//    label.delete(winRate[1])