Stratégie de profit à court terme basée sur le modèle RSI V
Date de création:
2024-01-12 13:52:55
Dernière modification:
2024-01-12 13:52:55
Copier:
2
Nombre de clics:
869
1
Suivre
1750
Abonnés
Aperçu
Cette stratégie est basée sur la forme V de l’indicateur RSI, en combinaison avec le filtrage de la ligne moyenne de l’EMA, pour former une stratégie de gain de ligne courte plus fiable. Il peut capturer les opportunités de formation de rebond des prix dans les zones de survente, en faisant plus précisément avec le signal de forme V de l’indicateur RSI, dans le but de réaliser un profit sur la ligne courte.
Principe de stratégie
- L’utilisation de la ligne 20 par rapport à la ligne 50 en tant que ligne longue pour juger
- Le RSI est en forme de V, indiquant une chance de rebond en survente
- Le point le plus bas de la première ligne K est inférieur au point le plus bas des deux lignes K précédentes
- Le RSI de la ligne K est supérieur au RSI des deux lignes K précédentes.
- RSI sur 30 comme un signal de finition en forme de V, faire plus
- Le stop loss est fixé à moins de 8% du prix d’entrée.
- Le RSI passe à 70 et le stop loss se déplace vers le prix d’entrée.
- Le RSI passe à 90 et commence à tzinfo à 3⁄4 de position
- Le RSI passe à 10 / déclenchement de stop loss, tout est à plat
Analyse des avantages
- Utilisez la moyenne EMA pour déterminer la direction de la tendance générale et éviter les opérations de revers
- Le RSI V détermine les opportunités de rebond dans les zones de survente et capture la tendance à la reprise
- Contrôle des risques par les mécanismes de coupe multiples
Analyse des risques
- La baisse du marché pourrait être irréversible et entraîner des pertes importantes
- Les signaux de forme RSI V peuvent être erronés et entraîner des pertes inutiles
Direction d’optimisation
- Optimiser les paramètres du RSI pour trouver une forme plus fiable du RSI V
- Déterminer la fiabilité d’un signal de retournement en combinaison avec d’autres indicateurs
- Optimiser les stratégies de stop-loss, tout en prévenant les plus extrémistes
Résumer
Cette stratégie intègre le filtrage EMA uniforme et le jugement de la forme RSI V, formant un ensemble de stratégies d’opération de courte ligne plus fiable. Elle peut saisir efficacement les opportunités de rebond dans les zones de survente et réaliser des bénéfices sur la courte ligne.
Code source de la stratégie
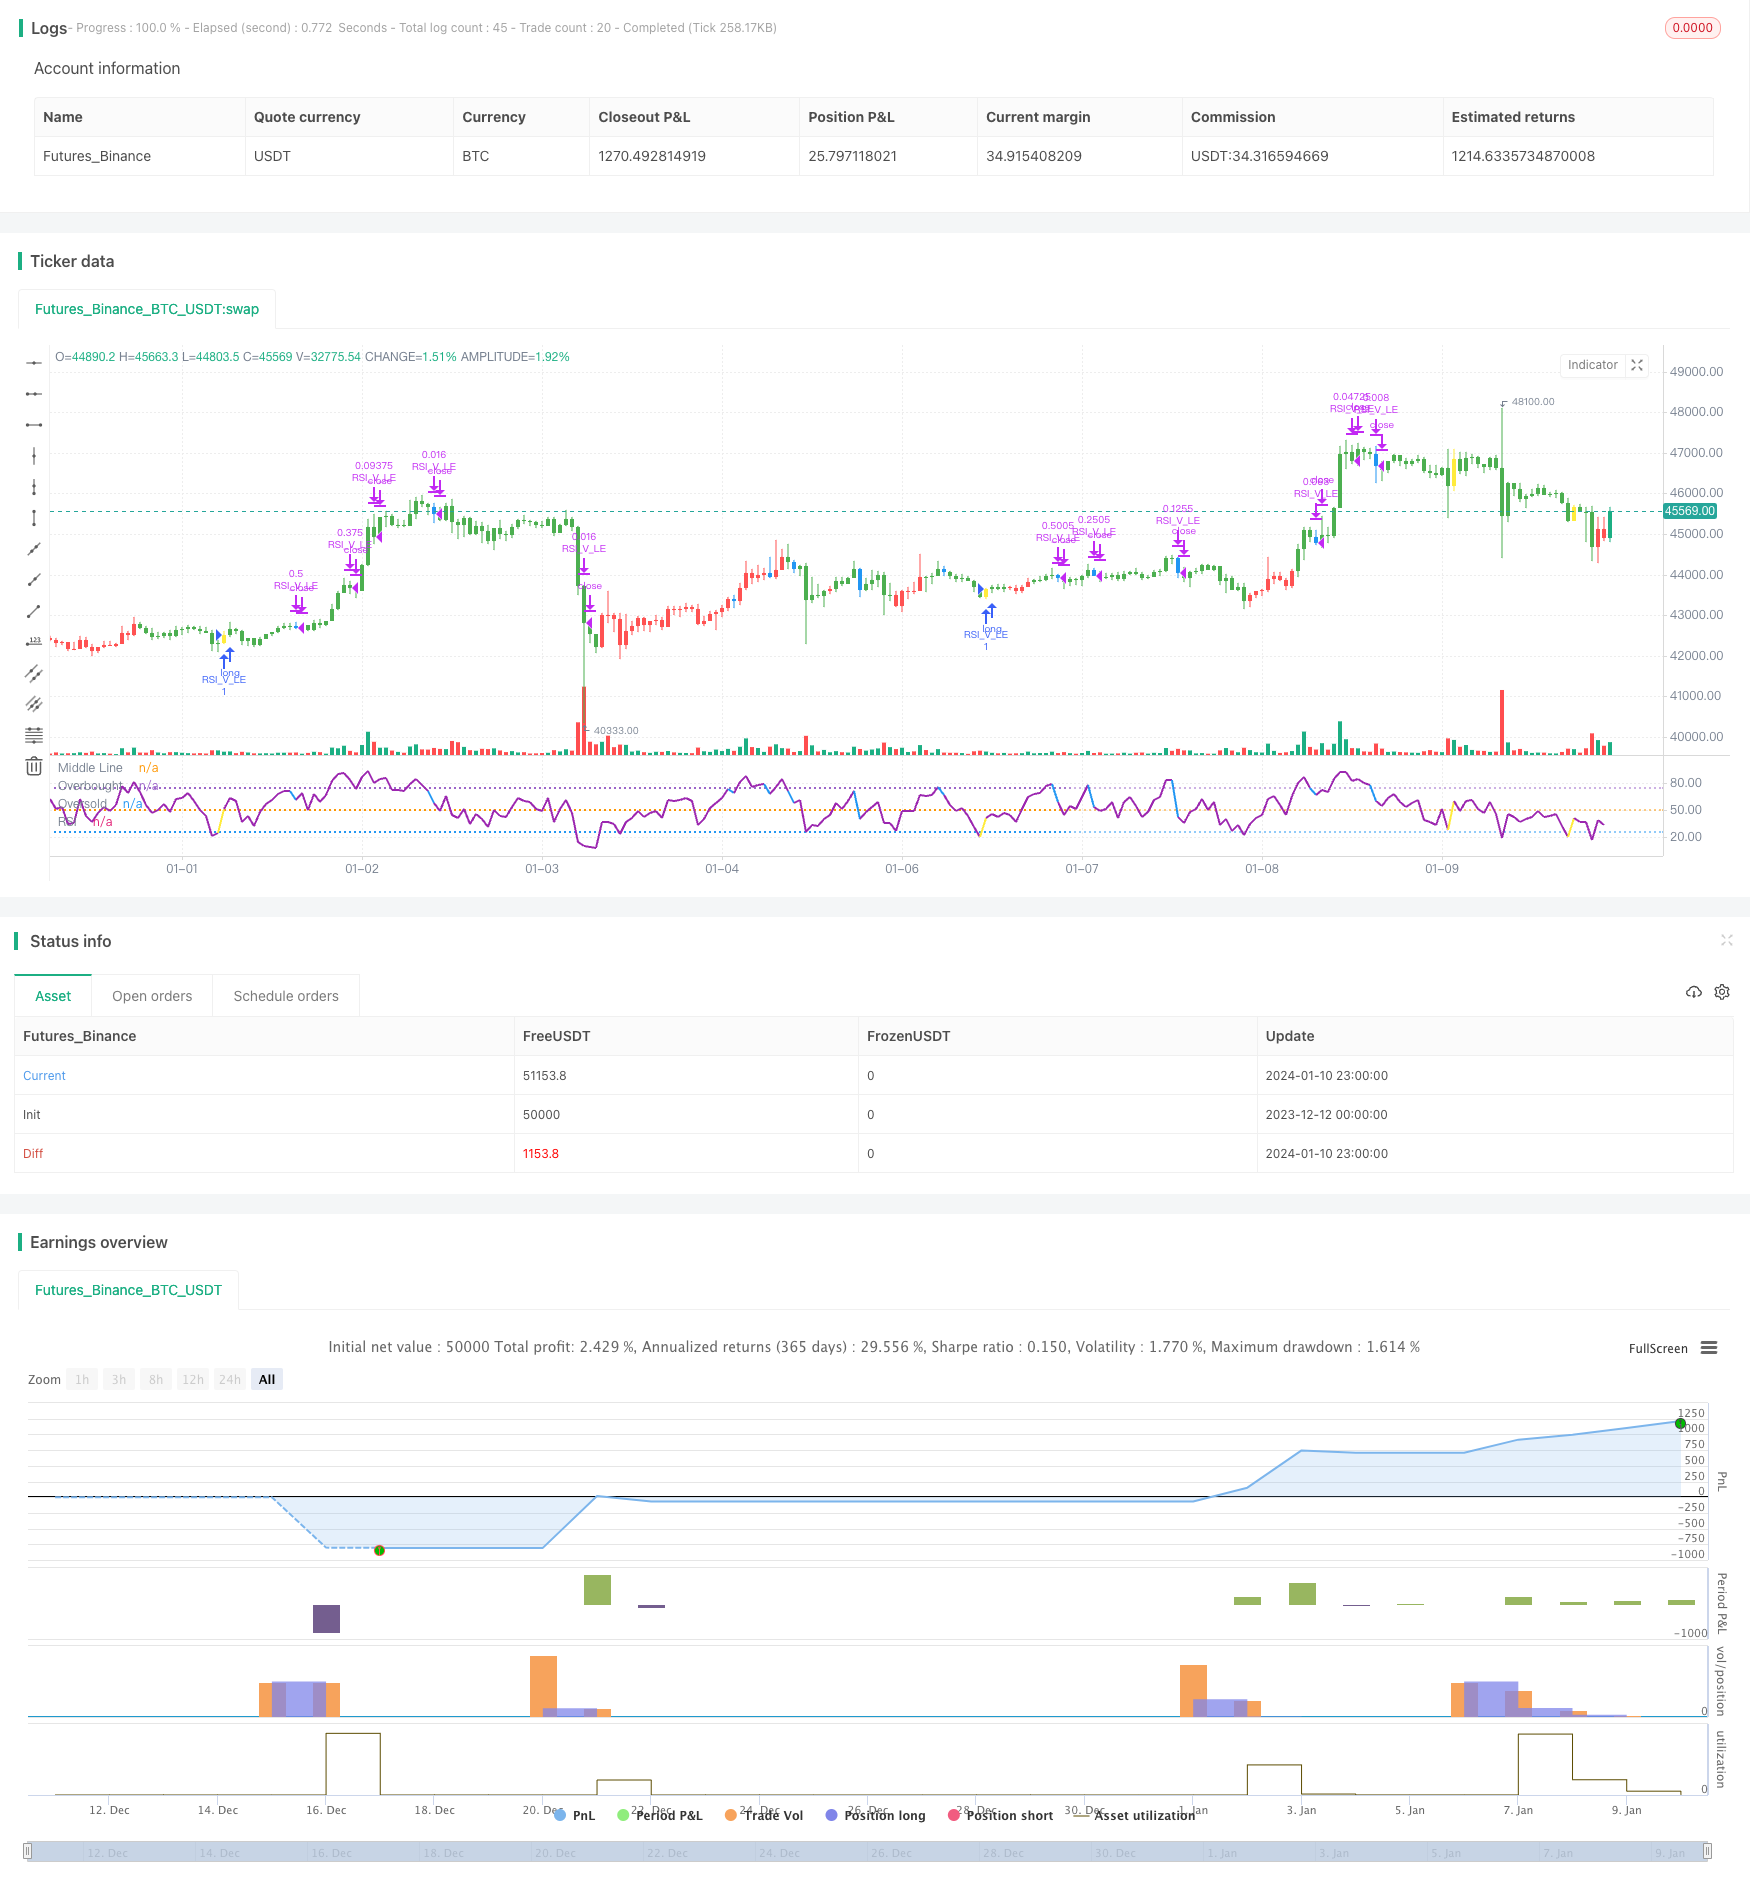
/*backtest
start: 2023-12-12 00:00:00
end: 2024-01-11 00:00:00
period: 1h
basePeriod: 15m
exchanges: [{"eid":"Futures_Binance","currency":"BTC_USDT"}]
*/

// This source code is subject to the terms of the Mozilla Public License 2.0 at https://mozilla.org/MPL/2.0/
// © mohanee

//@version=4
//strategy("RSI V Pattern", overlay=true)
strategy(title="RSI V Pattern", overlay=false )

//Strategy Rules
//ema20 is above ema50  --- candles are colored  green on the chart
//RSI value sharply coming up which makes a V shape ,  colored in yellow on the chart
//RSI V pattern should occur from below 30

len = input(title="RSI Period", minval=1, defval=5)
stopLoss = input(title="Stop Loss %", minval=1, defval=8)

myRsi = rsi(close,len)

longEmaVal=ema(close,50)
shortEmaVal=ema(close,20)

//plot emas
//plot(longEmaVal, title="Long EMA" ,linewidth=2, color=color.orange, trackprice=true)
//plot(shortEmaVal, title="Short EMA" ,linewidth=2, color=color.green, trackprice=true)


longCondition =  ema(close,20)>ema(close,50)   and (low[1]<low[2] and  low[1]<low[3]) and (myRsi>myRsi[1] and myRsi>myRsi[2] ) and crossover(myRsi,30) //  (   and myRsi<60)

//(myRsi<60 and myRsi>30)  and myRsi>myRsi[1] and (myRsi[1]<myRsi[2]  or  myRsi[1]<myRsi[3]) and (myRsi[2]<30)  and (myRsi[3]<30 and myRsi[4]>=30)


barcolor(shortEmaVal>longEmaVal?color.green:color.red)
//longCondition = crossover(sma(close, 14), sma(close, 28))
barcolor(longCondition?color.yellow:na)
strategy.entry("RSI_V_LE", strategy.long, when=longCondition )
//stoploss value at 10%
stopLossValue=strategy.position_avg_price -  (strategy.position_avg_price*stopLoss/100)
//stopLossValue=valuewhen(longCondition,low,3)


//takeprofit at RSI highest  reading
//at RSI75 move the stopLoss to entry price
moveStopLossUp=strategy.position_size>0 and crossunder(myRsi,70)
barcolor(moveStopLossUp?color.blue:na)
stopLossValue:=crossover(myRsi,70) ? strategy.position_avg_price:stopLossValue

//stopLossValue:=moveStopLossUp?strategy.position_avg_price:stopLossValue
rsiPlotColor=longCondition ?color.yellow:color.purple
rsiPlotColor:= moveStopLossUp ?color.blue:rsiPlotColor
plot(myRsi, title="RSI", linewidth=2, color=rsiPlotColor)
//longCondition?color.yellow:#8D1699)
hline(50, title="Middle Line", linestyle=hline.style_dotted)
obLevel = hline(75, title="Overbought", linestyle=hline.style_dotted)
osLevel = hline(25, title="Oversold", linestyle=hline.style_dotted)
fill(obLevel, osLevel, title="Background", color=#9915FF, transp=90)


//when RSI crossing down 70 , close 1/2 position and move stop loss to average entry price
strategy.close("RSI_V_LE",  qty=strategy.position_size*1/2, when=strategy.position_size>0 and crossunder(myRsi,70))

//when RSI reaches high reading 90 and crossing down close 3/4 position
strategy.close("RSI_V_LE",  qty=strategy.position_size*3/4, when=strategy.position_size>0 and crossunder(myRsi,90))


//close everything when Rsi goes down below to 10 or stoploss hit
//just keeping RSI cross below 10 , can work as stop loss , which also keeps you long in the trade ... however sharp declines could  make large loss
//so I combine RSI goes below 10 OR stoploss hit  , whichever comes first - whole posiition closed
longCloseCondition=crossunder(myRsi,10)  or close<stopLossValue
strategy.close("RSI_V_LE", qty=strategy.position_size,when=longCloseCondition )