Stratégie de suivi de super tendance sur plusieurs périodes
Aperçu
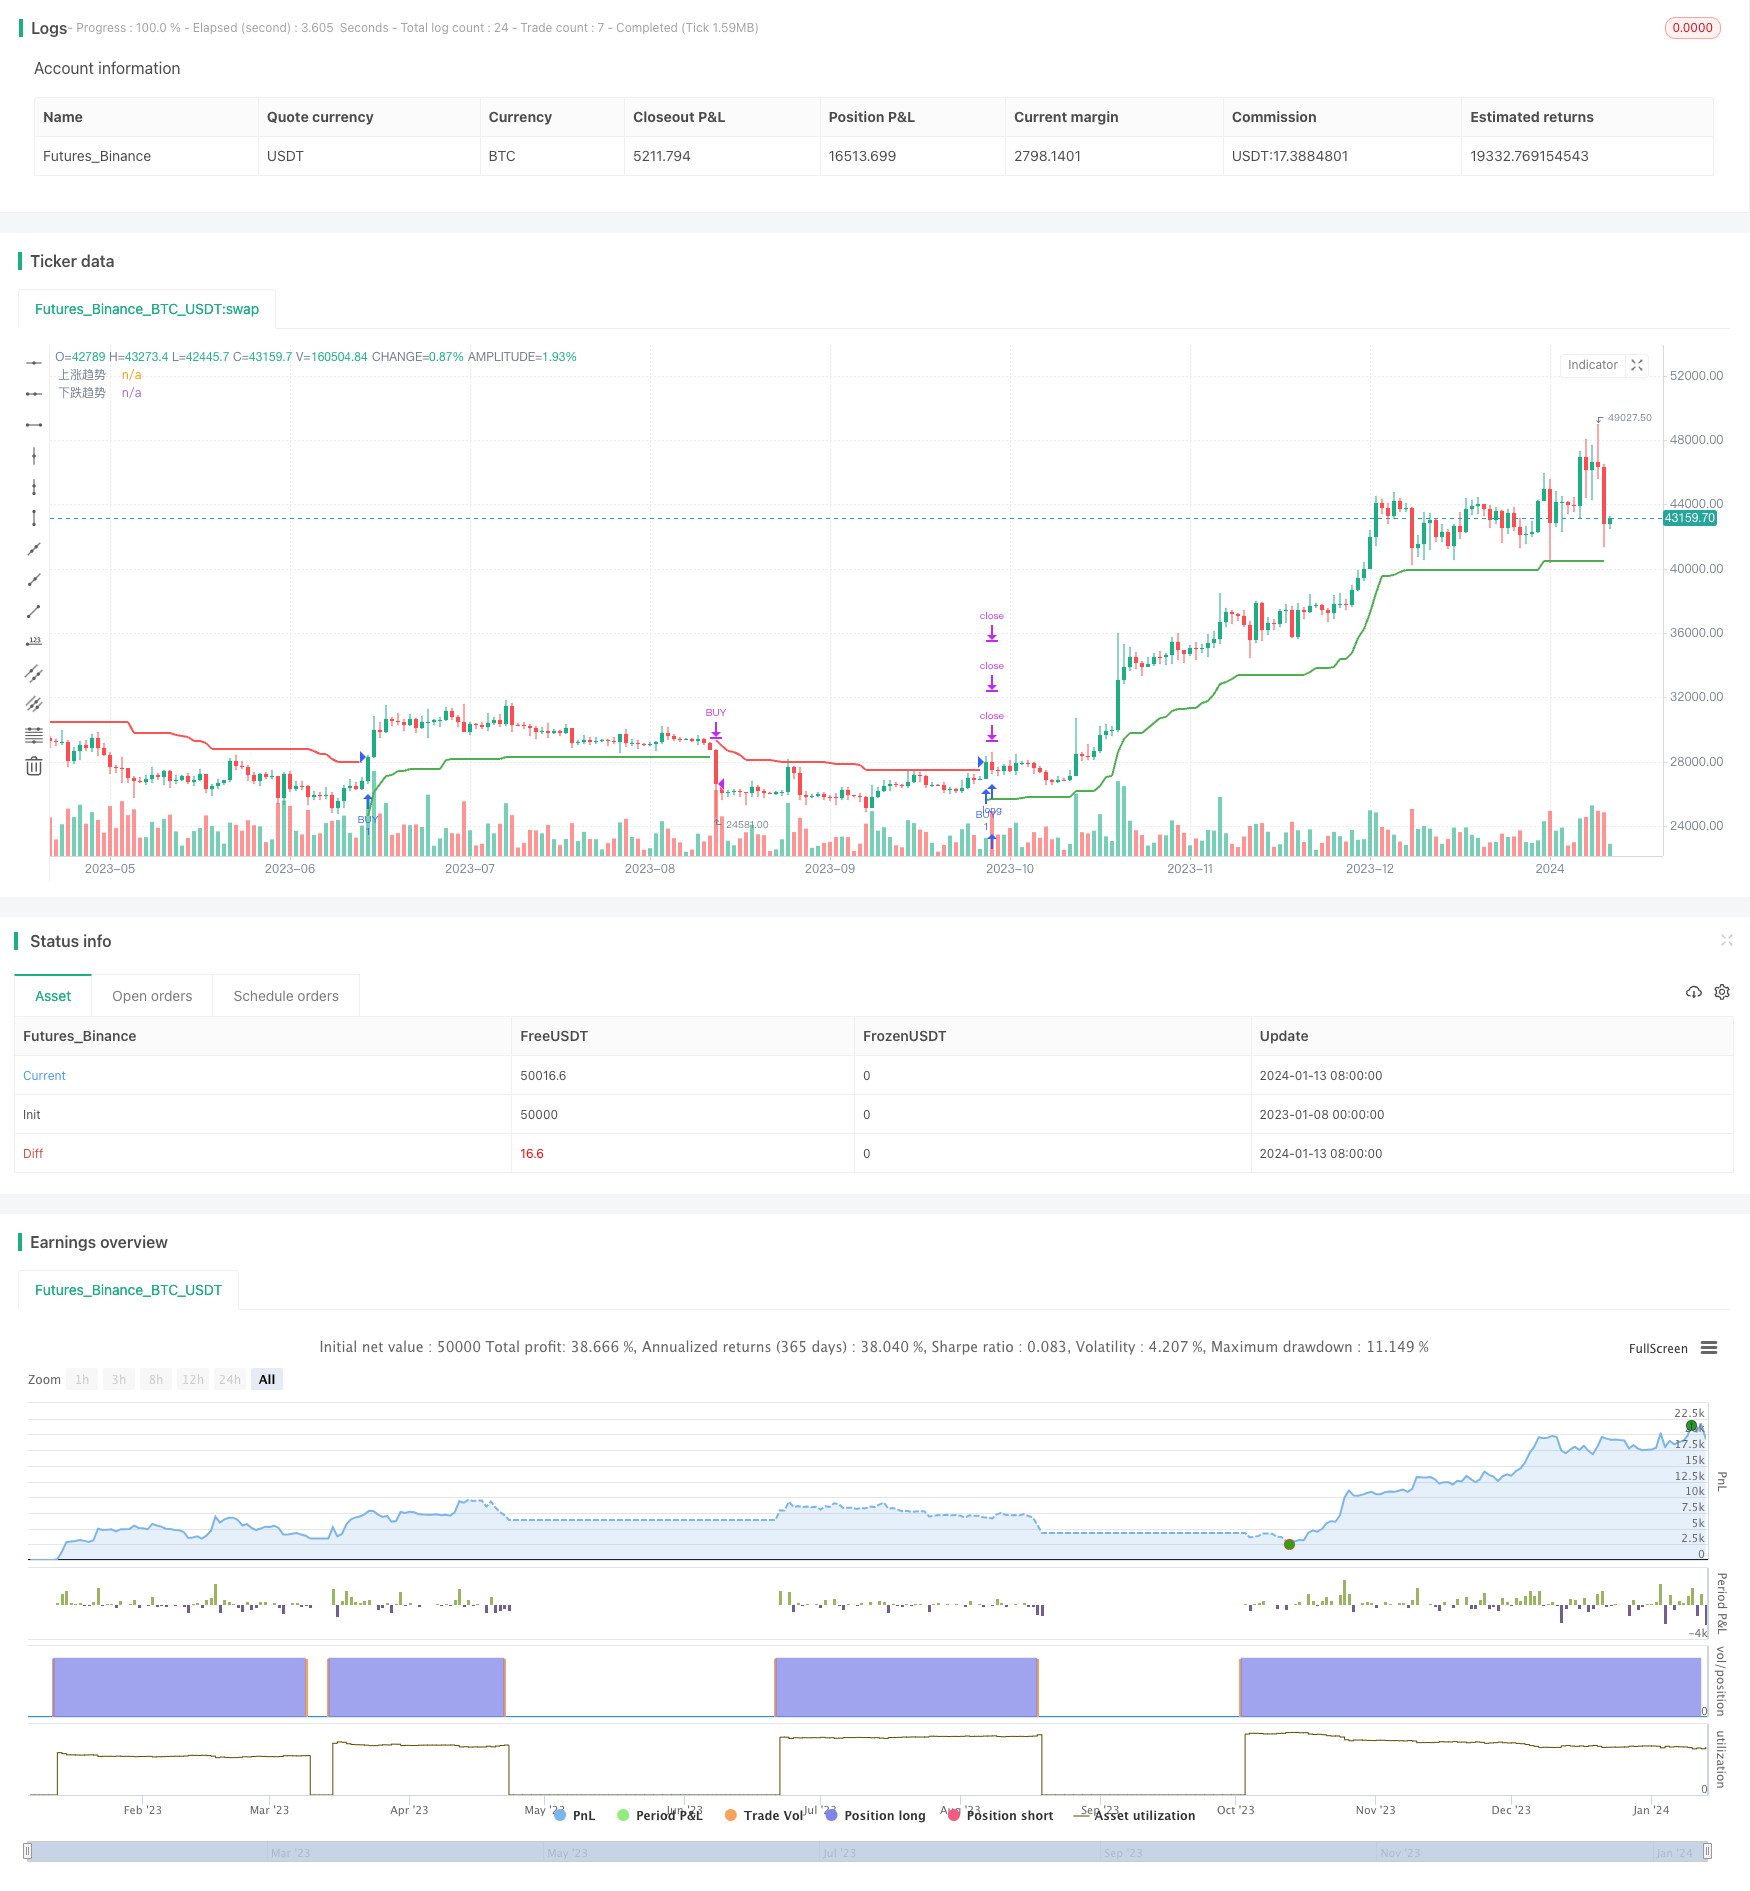
La stratégie est une stratégie qui utilise l’indicateur ATR pour construire un canal de tendance dynamique sur plusieurs périodes afin de permettre le suivi de la tendance. La stratégie génère un signal lorsque le prix franchit le canal et capture une plus grande tendance en ajustant continuellement le canal.
Principe de stratégie
La stratégie utilise l’indicateur ATR pour construire un canal de tendance haussière et un canal de tendance baissière. Plus précisément, la ligne de canal haussière est le prix de clôture moins N fois l’indicateur ATR; la ligne de canal baissière est le prix de clôture plus N fois l’indicateur ATR. La valeur de N peut être ajustée par paramètre.
Lorsque le prix franchit le canal ascendant, un signal d’achat est généré; lorsque le prix franchit le canal descendant, un signal de vente est généré. Le canal s’ajuste en fonction de la dernière dynamique des prix, permettant ainsi un suivi de la tendance.
En outre, la stratégie définit une variable de tendance pour déterminer si la tendance actuelle est à la hausse ou à la baisse. La variable de tendance est utilisée en combinaison avec la ligne de cheminement pour éviter de produire de faux signaux.
Avantages stratégiques
- L’utilisation de canaux dynamiques pour le suivi des tendances
- Le risque d’un renversement est réduit en évitant les hauts et les bas.
- Paramètres de voie réglables et adaptatifs
- Une plus grande flexibilité dans la définition des délais
Risque stratégique
- Le suivi trop radical peut augmenter le risque de pertes
- Paramètres de voie mal réglés, moins de signaux ou plus de signaux erronés
- Il faut une bonne programmation pour ajuster les paramètres.
Comment optimiser:
- Réduire la fréquence des traces en réduisant le nombre d’ATR
- Optimiser les paramètres pour trouver la meilleure combinaison de paramètres
- Augmentation des stratégies de stop loss et réduction des pertes individuelles
Orientation de l’optimisation de la stratégie
- Ajout de filtres sur d’autres indicateurs pour une meilleure fiabilité du signal
- Augmenter les stratégies de prévention des pertes et réduire les risques
- Optimiser les paramètres pour trouver les meilleurs
- Optimiser les heures d’entrée et de sortie pour augmenter les taux de profit
Résumer
Cette stratégie est globalement une bonne stratégie de suivi de tendance. Elle permet de s’ajuster dynamiquement, en fonction de l’évolution, et d’éviter de suivre les hauts et les bas. Par l’optimisation des paramètres et les améliorations appropriées, il est possible d’améliorer encore les avantages de la stratégie, de réduire les risques et ainsi obtenir de meilleurs résultats.
/*backtest
start: 2023-01-08 00:00:00
end: 2024-01-14 00:00:00
period: 1d
basePeriod: 1h
exchanges: [{"eid":"Futures_Binance","currency":"BTC_USDT"}]
*/

//@version=5
strategy('超级趋势精简优化版', overlay=true)
Periods = input(title='ATR周期', defval=10)
src = input(hl2, title='价格数据源')
Multiplier = input.float(title='ATR 乘数', step=0.1, defval=3.0)
changeATR = input(title='更改ATR计算方法', defval=true,tooltip = '默认为art否则sma(ta.tr,ATR周期)')
showsignals = input(title='显示买入/卖出信号', defval=false)
atr2 = ta.sma(ta.tr, Periods)
atr = changeATR ? ta.atr(Periods) : atr2
up = src - Multiplier * atr
up1 = nz(up[1], up)
up := close[1] > up1 ? math.max(up, up1) : up
dn = src + Multiplier * atr
dn1 = nz(dn[1], dn)
dn := close[1] < dn1 ? math.min(dn, dn1) : dn
trend = 1
trend := nz(trend[1], trend)
trend := trend == -1 and close > dn1 ? 1 : trend == 1 and close < up1 ? -1 : trend
upPlot = plot(trend == 1 ? up : na, title='上涨趋势', style=plot.style_linebr, linewidth=2, color=color.new(color.green, 0))
buySignal = trend == 1 and trend[1] == -1
plotshape(buySignal and showsignals ? up : na, title='买点', text='买点', location=location.absolute, style=shape.labelup, size=size.tiny, color=color.new(color.green, 0), textcolor=color.new(color.white, 0))
dnPlot = plot(trend == 1 ? na : dn, title='下跌趋势', style=plot.style_linebr, linewidth=2, color=color.new(color.red, 0))
sellSignal = trend == -1 and trend[1] == 1
plotshape(sellSignal and showsignals ? dn : na, title='卖点', text='卖点', location=location.absolute, style=shape.labeldown, size=size.tiny, color=color.new(color.red, 0), textcolor=color.new(color.white, 0))
FromMonth = input.int(defval=9, title='From Month', minval=1, maxval=12)
FromDay = input.int(defval=1, title='From Day', minval=1, maxval=31)
FromYear = input.int(defval=2018, title='From Year', minval=999)
ToMonth = input.int(defval=1, title='To Month', minval=1, maxval=12)
ToDay = input.int(defval=1, title='To Day', minval=1, maxval=31)
ToYear = input.int(defval=9999, title='To Year', minval=999)
start = timestamp(FromYear, FromMonth, FromDay, 00, 00)
finish = timestamp(ToYear, ToMonth, ToDay, 23, 59)
window() =>
    time >= start and time <= finish ? true : false
longCondition = buySignal
if longCondition and window()
    strategy.entry('BUY', strategy.long, comment = '买入')
shortCondition = sellSignal
if shortCondition and window()
    strategy.close('BUY',comment = '卖出')
buy1 = ta.barssince(buySignal)
sell1 = ta.barssince(sellSignal)
color1 = buy1[1] < sell1[1] ? color.green : buy1[1] > sell1[1] ? color.red : na