Stratégie de tendance momentum ADX

Aperçu
Cette stratégie utilise l'indicateur ADX pour déterminer la tendance du marché, combine l'indicateur DMI pour juger la direction haussière ou baissière, utilise la pente de l'ADX pour évaluer la force de la tendance, définit une valeur clé de l'ADX pour filtrer les marchés non-tendanciels, et s'appuie sur une moyenne mobile pour filtrer les signaux de trading.
Principe de la stratégie
- Calcul des indicateurs ADX, DI+ et DI-.
- Si la pente de l'ADX > 0, cela indique une tendance croissante ; la valeur clé est fixée à 23 pour filtrer les marchés non-tendanciels.
- Si DI+ est supérieur à DI-, cela signifie que la force haussière est supérieure à la force baissière, signal haussier.
- Lorsque le filtre de la moyenne mobile est activé, un signal haussier n'est généré que si le prix de clôture est supérieur à la moyenne mobile.
- Lorsque la pente de l'ADX < 0, la position est fermée, indiquant l'affaiblissement de la tendance.
Analyse des avantages
- L'utilisation du filtre de la moyenne mobile permet de réduire les transactions bruitées sur les marchés non-tendanciels.
- La pente de l'ADX évalue la force, permettant de juger précisément le développement de la tendance.
- La combinaison de la direction jugée par DMI et de la force jugée par l'ADX forme un système de décision de trading de tendance complet.
- Le drawdown et le ratio profit/perte pourraient être meilleurs que ceux d'une stratégie simple basée sur une moyenne mobile.
Analyse des risques
- Différents paramètres de l'indicateur ADX peuvent entraîner des résultats très différents.
- Avant que le DMI n'ait complètement déterminé la direction haussière ou baissière, des signaux erronés peuvent être émis.
- Un certain retard peut réduire l'efficacité de la stratégie.
Pistes d'optimisation
- Optimiser la combinaison des paramètres de l'ADX pour trouver les meilleurs paramètres.
- Ajouter une stratégie de stop-loss pour éviter l'aggravation des pertes individuelles.
- Tenter de combiner d'autres indicateurs pour filtrer les signaux, par exemple RSI, bandes de Bollinger.
Résumé
Cette stratégie exploite pleinement les avantages de l'ADX pour juger la tendance et sa force, combinée à l'indicateur DMI pour déterminer la direction, formant un système complet de suivi de tendance. L'utilisation complémentaire d'une moyenne mobile filtre efficacement le bruit des marchés non-tendanciels. L'optimisation des paramètres et la combinaison d'indicateurs peuvent encore améliorer la stabilité et l'efficacité de la stratégie. Dans l'ensemble, cette stratégie, qui allie jugement de tendance et jugement de direction, est susceptible d'obtenir de bons rendements.
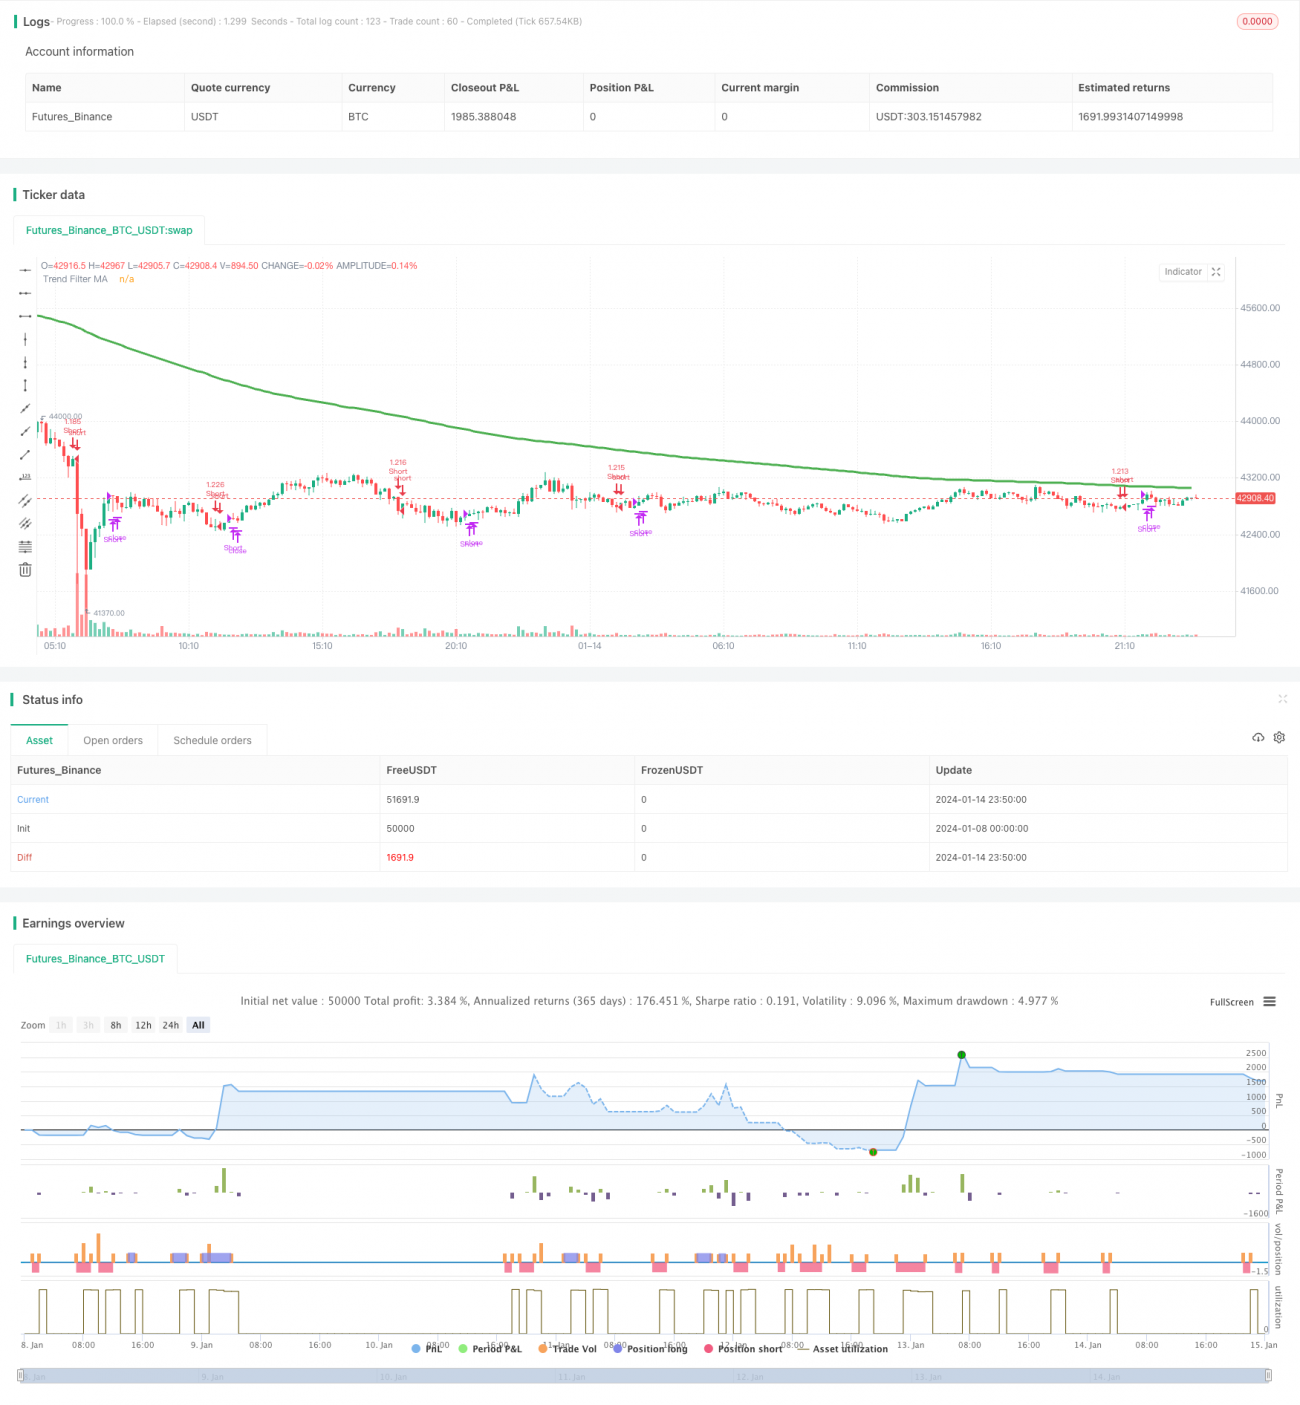
/*backtest
start: 2024-01-08 00:00:00
end: 2024-01-15 00:00:00
period: 10m
basePeriod: 1m
exchanges: [{"eid":"Futures_Binance","currency":"BTC_USDT"}]
*/

//@version=4
// This source code is subject to the terms of the Mozilla Public License 2.0 at https://mozilla.org/MPL/2.0/
// © millerrh with inspiration from @9e52f12edd034d28bdd5544e7ff92e
//The intent behind this study is to look at ADX when it has an increasing slope and is above a user-defined key level (23 default). - 1