Stratégies de trading mixtes
Aperçu
La stratégie de négociation saisonnière mixte du S&P 500 est une stratégie quantitative qui utilise les règles saisonnières pour négocier des actions. Cette stratégie combine un système d’achat et de détention renforcé, des conditions d’indicateurs techniques et des indicateurs de flux de trésorerie, permettant une rotation entre les meilleurs et les pires mois de négociation de l’année.
Principe de stratégie
Les signaux de trading et les règles de la stratégie sont principalement les suivants:
- Chaque année, le premier jour de négociation d’octobre est le jour de l’ouverture de la bourse.
- Lorsque le VIX est supérieur à 60% ou que l’ATR à 15 jours est supérieur à 90%, la saisonnalité est suspendue et l’entrée est autorisée après que les fluctuations du marché se soient apaisées.
- Chaque année, le premier jour de négociation du mois d’août, la position est à zéro.
- Un signal de clôture est également émis lorsque le VIX dépasse 120% ou lorsque l’indicateur de flux de trésorerie VFI est inférieur à 20 et que la moyenne des 10 jours est à la baisse.
- Vous pouvez opter pour la négociation de sous-traitance
La stratégie utilise la régularité de la performance inégale des marchés boursiers au cours d’une année, en faisant plus dans les mois 10-4 les plus performants sur le plan statistique, en s’arrêtant ou en faisant une perte de poids dans les mois 5-9 les moins performants sur le plan historique, pour effectuer des transactions inverses. En même temps, la stratégie ajoute des conditions d’indicateurs techniques, suspendant les transactions en cas de forte volatilité du marché, pour aider à éviter les risques.
Analyse des avantages
Les stratégies de négociation mixtes saisonnières du S&P 500 présentent les avantages suivants:
- Cette stratégie s’appuie sur le fait que l’indice S&P 500 présente des mois de performance nettement différents au cours d’une année.
- La stratégie a ajouté plusieurs conditions de filtrage, telles que VIX, ATR et VFI, pour filtrer efficacement le bruit et émettre un signal de transaction plus fiable.
- Règles de négociation configurables. Les stratégies peuvent être ajoutées en plus ou en moins, et les mois de négociation peuvent être ajustés en fonction des besoins, ce qui facilite le test et l’optimisation.
- Les mécanismes de contournement des risques intégrés, tels que la détection de la volatilité de VIX et ATR, permettent d’éviter efficacement les effets des fortes fluctuations du marché.
- Les indicateurs de flux de trésorerie aident à la prise de décision. Les VFI peuvent refléter les flux de trésorerie des acteurs du marché et fournir une base supplémentaire pour les décisions stratégiques.
Analyse des risques
Il existe également des risques potentiels pour une stratégie de négociation mixte saisonnière du S&P 500:
- Le risque que les lois de l’histoire ne soient pas appliquées. Les marchés boursiers fonctionnent avec une forte incertitude, et les lois de l’histoire ne sont pas toujours valables.
- Les indicateurs techniques peuvent donner de faux signaux. Les indicateurs tels que le VIX, l’ATR et le VFI peuvent également être mal interprétés.
- Les paramètres de stratégie peuvent être testés et optimisés, et les paramètres existants peuvent ne pas être optimaux.
- Le risque supplémentaire d’une opération de prise de position en bourse. Les options de prise de position en bourse comportent un risque de perte illimité.
Il est possible de renforcer les stratégies de gestion des risques, de combinaison des indicateurs, d’ajustement des paramètres et de l’introduction de l’apprentissage automatique pour résoudre ces risques.
Direction d’optimisation
La stratégie de négociation saisonnière mixte de l’S&P 500 peut être optimisée de la manière suivante:
- Test d’entraînement avec des données historiques plus longues. Les paramètres de stratégie peuvent être retestés et optimisés avec plus de données historiques.
- Augmentation du mécanisme d’arrêt des pertes. Il est possible de définir un arrêt flottant ou un arrêt temporel pour contrôler efficacement les pertes individuelles.
- Optimiser les paramètres de l’indicateur technique. Ajuster les paramètres de VIX, ATR et VFI pour trouver la combinaison optimale de paramètres.
- L’introduction de modèles d’apprentissage automatique. Optimisation de l’adaptation des paramètres à l’aide de réseaux neuronaux ou d’arbres de décision.
- Les combinaisons de stratégies peuvent être testées avec d’autres stratégies pour réduire le risque systémique du marché en utilisant la non-corrélation.
Résumer
Le S&P 500 utilise une stratégie de négociation saisonnière mixte intégrée utilisant des règles saisonnières éprouvées, des conditions d’indicateurs techniques et des indicateurs de flux de fonds. La stratégie évite les mois les plus défavorables du marché boursier et est configurée pour les meilleurs mois de négociation de l’année.
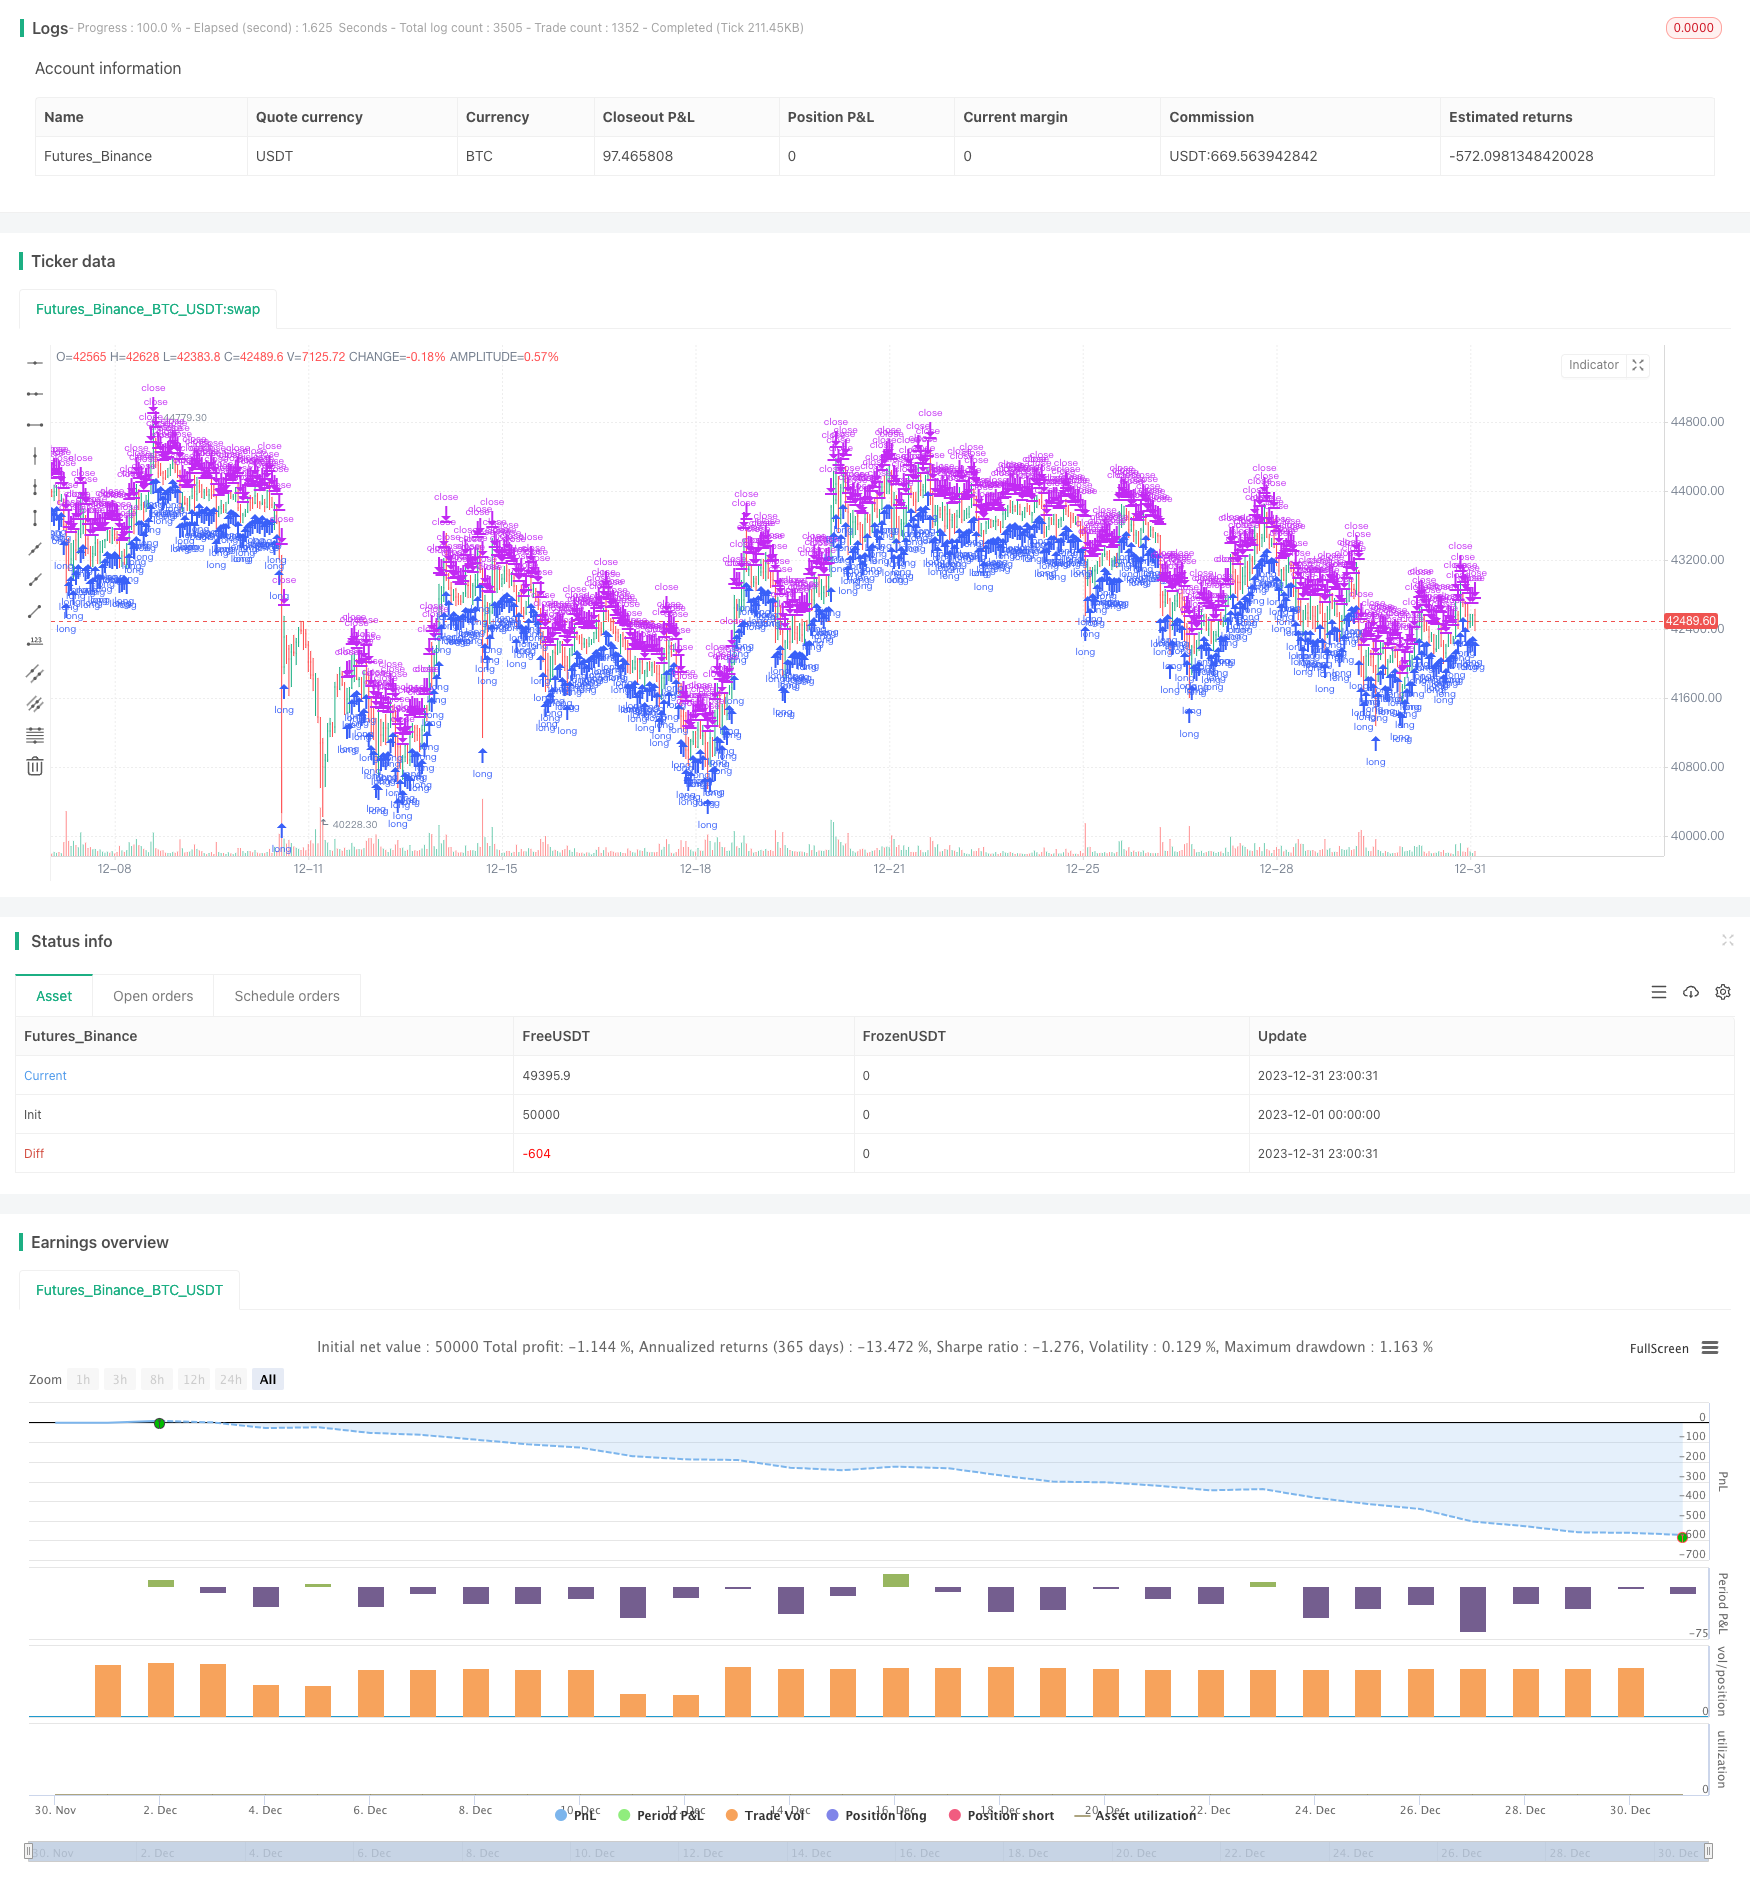
/*backtest
start: 2023-12-01 00:00:00
end: 2023-12-31 23:59:59
period: 1h
basePeriod: 15m
exchanges: [{"eid":"Futures_Binance","currency":"BTC_USDT"}]
*/
// TASC Issue: April 2022 - Vol. 40, Issue 4
// Article: Sell In May? Stock Market Seasonality
// Article By: Markos Katsanos
// Language: TradingView's Pine Script v5
// Provided By: PineCoders, for tradingview.com
//@version=5
strategy(title = "TASC 2022.04 S&P500 Hybrid Seasonal System",
shorttitle = "HSS v2.0",
overlay = true,
default_qty_type = strategy.percent_of_equity,
default_qty_value = 10,
initial_capital = 100000,
currency = currency.USD,
commission_type = strategy.commission.percent,
commission_value = 0.01
)
// Helper Functions:
// @function Returns the ratio to max/min of a sample period
// @param src float, data source.
// @param length int, period of the sample.
// @returns [float, float] tuple.
volatility (float src, int length) =>
[(src / ta.highest(src, length)[1] - 1.0) * 100.0,
(src / ta.lowest (src, length)[1] - 1.0) * 100.0]
// @function Volume Flow Indicator.
// @param Period int, period of the data sample.
// @param VCoef float, Volume Volatility Coefficient.
// @param Coef float, Cutoff Coefficient.
// @returns float.
// ref: https://mkatsanos.com/volume-flow-vfi-indicator/
vfi (int Period = 130, float VCoef = 2.5, float Coef = 0.2) =>
lastHLC3 = nz(hlc3[1], hlc3)
MF = hlc3 - lastHLC3
Vinter = ta.stdev(math.log(hlc3) - math.log(lastHLC3), 30)
Vave = ta.sma(volume, Period)[1]
Cutoff = Coef * close * Vinter
VC = math.min(volume, Vave * VCoef)
VCP = MF > Cutoff ? VC :
MF < -Cutoff ? -VC : 0.0
VFI1 = nz(math.sum(VCP, Period) / Vave)
VFI = ta.ema(VFI1, 3)
// inputs:
// optional strategy obserservation window parameters:
string ig_ow = 'Observation Window:'
bool i_Sdate = input( title = 'Start date:',
defval = timestamp('2021-01-01'),
inline = 'Sdate',
group = ig_ow
) < time //
bool i_useSdate = input.bool( title = '',
defval = false,
group = ig_ow,
inline = 'Sdate',
tooltip = 'Optional start date to clamp strategy observation window.'
) //
bool i_Edate = input( title = 'End date:',
defval = timestamp('2022-01-01'),
inline = 'Edate',
group = ig_ow
) > time //
bool i_useEdate = input.bool( title = '',
defval = false,
group = ig_ow,
inline = 'Edate',
tooltip = 'Optional end date to clamp strategy observation window.'
) //
//
string ig_ro = 'Lookback Options:'
int i_lback = input.int( title = 'Lookback Shift:',
defval = 0, minval = 0,
group = ig_ro,
tooltip = 'Optional, inspect previous signal values.'
) //
//
string ig_so = 'Signal Options:'
bool i_onlyL = input.bool( title = 'Long Only:',
defval = true,
group = ig_so,
tooltip = 'If switched off, short entries are initiated by sell signals.'
) //
int i_sMonth = input.int( title = 'Sell Month:',
defval = 8, minval = 1, maxval = 12, step = 1,
group = ig_so,
tooltip = 'The worst performing month, originally clamped between months 5 and 8.'
) //
int i_maxVI = input.int( title = 'Max VIX up:',
defval = 60, minval = 50, maxval = 60, step = 5,
group = ig_so,
tooltip = 'Volatility maximum threshold.'
) //
int i_critVFI = input.int( title = 'Critical VFI Sell:',
defval = -20, minval = -20, maxval = -15, step = 5,
group = ig_so,
tooltip = 'Critical money float (VFI) threshold for sell signal.'
) //
float i_K = input.float( title = 'ATR/VIX Ratio:',
defval = 1.5, minval = 1.3, maxval = 1.7, step = 0.2,
group = ig_so,
tooltip = 'ATR to VIX ratio for sell signal.'
) //
//
string i_VIticker = input( title = 'Volatility Index:',
defval = 'VIX',
group = ig_so,
tooltip = 'Volatility Index Ticker.'
) //
string i_VItf = input.timeframe( title = '',
defval = 'D',
group = ig_so,
tooltip = 'Volatility Index Timeframe.'
) //
int i_VIiperiod = input.int( title = 'Implied Volatility period:',
defval = 25,
group = ig_so
) //
int i_VIhperiod = input.int( title = 'Historical Volatility period:',
defval = 15,
group = ig_so
) //
//
int i_VFIperiod = input.int( title = 'VFI period:',
defval = 130,
group = ig_so, inline = 'VFI1'
) //
int i_VFIMperiod = input.int( title = 'MA:',
defval = 10,
group = ig_so, inline = 'VFI1',
tooltip = 'VFI and Moving Average sampling period.'
) //
float i_VFIcoef = input.float( title = 'VFI Coef Cuttoff:',
defval = 0.2,
group = ig_so, inline = 'VFI2'
) //
float i_VFIvcoef = input.float( title = 'Volat.:',
defval = 2.5,
group = ig_so, inline = 'VFI2',
tooltip = 'VFI Cutoff and Volatility coefficient.'
) //
int i_ATRperiod = input.int( title = 'ATR length:',
defval = 15,
group = ig_so, inline = 'ATR',
tooltip = 'ATR length.'
) //
//
string ig_to = 'Table Options:'
bool i_showT = input.bool( title = 'Show Table:',
defval = false,
group = ig_to,
tooltip = 'Optional toggle.'
) //
string i_Tpos = input.string(title = 'Position:',
defval = position.middle_right,
options = [ position.top_left, position.top_center, position.top_right,
position.middle_left, position.middle_center, position.middle_right,
position.bottom_left, position.bottom_center, position.bottom_right ],
group = ig_to) //
int i_Ttransp = input.int( title = 'Transparency:',
defval = 0, minval = 1, maxval = 99,
group = ig_to
) //
//
color i_Tcframe = input.color( title = 'Table Colors:',
defval = #000000,
group = ig_to, inline = 'table color'
) //
color i_Tcrowe = input.color( title = '',
defval = #d6dae3,
group = ig_to, inline = 'table color'
) //
color i_Tcrowo = input.color( title = '',
defval = #cccccc,
group = ig_to, inline = 'table color',
tooltip = 'Table background colors, in order: frame, even row, odd row.'
) //
string i_Ttsize = input.string(title = 'Table Text:',
defval = size.small,
options = [size.auto, size.huge, size.large, size.normal, size.small, size.tiny],
group = ig_to, inline = 'table text'
) //
color i_Tcdeft = input.color( title = 'Text Colors:',
defval = #000000,
group = ig_to, inline = 'table text'
) //
color i_Tcsigt = input.color( title = '',
defval = color.red,
group = ig_to, inline = 'table text'
) //
color i_Tctitt = input.color( title = '',
defval = color.navy,
group = ig_to, inline = 'table text',
tooltip = 'Table text size and colors, in order: default, short signal, title.'
) //
// Comparison Index
float VIX = request.security(i_VIticker, i_VItf, close)
[VIdn, VIup] = volatility(VIX, i_VIiperiod) // Implied
[ATRdn, ATRup] = volatility(ta.atr(i_VIhperiod), i_VIiperiod) // Historical
float VFI = vfi(i_VFIperiod, i_VFIvcoef, i_VFIcoef)
float VFI10 = ta.sma(VFI, i_VFIMperiod)
//
bool VFIatCrit = VFI > i_critVFI
bool lowVolat = (VIup < i_maxVI) or (ATRup < (i_K * i_maxVI))
bool VolatC = VFIatCrit ? lowVolat : false
bool Long = ((month >= 10) or (month < i_sMonth)) and VolatC[1]
bool Sseasonal = month == i_sMonth // SEASONAL EXIT/SHORT
bool Svol = VIup > (2.0 * i_maxVI) // VOLATILITY EXIT/SHORT
bool Scrit = ta.cross(i_critVFI, VFI) and (VFI10 < VFI10[1]) // VFI EXIT/SHORT
bool Short = Sseasonal or Svol[1] or Scrit[1]
bool withinObsWindow = true
//
if withinObsWindow and strategy.equity > 0
_L = strategy.long
_S = strategy.short
strategy.entry('L' , direction = _L, when = Long )
if i_onlyL
strategy.close('L', comment = 'EXIT SEASONAL' , when = Sseasonal )
strategy.close('L', comment = 'EXIT VOLATILITY', when = Svol[1] )
strategy.close('L', comment = 'EXIT MF' , when = Scrit[1] )
else
strategy.entry('S Seasonal' , direction = _S, when = Sseasonal )
strategy.entry('S Volatility', direction = _S, when = Svol[1] )
strategy.entry('S MF Crit.' , direction = _S, when = Scrit[1] )
else
strategy.close_all()
string SIGNAL = switch
(Long) => 'Long Seasonal'
(Sseasonal and i_onlyL) => 'Exit Seasonal'
(Svol[1] and i_onlyL) => 'Exit Volatility'
(Scrit[1] and i_onlyL) => 'Exit Money Flow'
(Sseasonal and not i_onlyL) => 'Short Seasonal'
(Svol[1] and not i_onlyL) => 'Short Volatility'
(Scrit[1] and not i_onlyL) => 'Short Money Flow Bearish'
=> 'none'
string date = str.format(
'{0,number,0000}-{1,number,00}-{2,number,00}',
year, month, dayofmonth
)
var table dTable = table.new(position = i_Tpos,
columns = 2,
rows = 17,
frame_color = color.new(#000000, i_Ttransp),
frame_width = 4
) //
// @function Helper to populate the table rows.
tRow(tableId, idx, left, right, tcol=0) =>
color _bg = color.new(idx % 2 ? i_Tcrowo : i_Tcrowe, i_Ttransp)
color _tx = switch (tcol)
(1) => color.new(i_Tcsigt, i_Ttransp)
(2) => color.new(i_Tctitt, i_Ttransp)
=> color.new(i_Tcdeft, i_Ttransp)
// table.cell( table_id=tableId,
// column=0, row=idx,
// text=left, text_color=_tx, text_halign=text.align_right, text_size=i_Ttsize,
// bgcolor=_bg) //
// table.cell( table_id=tableId,
// column=1, row=idx,
// text=str.tostring(right), text_color=_tx, text_halign=text.align_left, text_size=i_Ttsize,
// bgcolor=_bg) //
if i_showT
float _atr10 = ta.atr(10)[i_lback]
string _nf = '0.00'
string _aru = '🔼 ', string _ard = '🔽 '
// id | idx | left label | right label | conditional color |
tRow(dTable, 00, 'S&P500 Hybrid Seasonal ' , '' , 2 )
tRow(dTable, 01, 'Created By: Markos Katsanos' , '' , 2 )
tRow(dTable, 02, 'Date:' , date[i_lback] )
tRow(dTable, 03, 'Signal:' , SIGNAL[i_lback] )
tRow(dTable, 04, 'Price:' , open[i_lback] )
tRow(dTable, 05, 'VIX:' , str.tostring( VIX[i_lback], _nf) )
tRow(dTable, 06, 'VFI:' , str.tostring( VFI[i_lback], _nf) , VFIatCrit ? 1 : 0 )
tRow(dTable, 07, 'ATR:' , str.tostring( _atr10, _nf) )
tRow(dTable, 08, 'VIup%:' , str.tostring( VIup[i_lback], _nf) , VIup > i_maxVI ? 1 : 0 )
tRow(dTable, 09, 'ATRup%:' , str.tostring(ATRup[i_lback], _nf) , ATRup > i_K * i_maxVI ? 1 : 0 )
tRow(dTable, 10, 'VIdn%:' , str.tostring( VIdn[i_lback], _nf) )
tRow(dTable, 11, 'ATRdn%:' , str.tostring(ATRdn[i_lback], _nf) )
tRow(dTable, 12, _aru + 'Long Seasonal:' , Long[i_lback] )
tmp = 12
if not i_onlyL
tmp := 13
tRow(dTable, 13, _ard + 'Short:' , Short[i_lback] , Short[i_lback] ? 1 : 0 )
tRow(dTable, tmp+1, _ard + 'Seasonal:' , Sseasonal[i_lback] , Sseasonal[i_lback] ? 1 : 0 )
tRow(dTable, tmp+2, _ard + 'Volatility:' , Svol[1+i_lback] , Svol[1 + i_lback] ? 1 : 0 )
tRow(dTable, tmp+3, _ard + 'Money Flow:' , Scrit[i_lback] , Scrit[i_lback] ? 1 : 0 )