Stratégie de croisement entre l'indicateur de momentum et l'indice de peur
Date de création:
2024-01-23 14:27:23
Dernière modification:
2024-01-23 14:27:23
Copier:
3
Nombre de clics:
665
1
Suivre
1750
Abonnés
Aperçu
Cette stratégie permet de juger de l’évolution du marché en calculant la croisée des indicateurs de dynamique et des indicateurs de panique, et d’émettre un signal de vente lorsque les deux indicateurs se croisent de manière spécifique, afin de capturer une tendance à la baisse.
Principe de stratégie
- Calculer l’indicateur de dynamique de 50 cycles. Il indique la variation du prix par rapport à la période précédant les 50 cycles.
- Calculer la correction de l’indice de panique sur 22 cycles. Il représente l’humeur panique du marché par le rapport entre le prix le plus élevé et le prix le plus bas.
- Lorsque l’indicateur de dynamique dépasse l’indice de panique, cela indique que le marché est sous pression.
- Si l’indicateur de dynamique continue à descendre dans la zone de danger (entre -5 et 5), un fort signal de vente est émis.
Analyse des avantages
- L’indice de panique, un indicateur de l’humeur des traders, permet de juger efficacement les changements structurels du marché.
- L’indicateur de dynamique permet de juger de la vitesse et de l’intensité des variations de prix et aide à juger de la variation des tendances du marché.
- La combinaison de deux types d’indicateurs permet d’améliorer la précision de l’identification des événements soudains.
- Il est possible d’adapter les paramètres de manière flexible aux différents environnements de marché.
Analyse des risques
- Le croisement de l’indice de panique et de l’indice de dynamisme ne garantit pas une baisse significative à chaque fois. La décision finale doit être déterminée par la combinaison d’autres indicateurs.
- Il n’y a pas de stop-loss après la vente et les pertes ne peuvent pas être contrôlées efficacement.
- La reprise et la réentrée ne sont pas prises en compte. La stratégie ne sert qu’à capturer des baisses soudaines.
Direction d’optimisation
- Il est possible de mettre en place un stop loss après avoir vendu, afin de contrôler les pertes.
- Augmentation d’autres indicateurs de jugement pour améliorer la fiabilité du signal, tels que le volume de transactions, les lignes de Brin et autres.
- L’ajout de signaux de reprise permet à la stratégie de fonctionner sur un cycle complet.
- Optimiser les paramètres pour trouver la meilleure combinaison de paramètres.
Résumer
Cette stratégie lance des avertissements de baisse de marché par le croisement d’indicateurs de dynamique et d’indicateurs de panique. Elle peut capturer efficacement les baisses soudaines du marché. Cependant, la stratégie ne convient qu’aux applications de courte durée, sans mécanisme d’exit et de contrôle du risque.
Code source de la stratégie
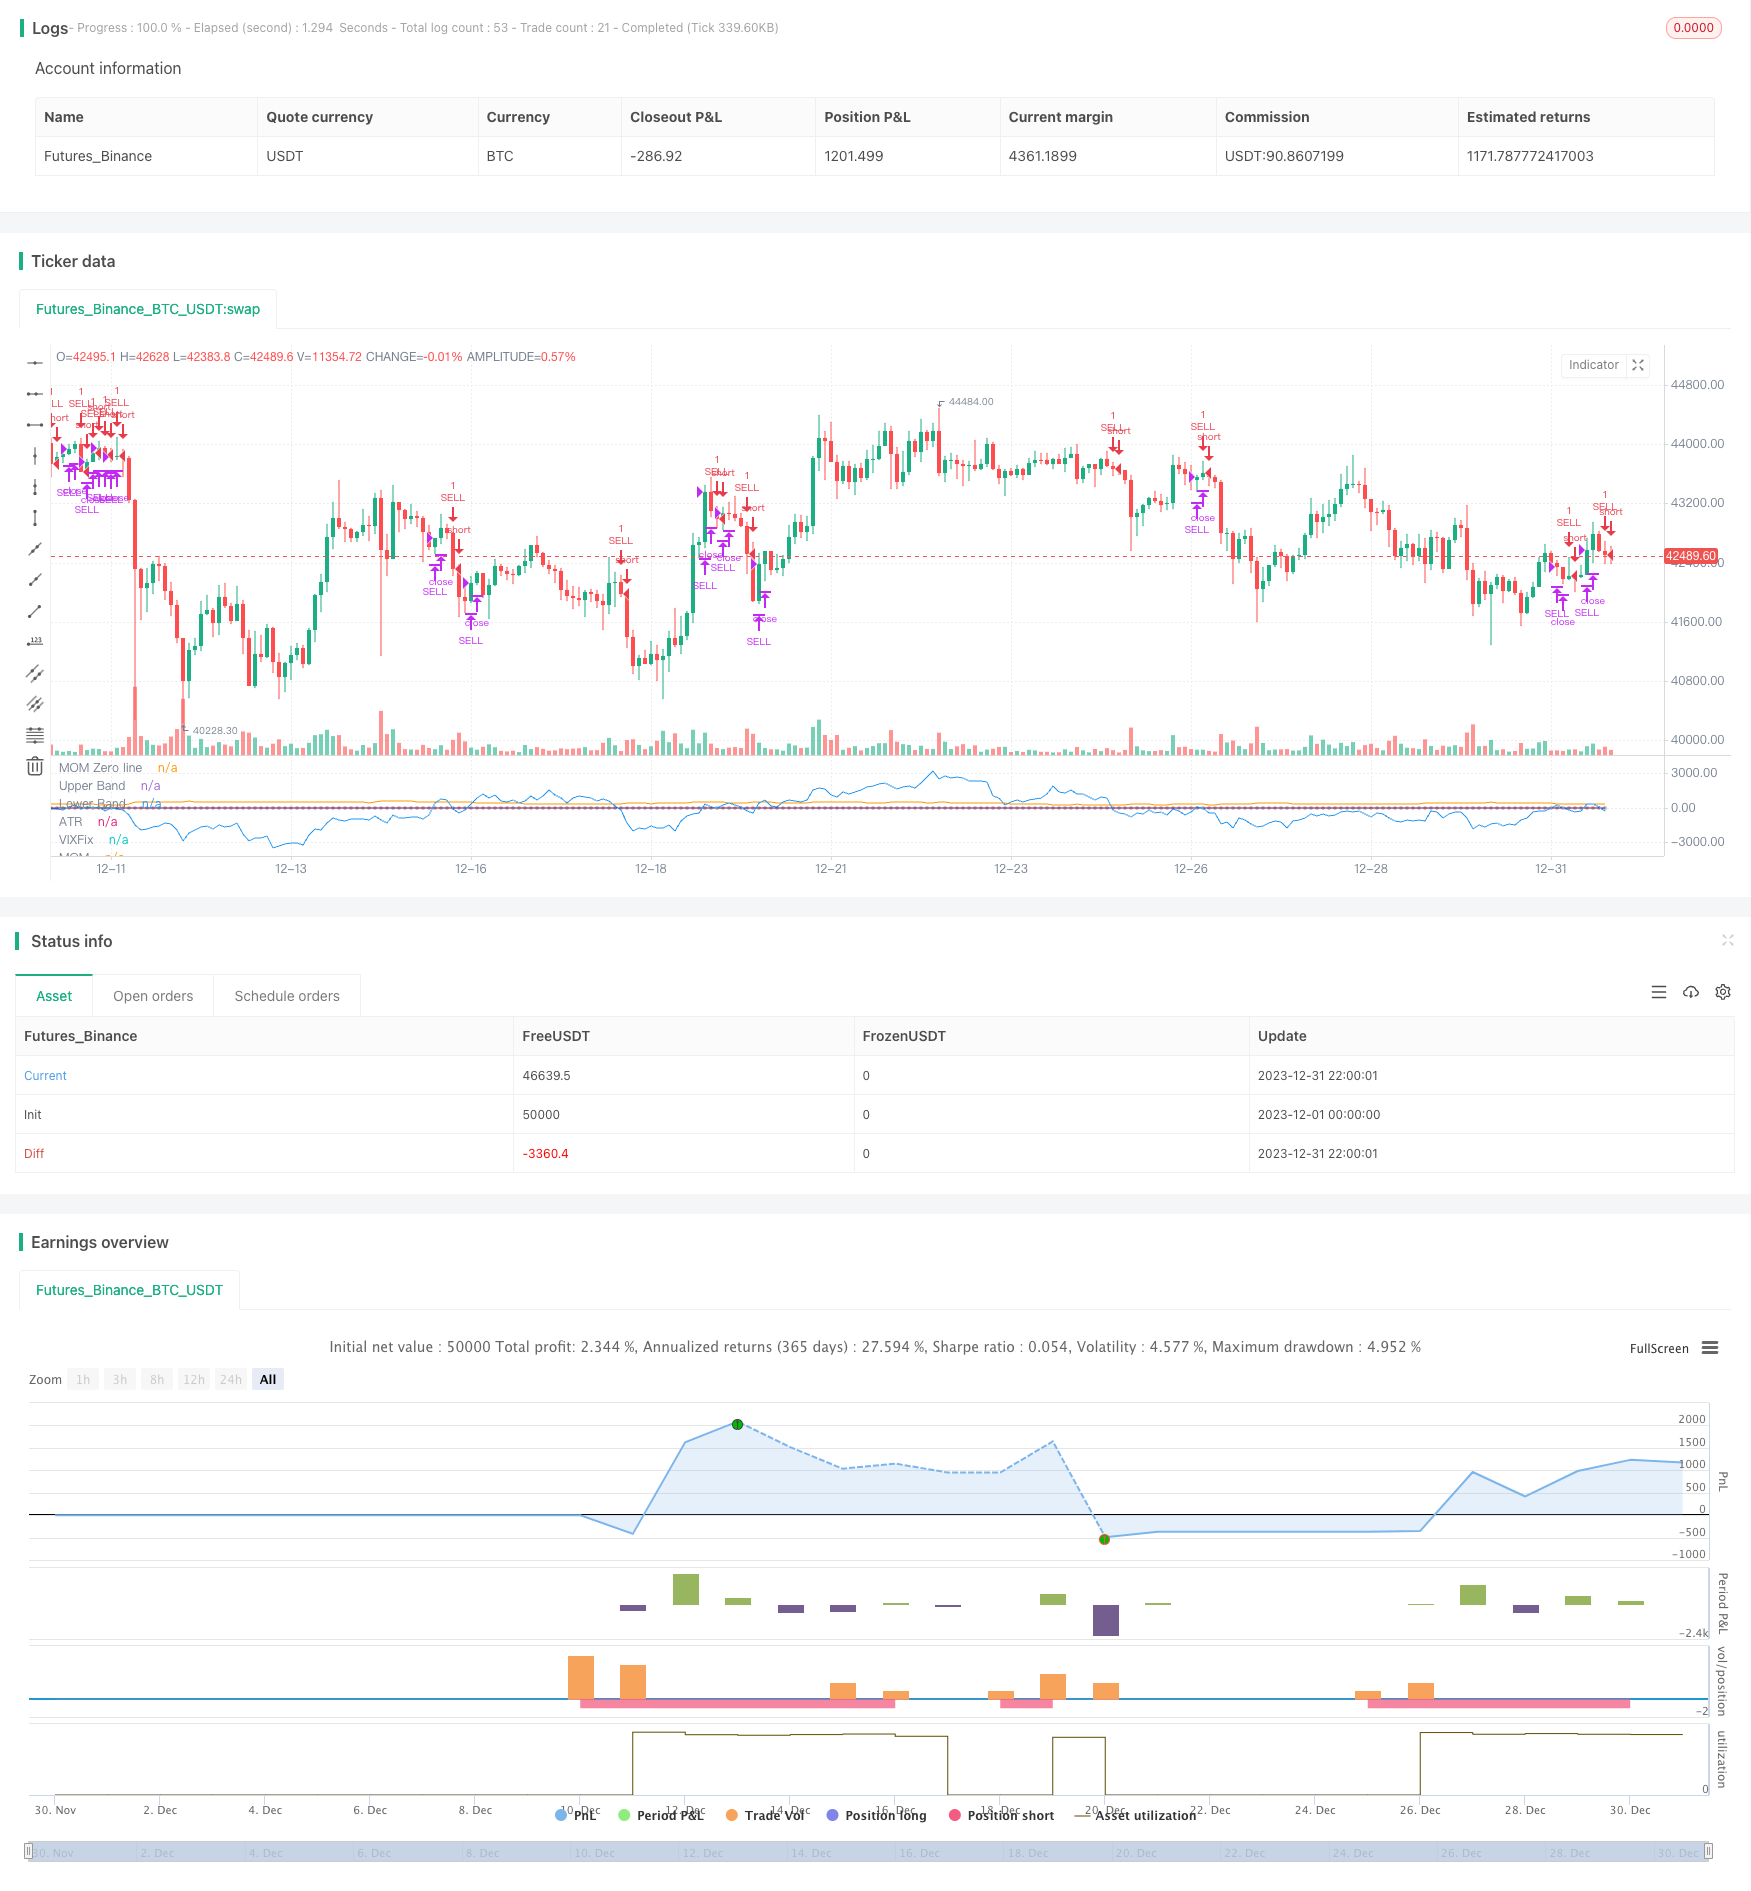
/*backtest
start: 2023-12-01 00:00:00
end: 2023-12-31 23:59:59
period: 2h
basePeriod: 15m
exchanges: [{"eid":"Futures_Binance","currency":"BTC_USDT"}]
*/

// This source code is subject to the terms of the Mozilla Public License 2.0 at https://mozilla.org/MPL/2.0/
// © gary_trades

//THIS SCRIPT HAS BEEN BUIL TO BE USED AS A S&P500 SPY CRASH INDICATOR (should not be used as a strategy).
//THIS SCRIPT HAS BEEN BUILT AS A STRATEGY FOR VISUALIZATION PURPOSES ONLY AND HAS NOT BEEN OPTIMISED FOR PROFIT.
//The script has been built to show as a lower indicator and also gives visual SELL signal on top when conditions are met. BARE IN MIND NO STOP LOSS, NOR ADVANCED EXIT STRATEGY HAS BEEN BUILT.
//As well as the chart SELL signal an alert has also been built into this script.
//The script utilizes a VIX indicator (marron line) and 50 period Momentum (blue line) and Danger/No trade zone(pink shading).
//When the Momentum line crosses down across the VIX this is a sell off but in order to only signal major sell offs the SELL signal only triggers if the momentum continues down through the danger zone.
//To use this indicator to identify ideal buying then you should only buy when Momentum line is crossed above the VIX and the Momentum line is above the Danger Zone.
//This is best used as a daily time frame indicator

//@version=4
strategy(title="S&P Bear Warning", shorttitle="Bear Warning" )

//Momentum
len = input(50, minval=1, title="Length")
src = input(close, title="Source")
bandUpper = input( 5)
bandLower = input(-5)
// ————— Control plotting of each signal. You could use the same technique to be able to turn acc/dist on/off.
showVixFix = input(true)
showMomentum = input(true)

mom = src - src[len]
myAtr = atr(14)
plot(showMomentum ? mom : na, color=color.blue, title="MOM")
plot(showMomentum ? 0 : na, color=color.silver, title="MOM Zero line", style=plot.style_circles, transp=100)
plot(showMomentum ? myAtr : na, color=color.orange, title="ATR", transp=90)

//VIX
VIXFixLength = input(22,title="VIX Fix Length")
VIXFix = (highest(close,VIXFixLength)-low)/(highest(close,VIXFixLength))*100
plot(showVixFix ? VIXFix : na, "VIXFix", color=color.maroon)

band1 = plot(showVixFix ? bandUpper : na, "Upper Band", color.red, 1, plot.style_line, transp=90)
band0 = plot(showVixFix ? bandLower : na, "Lower Band", color.red, 1, plot.style_line, transp=90)
fill(band1, band0, color=color.red, transp=85, title="Background")

//Identify Triggers
//Back Test Range
start = timestamp("America/New_York", 2000, 1, 1, 9,30)
end   = timestamp("America/New_York", 2020, 7, 1, 0, 0)

//Momentum
Long1 = mom > bandUpper
Short1 = mom < bandLower

//VIX
Long2  = crossover(mom, VIXFix)
Short2 = crossunder(mom, VIXFix)

//Warning Alert
SellAlert = Short1
alertcondition(SellAlert, title="Sell SPY", message="Warning Selling off {{ticker}}, price= {{close}}")

//Entry and Exit
if true
    strategy.entry("SELL", false, when = Short1)

strategy.close("SELL", when = Long2)