La stratégie de l'indicateur Murphy qui voyage dans le temps et l'espace
Aperçu
Il s’agit d’une simple stratégie de quantification des énormes volumes de requins dans le marché, utilisant l’indicateur Morpheus. Elle s’applique sur une période de 5 minutes et est principalement utilisée pour les transactions en crypto-monnaie.
Principe de stratégie
La stratégie utilise un indice de Morpheus de longueur 3, la ligne de surachat est définie sur 100 et la ligne de survente est définie sur 0. La stratégie attend que l’indicateur de Morpheus atteigne un niveau de surachat, indiquant la présence d’un grand requin dans le marché. Si deux points de surachat de l’indicateur de Morpheus la veille, le prix peut encore maintenir la hausse, alors c’est un signal d’entrée à plusieurs têtes.
Lorsque l’indicateur de Morpheus = 100 et que la ligne K sous-jacente est la ligne du grand jour, effectuez une entrée en plus. La ligne de stop loss est définie comme le point le plus bas du jour de négociation et s’arrête dans les 60 minutes suivant l’entrée.
Pour le shorting, on peut utiliser la logique de l’image. C’est-à-dire que l’indicateur de Morphe atteint la survente et que la ligne K sous-jacente est la grande ligne négative.
Avantages stratégiques
L’utilisation de l’indicateur de morphine permet d’identifier efficacement le comportement des stocks potentiels d’accumulation de requins dans le marché, qui risquent de continuer à augmenter.
L’utilisation d’un point de rupture K-ligne avec une forte capacité d’identification d’entités permet de filtrer de nombreuses fausses ruptures.
Le filtre SMA, combiné à des filtres d’évitement, permet de réduire efficacement le risque de transaction.
En utilisant la méthode de l’hyper-short-line, le stop-loss de 60 minutes permet de verrouiller rapidement les bénéfices et de réduire la probabilité de retrait.
Risque stratégique
Les indicateurs de Morphe peuvent générer de faux signaux, entraînant des pertes inutiles. Il est possible d’ajuster les paramètres de manière appropriée ou d’ajouter d’autres indicateurs pour filtrer.
60 minutes de MÉTHODE d’OPÉRATION SUR L’EXTRA-COURTE L’opération peut être trop radicale et ne convient pas aux actions à forte volatilité. Le temps d’arrêt peut être ajusté de manière appropriée ou l’optimisation peut être utilisée avec un arrêt mobile.
Le risque de choc du marché en cas d’événement macroéconomique majeur n’est pas pris en compte. La stratégie doit être suspendue et la négociation doit être poursuivie jusqu’à ce que le marché se stabilise.
Orientation de l’optimisation de la stratégie
Différentes combinaisons de paramètres peuvent être testées, telles que l’ajustement de la longueur de l’indicateur de Morpheus, l’optimisation des paramètres de la période SMA, etc.
Essayez d’ajouter d’autres indicateurs en combinaison, tels que le canal BOLL, l’indicateur KD, etc., pour voir si cela peut améliorer la précision du signal.
Tester si un arrêt de perte suffisamment souple peut générer des bénéfices plus importants.
Essayez de développer une version adaptée à d’autres cycles, comme une version de 15 minutes ou de 30 minutes, basée sur ce cadre stratégique.
Résumer
La stratégie est globalement très simple et facile à comprendre, et les idées de base sont cohérentes avec les idées classiques du suivi des grandes baleines. En identifiant les points critiques de survente des indices de Morpheus, en combinaison avec le filtrage des entités de la ligne K, de nombreux bruits peuvent être filtrés. L’ajout d’un filtre SMA améliore encore la stabilité de la stratégie.
L’opération de 60 minutes sur une ligne ultra-courte peut générer des gains rapides, mais elle comporte également des risques opérationnels plus élevés. Dans l’ensemble, il s’agit d’un modèle de stratégie quantifiée très utile en temps de combat, qui mérite d’être étudié et optimisé en profondeur, et qui nous fournit des idées précieuses pour le développement de la stratégie.
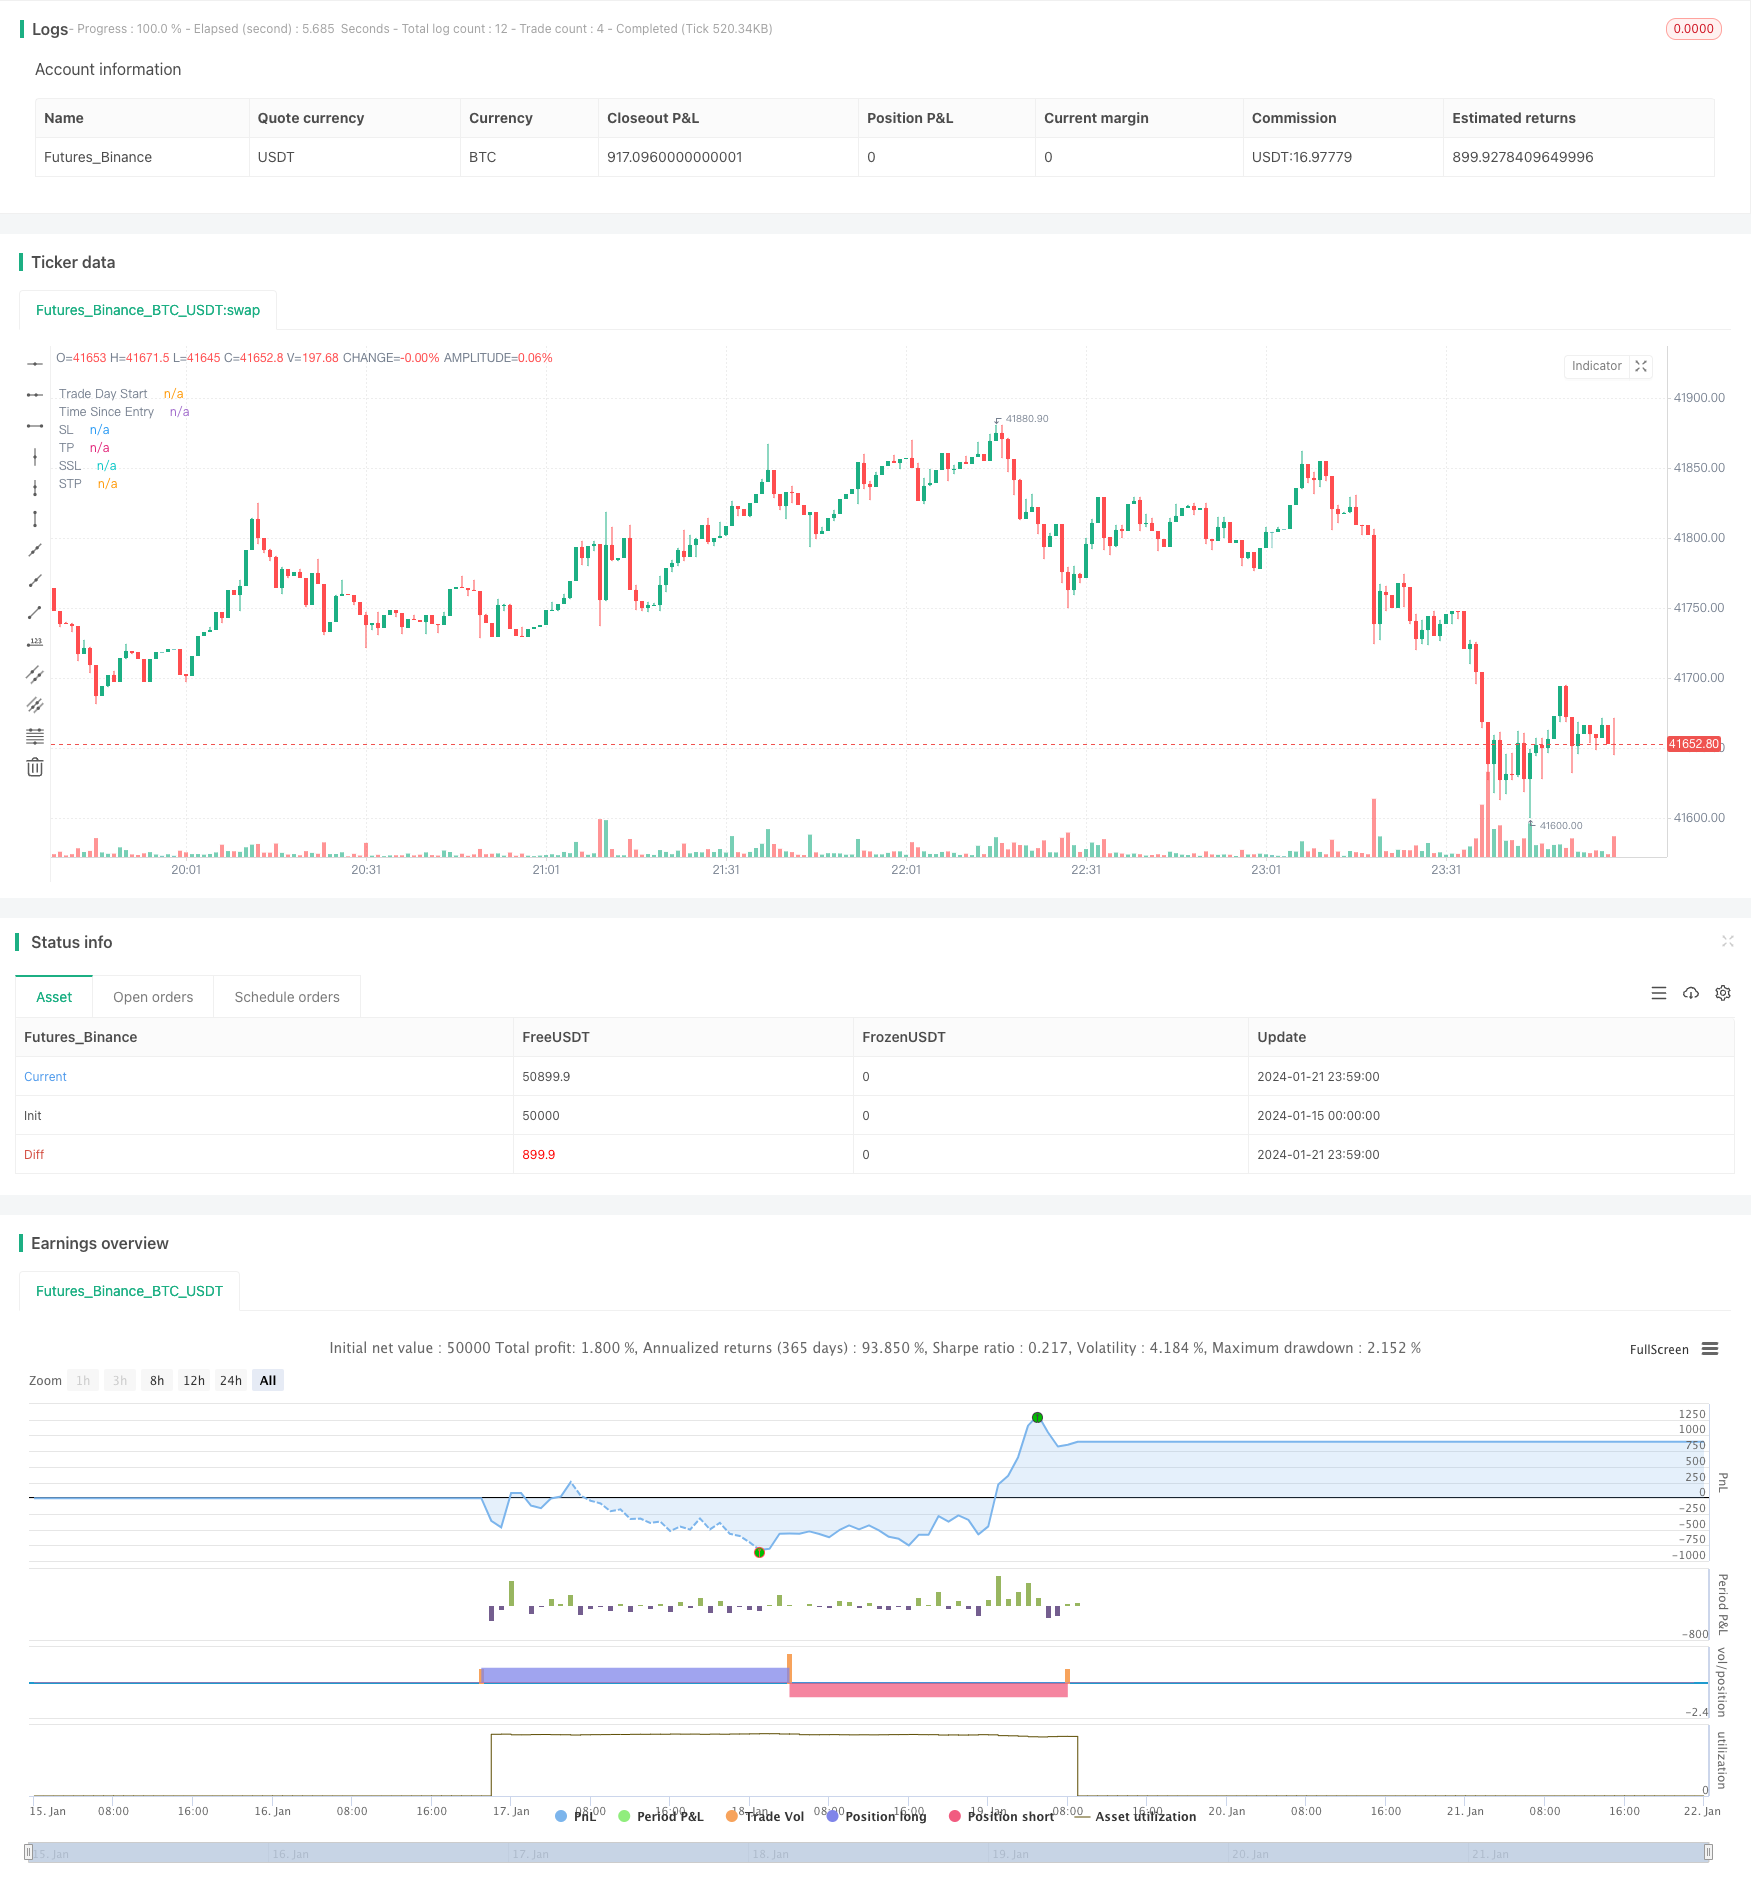
/*backtest
start: 2024-01-15 00:00:00
end: 2024-01-22 00:00:00
period: 1m
basePeriod: 1m
exchanges: [{"eid":"Futures_Binance","currency":"BTC_USDT"}]
*/

// This source code is subject to the terms of the Mozilla Public License 2.0 at https://mozilla.org/MPL/2.0/

// From "Crypto Day Trading Strategy" PDF file.

// * I'm using a SMA filter to avoid buying when the price is declining. Time frame was better at 15 min according to my test.

// 1 - Apply the 3 period Money Flow Index indicator to the 5 minute chart, using 0 and 100 as our oversold and overbought boundaries
// 2 - Wait for the MFI to reach overbought levels, that indicates the presence of "big sharks" in the market. Price needs to hold up
// the first two MFI overbought occurrences of the day to be considered as a bullish entry signal.*
// 3 - We buy when the MFI = 100 and the next candle is a bullish candle with short wicks.
// 4 - We place our Stop Loss below the low of the trading day and we Take Profit during the first 60 minutes after taking the trade.

// The logic above can be used in a mirrored fashion to take short entries, this is a custom parameter that can be modified from
// the strategy Inputs panel.

// © tweakerID

//@version=4
strategy("Money Flow Index 5 min Strategy",
     overlay=true )

direction = input(0, title = "Strategy Direction", type=input.integer, minval=-1, maxval=1)
strategy.risk.allow_entry_in(direction == 0 ? strategy.direction.all : (direction < 0 ? strategy.direction.short : strategy.direction.long))

/////////////////////// STRATEGY INPUTS ////////////////////////////////////////
title1=input(true, "-----------------Strategy Inputs-------------------")

i_MFI = input(3, title="MFI Length")
OB=input(100, title="Overbought Level")
OS=input(0, title="Oversold Level")
barsizeThreshold=input(.5, step=.05, minval=.1, maxval=1, title="Bar Body Size, 1=No Wicks")
i_MAFilter = input(true, title="Use MA Trend Filter")
i_MALen = input(80, title="MA Length")
i_timedexit=input(false, title="Use 60 minutes exit rule")
short=input(true, title="Use Mirrored logic for Shorts")

/////////////////////// BACKTESTER /////////////////////////////////////////////
title2=input(true, "-----------------General Inputs-------------------")

// Backtester General Inputs
i_SL=input(true, title="Use Stop Loss and Take Profit")
i_SLType=input(defval="Strategy Stop", title="Type Of Stop", options=["Strategy Stop", "Swing Lo/Hi", "ATR Stop"])
i_SPL=input(defval=10, title="Swing Point Lookback")
i_PercIncrement=input(defval=3, step=.1, title="Swing Point SL Perc Increment")*0.01
i_ATR = input(14, title="ATR Length")
i_ATRMult = input(5, step=.1, title="ATR Multiple")
i_TPRRR = input(2.2, step=.1, title="Take Profit Risk Reward Ratio")
TS=input(false, title="Trailing Stop")

// Bought and Sold Boolean Signal
bought = strategy.position_size > strategy.position_size[1]
 or strategy.position_size < strategy.position_size[1]

// Price Action Stop and Take Profit
LL=(lowest(i_SPL))*(1-i_PercIncrement)
HH=(highest(i_SPL))*(1+i_PercIncrement)
LL_price = valuewhen(bought, LL, 0)
HH_price = valuewhen(bought, HH, 0)
entry_LL_price = strategy.position_size > 0 ? LL_price : na
entry_HH_price = strategy.position_size < 0 ? HH_price : na
tp=strategy.position_avg_price + (strategy.position_avg_price - entry_LL_price)*i_TPRRR
stp=strategy.position_avg_price - (entry_HH_price - strategy.position_avg_price)*i_TPRRR

// ATR Stop
ATR=atr(i_ATR)*i_ATRMult
ATRLong = ohlc4 - ATR
ATRShort = ohlc4 + ATR
ATRLongStop = valuewhen(bought, ATRLong, 0)
ATRShortStop = valuewhen(bought, ATRShort, 0)
LongSL_ATR_price = strategy.position_size > 0 ? ATRLongStop : na
ShortSL_ATR_price = strategy.position_size < 0 ? ATRShortStop : na
ATRtp=strategy.position_avg_price + (strategy.position_avg_price - LongSL_ATR_price)*i_TPRRR
ATRstp=strategy.position_avg_price - (ShortSL_ATR_price - strategy.position_avg_price)*i_TPRRR


// Strategy Stop
DayStart = time == timestamp("UTC", year, month, dayofmonth, 0, 0, 0)
plot(DayStart ? 1e9 : na, style=plot.style_columns, color=color.silver, transp=80, title="Trade Day Start")
float LongStop = valuewhen(DayStart,low,0)*(1-i_PercIncrement)
float ShortStop = valuewhen(DayStart,high,0)*(1+i_PercIncrement)
float StratTP = strategy.position_avg_price + (strategy.position_avg_price - LongStop)*i_TPRRR
float StratSTP = strategy.position_avg_price - (ShortStop - strategy.position_avg_price)*i_TPRRR

/////////////////////// STRATEGY LOGIC /////////////////////////////////////////

MFI=mfi(close,i_MFI)
barsize=high-low
barbodysize=close>open?(open-close)*-1:(open-close)
shortwicksbar=barbodysize>barsize*barsizeThreshold
SMA=sma(close, i_MALen)
MAFilter=close > SMA
timesinceentry=(time - valuewhen(bought, time, 0)) / 60000
timedexit=timesinceentry == 60

BUY = MFI[1] == OB and close > open and shortwicksbar and (i_MAFilter ? MAFilter : true)
bool SELL = na
if short
    SELL := MFI[1] == OS and close < open and shortwicksbar and (i_MAFilter ? not MAFilter : true)

//Debugging Plots
plot(timesinceentry, transp=100, title="Time Since Entry")

//Trading Inputs
DPR=input(true, "Allow Direct Position Reverse")
reverse=input(false, "Reverse Trades")

// Entries
if reverse
    if not DPR
        strategy.entry("long", strategy.long, when=SELL and strategy.position_size == 0)
        strategy.entry("short", strategy.short, when=BUY and strategy.position_size == 0)
    else
        strategy.entry("long", strategy.long, when=SELL)
        strategy.entry("short", strategy.short, when=BUY)
else
    if not DPR
        strategy.entry("long", strategy.long, when=BUY and strategy.position_size == 0)
        strategy.entry("short", strategy.short, when=SELL and strategy.position_size == 0)
    else
        strategy.entry("long", strategy.long, when=BUY)
        strategy.entry("short", strategy.short, when=SELL)
if i_timedexit
    strategy.close_all(when=timedexit)

SL= i_SLType == "Swing Lo/Hi" ? entry_LL_price : i_SLType == "ATR Stop" ? LongSL_ATR_price : LongStop
SSL= i_SLType == "Swing Lo/Hi" ? entry_HH_price : i_SLType == "ATR Stop" ? ShortSL_ATR_price : ShortStop
TP= i_SLType == "Swing Lo/Hi" ? tp : i_SLType == "ATR Stop" ? ATRtp : StratTP
STP= i_SLType == "Swing Lo/Hi" ? stp : i_SLType == "ATR Stop" ? ATRstp : StratSTP

//TrailingStop
dif=(valuewhen(strategy.position_size>0 and strategy.position_size[1]<=0, high,0))
 -strategy.position_avg_price
trailOffset     = strategy.position_avg_price - SL
var tstop = float(na)
if strategy.position_size > 0
    tstop := high- trailOffset - dif
    if tstop<tstop[1]
        tstop:=tstop[1]
else
    tstop := na
StrailOffset     = SSL - strategy.position_avg_price
var Ststop = float(na)
Sdif=strategy.position_avg_price-(valuewhen(strategy.position_size<0
 and strategy.position_size[1]>=0, low,0))
if strategy.position_size < 0
    Ststop := low+ StrailOffset + Sdif
    if Ststop>Ststop[1]
        Ststop:=Ststop[1]
else
    Ststop := na

strategy.exit("TP & SL", "long", limit=TP, stop=TS? tstop : SL, when=i_SL)
strategy.exit("TP & SL", "short", limit=STP, stop=TS? Ststop : SSL, when=i_SL)

/////////////////////// PLOTS //////////////////////////////////////////////////

plot(i_SL and strategy.position_size > 0 and not TS ? SL : i_SL and strategy.position_size > 0 and TS ? tstop : na , title='SL', style=plot.style_cross, color=color.red)
plot(i_SL and strategy.position_size < 0 and not TS ? SSL : i_SL and strategy.position_size < 0 and TS ? Ststop : na , title='SSL', style=plot.style_cross, color=color.red)
plot(i_SL and strategy.position_size > 0 ? TP : na, title='TP', style=plot.style_cross, color=color.green)
plot(i_SL and strategy.position_size < 0 ? STP : na, title='STP', style=plot.style_cross, color=color.green)
// Draw price action setup arrows
plotshape(BUY ? 1 : na, style=shape.triangleup, location=location.belowbar,
 color=color.green, title="Bullish Setup", size=size.auto)
plotshape(SELL ? 1 : na, style=shape.triangledown, location=location.abovebar,
 color=color.red, title="Bearish Setup", size=size.auto)