Stratégie de swing trading de support et de résistance
Date de création:
2024-01-25 15:53:06
Dernière modification:
2024-01-25 15:53:06
Copier:
2
Nombre de clics:
603
1
Suivre
1751
Abonnés
Aperçu
Cette stratégie permet un contrôle précis de la logique de négociation et un arrêt de perte précis grâce à la combinaison de la stratégie de croisement RSI, des indicateurs aléatoires et de la stratégie d’optimisation du point de glissement de la position. En outre, l’introduction d’une optimisation du signal permet une meilleure maîtrise de la tendance et une gestion rationnelle des fonds.
Principe de stratégie
- L’indicateur RSI détermine les zones de sur-achat et de sur-vente et forme un signal de transaction avec les valeurs K et D de l’indicateur aléatoire.
- L’introduction d’une identification de type pour les lignes K pour aider à juger les signaux de tendance et éviter les erreurs de transaction.
- La moyenne SMA aide à déterminer la direction de la tendance. Elle est un signal de bullish lorsque la moyenne à court terme dépasse la moyenne à long terme de bas en haut.
- Stratégie de point de glissement de position plate, qui consiste à définir un prix de stop-loss en fonction de la fourchette de fluctuation la plus élevée et la plus basse.
Analyse des avantages
- Optimisation des paramètres du RSI pour mieux détecter les zones de survente et éviter les erreurs de trading
- Optimisation des paramètres de l’indicateur STO, réglage des paramètres de l’aplatissement, afin d’éliminer le bruit et améliorer la qualité du signal
- Introduction de l’analyse technique Heikin-Ashi pour identifier les variations de direction des entités de la ligne K et assurer l’exactitude des signaux de transaction
- La courbe SMA aide à déterminer la direction de la tendance générale et évite les transactions à contre-courant
- Combiné à une stratégie de point de glissement de stop-loss, vous pouvez maximiser le profit de chaque transaction
Analyse des risques
- Les fonds sont plus exposés aux risques si les marchés boursiers continuent à baisser
- La fréquence des transactions peut être trop élevée, ce qui augmente les coûts de transaction et les coûts de glissement
- Le RSI est sujet à de faux signaux et doit être filtré en combinaison avec d’autres indicateurs
Optimisation de la stratégie
- Modifier les paramètres du RSI pour optimiser les jugements de survente
- Ajustez les paramètres de l’indicateur STO, la fluidité et la fréquence pour améliorer la qualité du signal
- Ajuster les cycles de la moyenne mobile pour optimiser les jugements de tendance
- L’introduction de plus d’indicateurs techniques pour améliorer l’exactitude des signaux
- Optimisation du ratio de stop loss et de stop-loss pour réduire le risque de transaction unique
Résumer
La stratégie intègre les avantages de plusieurs indicateurs techniques traditionnels et, grâce à l’optimisation des paramètres et à l’amélioration des règles, réalise un équilibre entre la qualité du signal de négociation et le stop loss. Elle a une certaine universalité et une rentabilité stable.
Code source de la stratégie
/*backtest
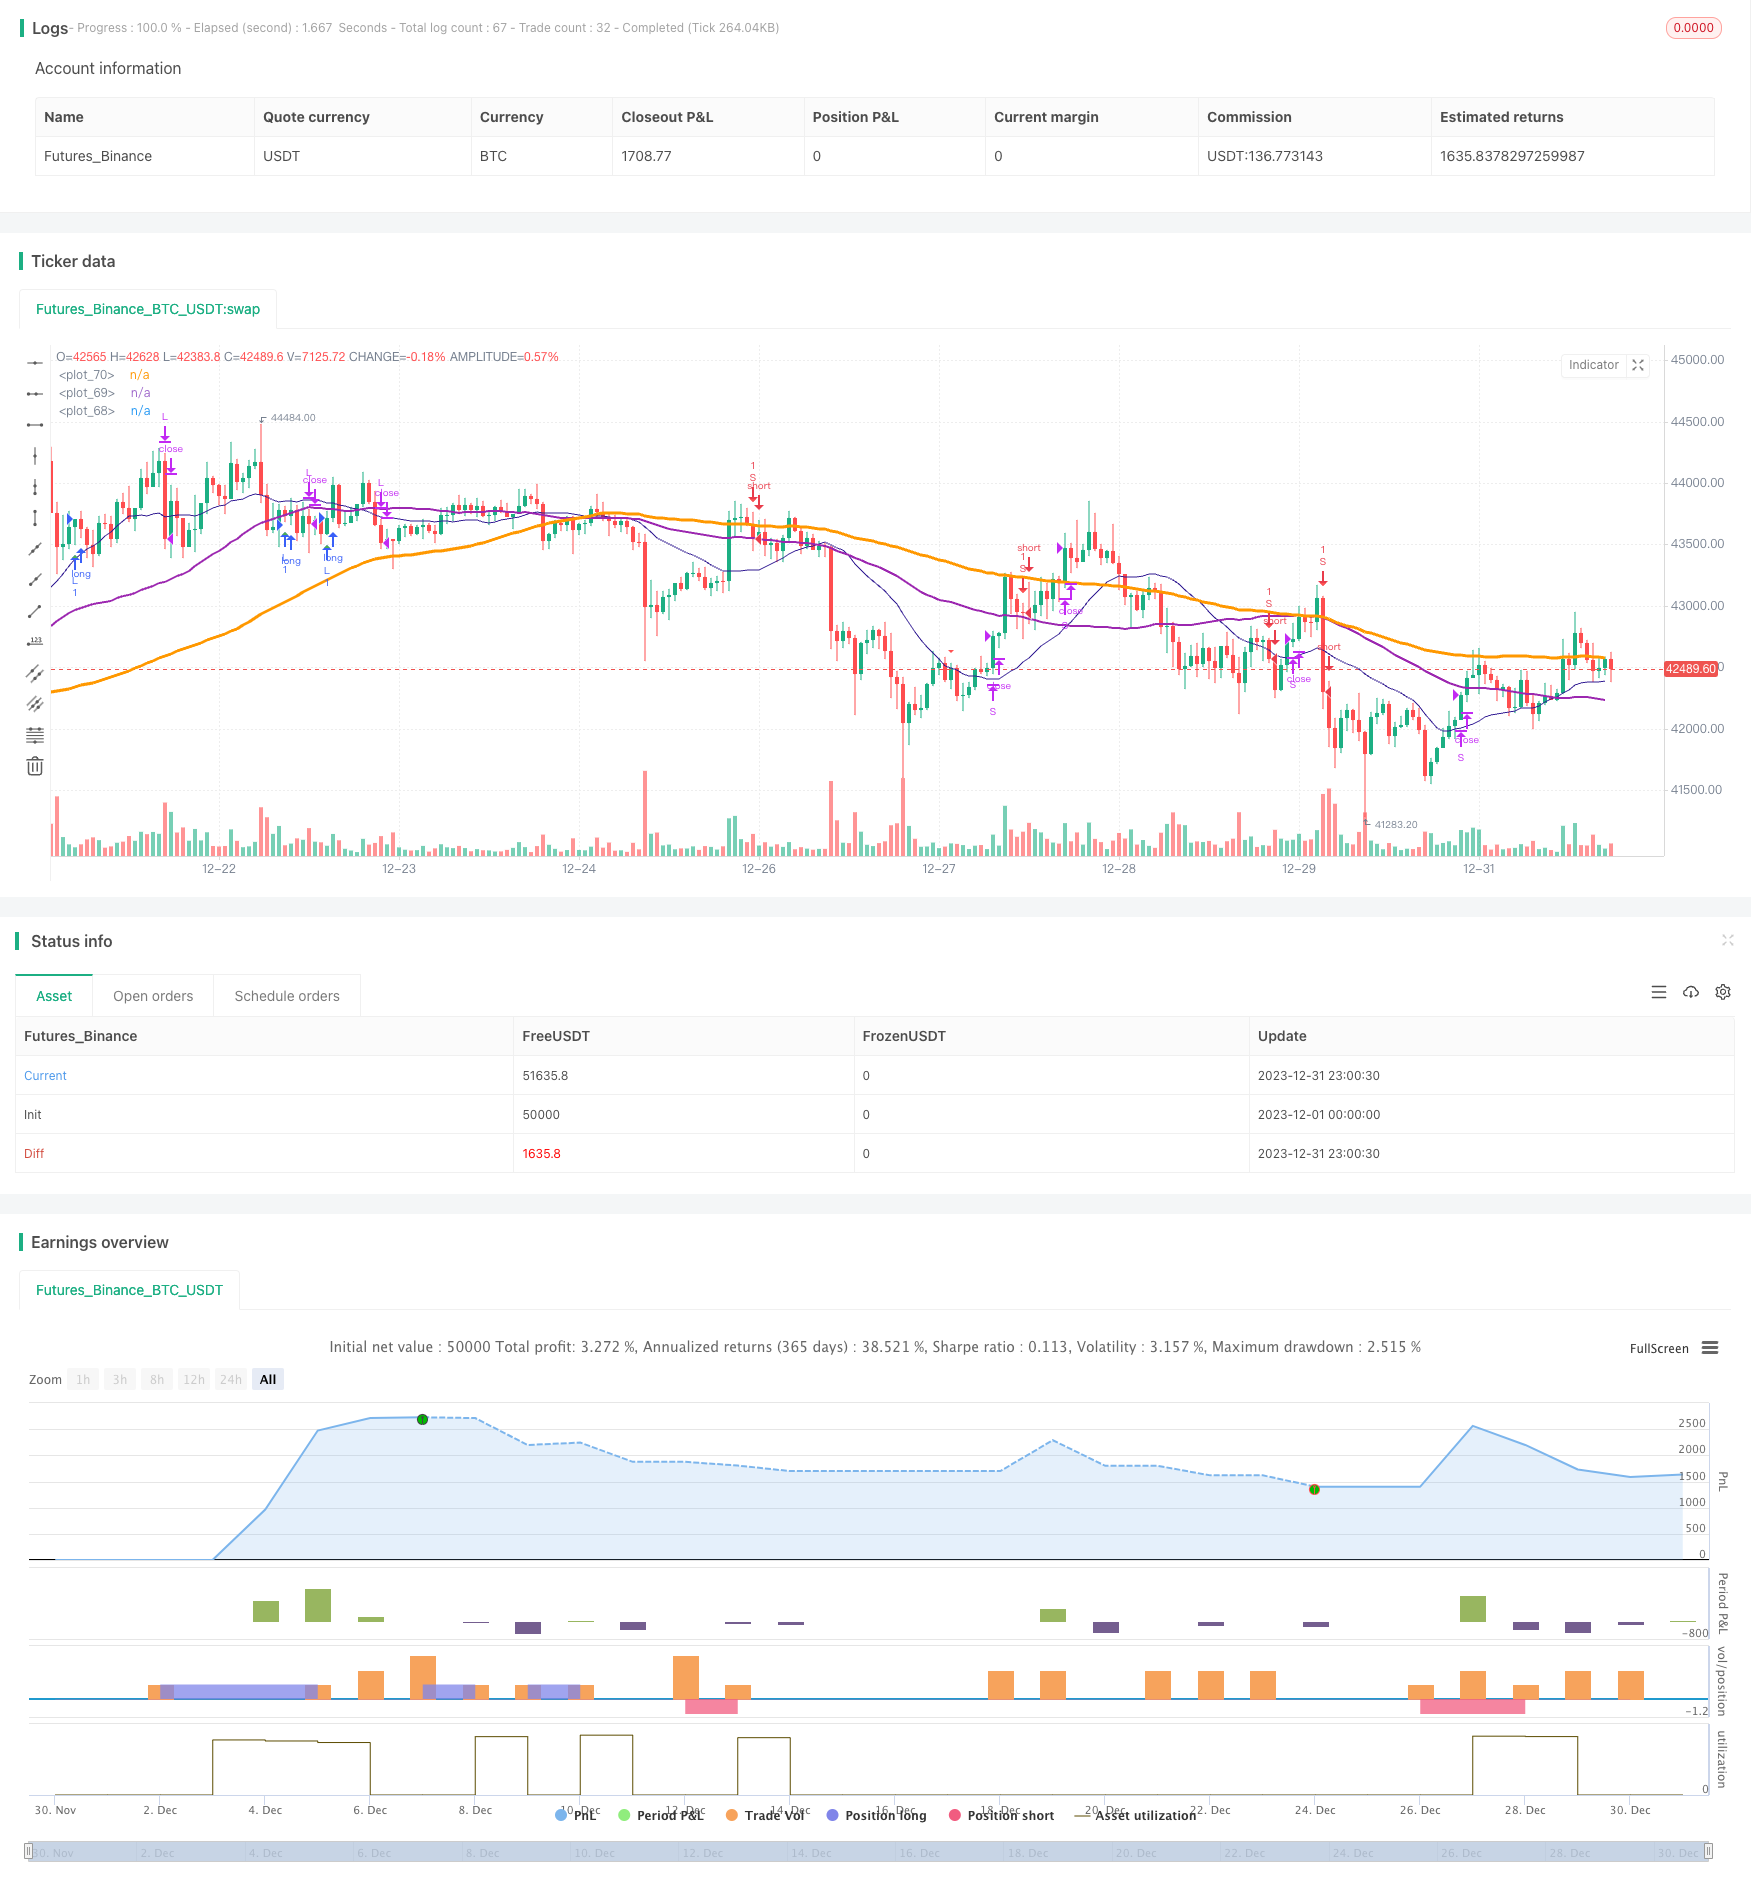
start: 2023-12-01 00:00:00
end: 2023-12-31 23:59:59
period: 1h
basePeriod: 15m
exchanges: [{"eid":"Futures_Binance","currency":"BTC_USDT"}]
*/
//@version=4
//study(title="@sentenzal strategy", shorttitle="@sentenzal strategy", overlay=true)
strategy(title="@sentenzal strategy", shorttitle="@sentenzal strategy", overlay=true )
smoothK = input(3, minval=1)
smoothD = input(3, minval=1)
lengthRSI = input(14, minval=1)
lengthStoch = input(14, minval=1)
overbought = input(80, minval=1)
oversold = input(20, minval=1)
smaLengh = input(100, minval=1)
smaLengh2 = input(50, minval=1)
smaLengh3 = input(20, minval=1)
src = input(close, title="RSI Source")
testStartYear = input(2017, "Backtest Start Year")
testStartMonth = input(1, "Backtest Start Month")
testStartDay = input(1, "Backtest Start Day")
testPeriodStart = timestamp(testStartYear,testStartMonth,testStartDay,0,0)
testPeriod() =>
time >= testPeriodStart ? true : false
rsi1 = rsi(src, lengthRSI)
k = sma(stoch(rsi1, rsi1, rsi1, lengthStoch), smoothK)
d = sma(k, smoothD)
crossBuy = crossover(k, d) and k < oversold
crossSell = crossunder(k, d) and k > overbought
dcLower = lowest(low, 10)
dcUpper = highest(high, 10)
heikinashi_close = security(heikinashi(syminfo.tickerid), timeframe.period, close)
heikinashi_open = security(heikinashi(syminfo.tickerid), timeframe.period, open)
heikinashi_low = security(heikinashi(syminfo.tickerid), timeframe.period, low)
heikinashi_high = security(heikinashi(syminfo.tickerid), timeframe.period, high)
heikinashiPositive = heikinashi_close >= heikinashi_open
heikinashiBuy = heikinashiPositive == true and heikinashiPositive[1] == false and heikinashiPositive[2] == false
heikinashiSell = heikinashiPositive == false and heikinashiPositive[1] == true and heikinashiPositive[2] == true
//plotshape(heikinashiBuy, style=shape.arrowup, color=green, location=location.belowbar, size=size.tiny)
//plotshape(heikinashiSell, style=shape.arrowdown, color=red, location=location.abovebar, size=size.tiny)
buy = (crossBuy == true or crossBuy[1] == true or crossBuy[2] == true) and (heikinashiBuy == true or heikinashiBuy[1] == true or heikinashiBuy[2] == true)
sell = (crossSell == true or crossSell[1] == true or crossSell[2] == true) and (heikinashiSell == true or heikinashiSell[1] == true or heikinashiSell[2] == true)
mult = timeframe.period == '15' ? 4 : 1
mult2 = timeframe.period == '240' ? 0.25 : mult
movingAverage = sma(close, round(smaLengh))
movingAverage2 = sma(close, round(smaLengh2))
movingAverage3 = sma(close, round(smaLengh3))
uptrend = movingAverage < movingAverage2 and movingAverage2 < movingAverage3 and close > movingAverage
downtrend = movingAverage > movingAverage2 and movingAverage2 > movingAverage3 and close < movingAverage
signalBuy = (buy[1] == false and buy[2] == false and buy == true) and uptrend
signalSell = (sell[1] == false and sell[2] == false and sell == true) and downtrend
takeProfitSell = (buy[1] == false and buy[2] == false and buy == true) and uptrend == false
takeProfitBuy = (sell[1] == false and sell[2] == false and sell == true) and uptrend
plotshape(signalBuy, style=shape.triangleup, color=green, location=location.belowbar, size=size.tiny)
plotshape(signalSell, style=shape.triangledown, color=red, location=location.abovebar, size=size.tiny)
plot(movingAverage, linewidth=3, color=orange, transp=0)
plot(movingAverage2, linewidth=2, color=purple, transp=0)
plot(movingAverage3, linewidth=1, color=navy, transp=0)
alertcondition(signalBuy, title='Signal Buy', message='Signal Buy')
alertcondition(signalSell, title='Signal Sell', message='Signal Sell')
strategy.close("L", when=dcLower[1] > low)
strategy.close("S", when=dcUpper[1] < high)
strategy.entry("L", strategy.long, 1, when = signalBuy and testPeriod() and uptrend)
strategy.entry("S", strategy.short, 1, when = signalSell and testPeriod() and uptrend ==false)
//strategy.exit("Exit Long", from_entry = "L", loss = 25000000, profit=25000000)
//strategy.exit("Exit Short", from_entry = "S", loss = 25000000, profit=25000000)