Stratégie de suivi de tendance de l'oscillateur à double inversion
Aperçu
La stratégie de suivi de la tendance des bandes de choc à double inversion permet de suivre la tendance en combinant le signal de double inversion et l’indicateur de la bande de choc. Elle utilise d’abord le système de réversion 123 pour générer un signal de revers, puis le filtre de signal combiné avec l’indicateur des bandes de chaos fractales pour suivre la tendance. La stratégie permet à la fois d’identifier les occasions de revers et de suivre la tendance.
Principe de stratégie
Système de rétroaction
Le système de retournement 123 est basé sur la page 183 du livre de Ulf Jensen Comment gagner trois fois plus sur le marché à terme. Son signal de négociation est le suivant:
Lorsque le cours de clôture est supérieur au cours de clôture du jour précédent pendant 2 jours consécutifs et que la ligne Slow K est inférieure à 50 le 9e jour, faites plus; lorsque le cours de clôture est inférieur au cours de clôture du jour précédent pendant 2 jours consécutifs et que la ligne Fast K est supérieure à 50 le 9e jour, faites moins.
Cette section utilise principalement l’indicateur Stochastic Oscillator pour générer des signaux dans les zones de survente. Utilisez une stratégie de hausse lorsque les actions augmentent continuellement mais que l’indicateur Stochastic Oscillator indique qu’il reste plus de place pour augmenter. Utilisez une stratégie de baisse lorsque les actions diminuent continuellement mais que l’indicateur Stochastic Oscillator indique qu’il reste plus de place pour baisser.
Indicateur des bandes de fractal chaos
L’indicateur Fractal Chaos Bands permet de juger de la tendance du marché en traçant les hauts et les bas du prix des actions, formant des hauts et des bas. Les règles sont les suivantes:
Quand le prix augmente et qu’il dépasse la barre, faites plus; quand le prix baisse et qu’il dépasse la barre, faites moins.
Cette section sert principalement de filtre de tendance et est utilisée en conjonction avec le signal de retournement 123. Les positions ne sont ouvertes que lorsque les deux signaux sont alignés.
Avantages stratégiques
- Le retour en arrière et les tendances pour saisir les opportunités
La stratégie de suivi de la tendance de la zone de choc à double inversion permet de capturer à la fois des opportunités de revers et de suivre la tendance, ce qui est très complet. Des signaux de négociation peuvent être obtenus que le marché soit en état de choc ou de tendance.
- Réduire les faux signaux et augmenter les chances de victoire
Par rapport à l’indicateur unique, cette stratégie permet de réduire considérablement les faux signaux et d’améliorer les chances de réussite et de rentabilité des transactions réelles.
- Réglage des paramètres est flexible et adaptable
Les paramètres de la stratégie de suivi des tendances de la double zone de choc inverse sont bien compris et les utilisateurs peuvent s’adapter en fonction de leurs besoins et de l’environnement du marché.
Risque et optimisation
- La tendance à l’adaptation
La stratégie elle-même est plus dépendante des opportunités de négociation à courte ou moyenne ligne. Dans les grandes tendances, la stratégie peut générer trop de signaux de revers et se terminer par une perte de sortie. Cela peut être optimisé par un ajustement des paramètres.
- Un soutien financier marginal est nécessaire
La stratégie de suivi des tendances de la double zone de choc inverse est un type de transaction fréquent qui nécessite une marge suffisante pour soutenir la demande de garantie de position. Pour les utilisateurs qui ont des fonds insuffisants, il peut être nécessaire de réduire la position de manière appropriée.
- Filtrage de plus d’indicateurs
La stratégie peut s’appuyer sur les bases existantes et introduire plus de différents types d’indicateurs pour enrichir la source de signaux et améliorer la stabilité de la stratégie. Par exemple, ajouter des indicateurs de quantité d’énergie, des indicateurs de volatilité, etc. pour vérifier les signaux de retournement et de tendance.
Résumer
La stratégie de suivi de la tendance à double bande de choc inverse combine avec succès les avantages du trading inverse et du suivi de la tendance. Elle permet à la fois de capturer les inversions et de suivre la tendance. Elle est très complète et efficace. Par rapport à un seul indicateur, elle peut réduire considérablement les faux signaux et améliorer les taux de victoire et de profit des transactions réelles.
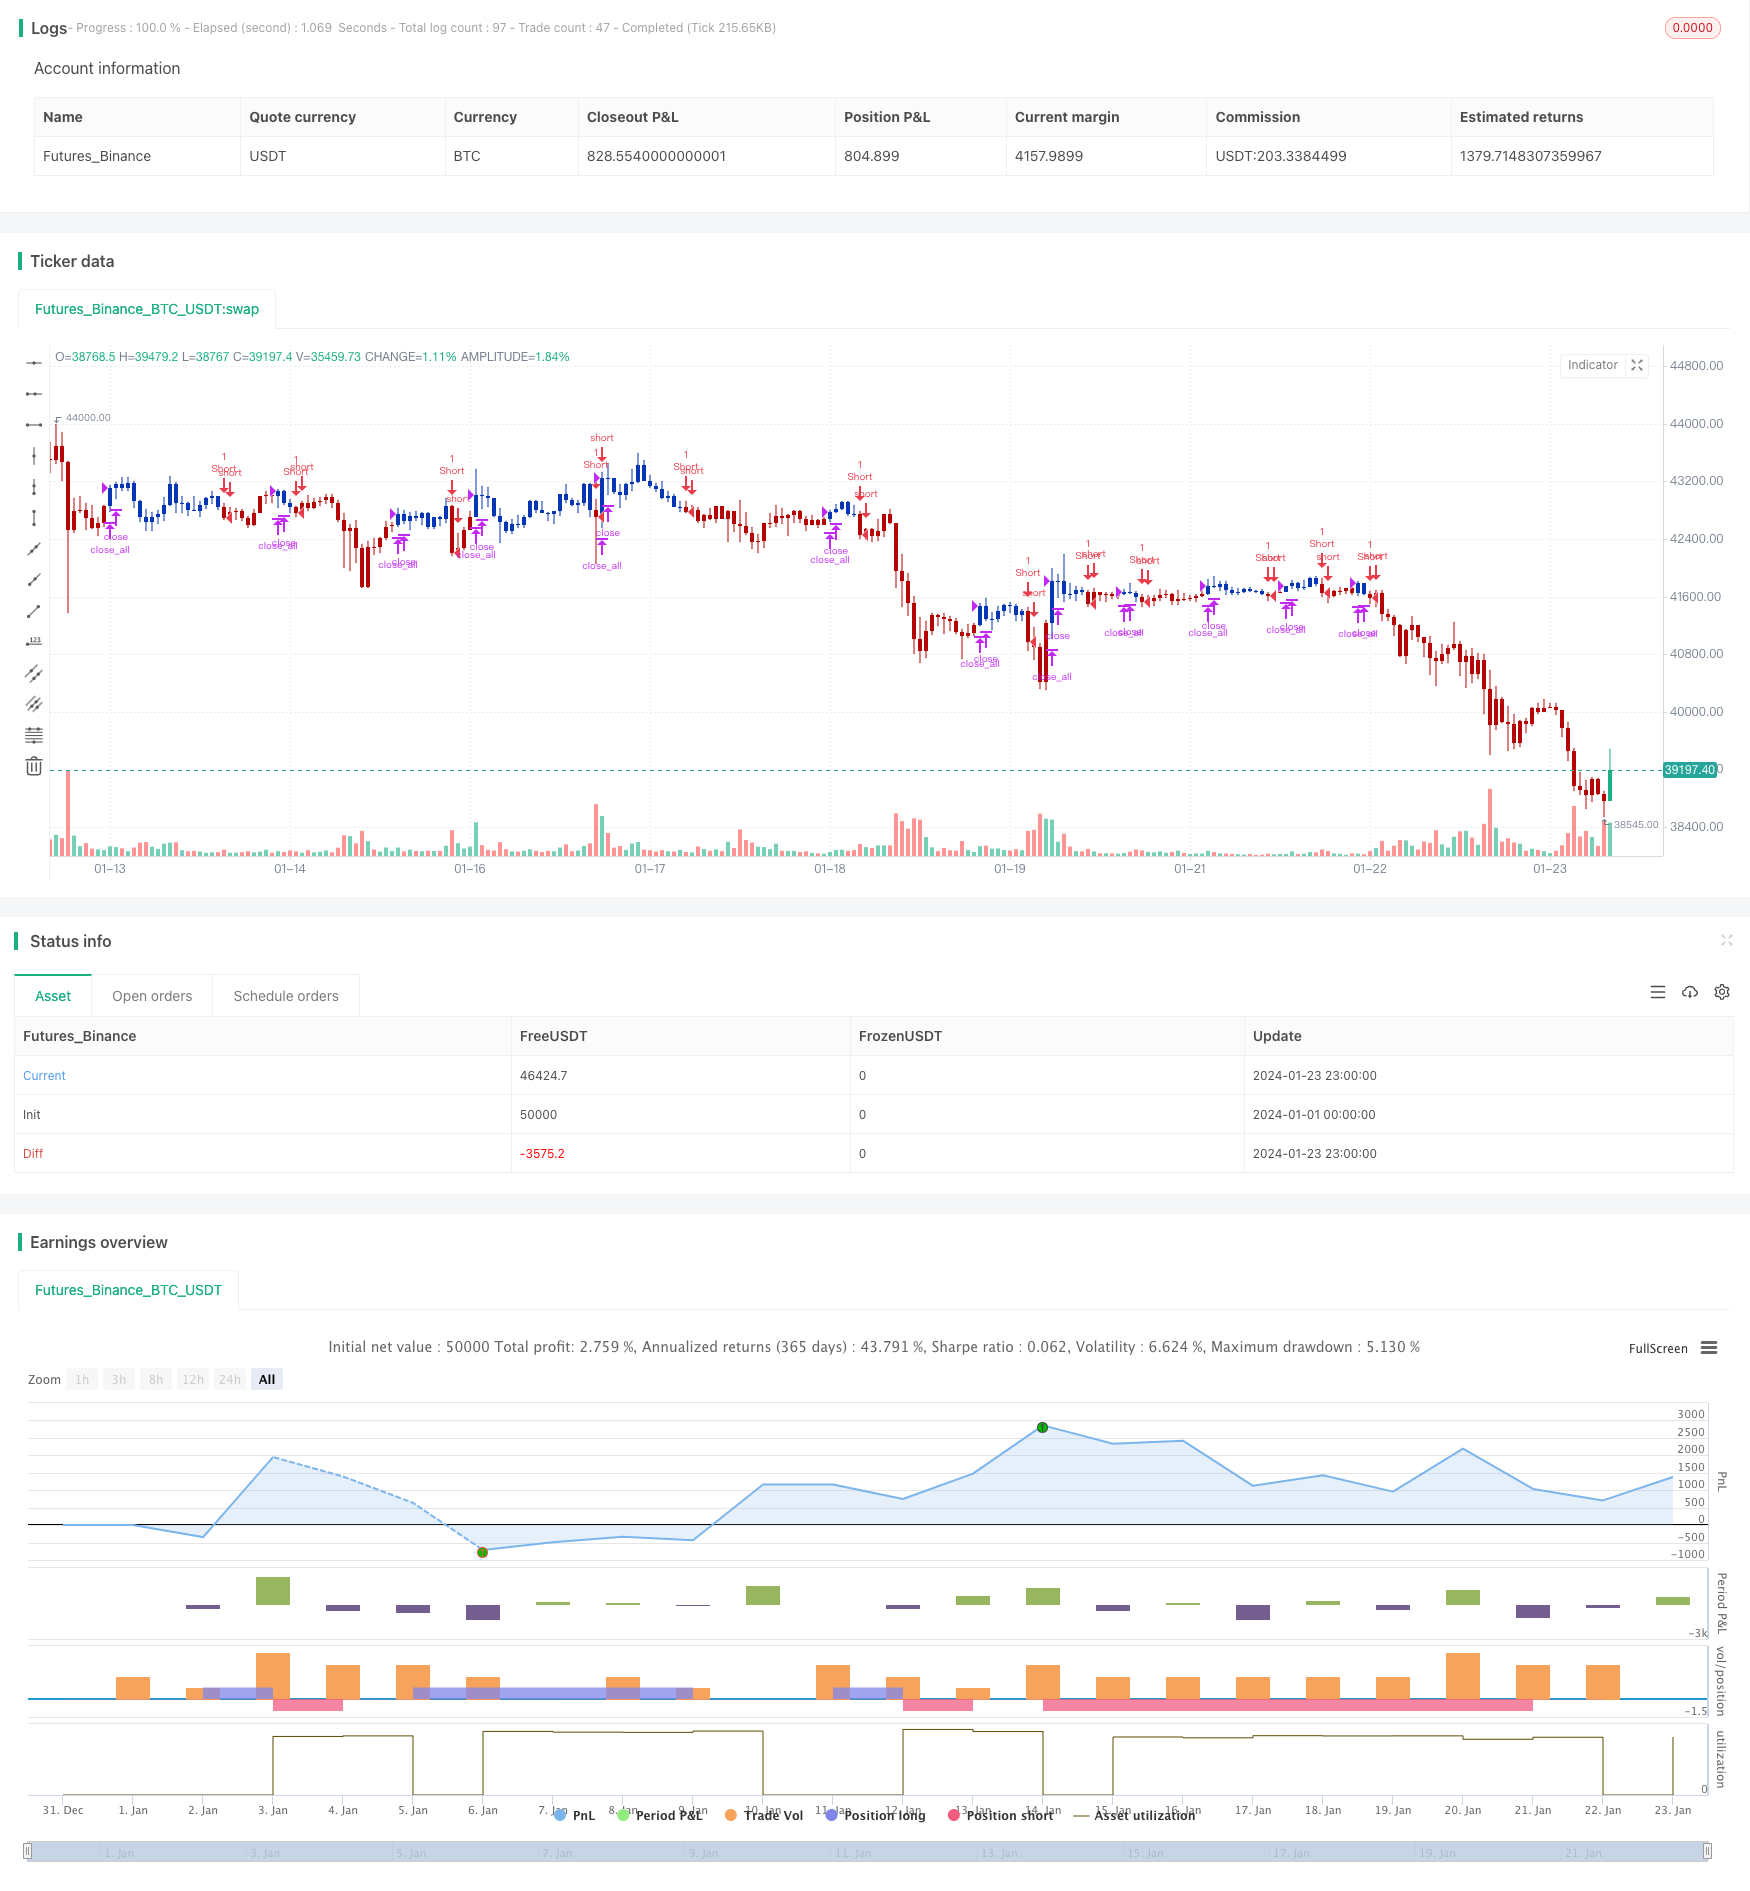
/*backtest
start: 2024-01-01 00:00:00
end: 2024-01-24 00:00:00
period: 1h
basePeriod: 15m
exchanges: [{"eid":"Futures_Binance","currency":"BTC_USDT"}]
*/

//@version=4
////////////////////////////////////////////////////////////
//  Copyright by HPotter v1.0 21/09/2020
// This is combo strategies for get a cumulative signal.
//
// First strategy
// This System was created from the Book "How I Tripled My Money In The
// Futures Market" by Ulf Jensen, Page 183. This is reverse type of strategies.
// The strategy buys at market, if close price is higher than the previous close
// during 2 days and the meaning of 9-days Stochastic Slow Oscillator is lower than 50.
// The strategy sells at market, if close price is lower than the previous close price
// during 2 days and the meaning of 9-days Stochastic Fast Oscillator is higher than 50.
//
// Second strategy
//  Stock market moves in a highly chaotic way, but at a larger scale, the movements
// follow a certain pattern that can be applied to shorter or longer periods of time
// and we can use Fractal Chaos Bands Indicator to identify those patterns. Basically,
// the Fractal Chaos Bands Indicator helps us to identify whether the stock market is
// trending or not. When a market is trending, the bands will have a slope and if market
// is not trending the bands will flatten out. As the slope of the bands decreases, it
// signifies that the market is choppy, insecure and variable. As the graph becomes more
// and more abrupt, be it going up or down, the significance is that the market becomes
// trendy, or stable. Fractal Chaos Bands Indicator is used similarly to other bands-indicator
// (Bollinger bands for instance), offering trading opportunities when price moves above or
// under the fractal lines.
//
// The FCB indicator looks back in time depending on the number of time periods trader selected
// to plot the indicator. The upper fractal line is made by plotting stock price highs and the
// lower fractal line is made by plotting stock price lows. Essentially, the Fractal Chaos Bands
// show an overall panorama of the price movement, as they filter out the insignificant fluctuations
// of the stock price.
//
// WARNING:
// - For purpose educate only
// - This script to change bars colors.
////////////////////////////////////////////////////////////
Reversal123(Length, KSmoothing, DLength, Level) =>
    vFast = sma(stoch(close, high, low, Length), KSmoothing)
    vSlow = sma(vFast, DLength)
    pos = 0.0
    pos := iff(close[2] < close[1] and close > close[1] and vFast < vSlow and vFast > Level, 1,
	         iff(close[2] > close[1] and close < close[1] and vFast > vSlow and vFast < Level, -1, nz(pos[1], 0)))
	pos

fractalUp(pattern) =>
    p = high[pattern+1]
    okl = 1
    okr = 1
    res = 0.0
	for i = pattern to 1
		okl := iff(high[i] < high[i+1] and okl == 1 , 1, 0)
	for i = pattern+2 to pattern*2+1
		okr := iff(high[i] < high[i-1] and okr == 1, 1, 0)
	res := iff(okl == 1 and okr == 1, p, res[1])
    res

fractalDn(pattern) =>
    p = low[pattern+1]
    okl = 1
    okr = 1
    res =0.0
	for i = pattern to 1
		okl := iff(low[i] > low[i+1] and okl == 1 , 1, 0)
	for i = pattern+2 to pattern*2+1
		okr := iff(low[i] > low[i-1] and okr == 1, 1, 0)
	res := iff(okl == 1 and okr == 1, p, res[1])
    res

FCB(Pattern) =>
    pos = 0.0
    xUpper = fractalUp(Pattern)
    xLower = fractalDn(Pattern)
    pos := iff(close > xUpper, 1,
             iff(close < xLower, -1, nz(pos[1], 0)))
    pos

strategy(title="Combo Backtest 123 Reversal & Fractal Chaos Bands", shorttitle="Combo", overlay = true)
Length = input(15, minval=1)
KSmoothing = input(1, minval=1)
DLength = input(3, minval=1)
Level = input(50, minval=1)
//-------------------------
Pattern = input(1, minval=1)
reverse = input(false, title="Trade reverse")
posReversal123 = Reversal123(Length, KSmoothing, DLength, Level)
posFCB = FCB(Pattern)
pos = iff(posReversal123 == 1 and posFCB == 1 , 1,
	   iff(posReversal123 == -1 and posFCB == -1, -1, 0))
possig = iff(reverse and pos == 1, -1,
          iff(reverse and pos == -1 , 1, pos))
if (possig == 1)
    strategy.entry("Long", strategy.long)
if (possig == -1)
    strategy.entry("Short", strategy.short)
if (possig == 0)
    strategy.close_all()
barcolor(possig == -1 ? #b50404: possig == 1 ? #079605 : #0536b3 )