Stratégie de trading Golden Cross
Aperçu
Une stratégie de trading utilisant la croix de deux moyennes mobiles de différentes périodes comme signaux d’achat et de vente. Plus précisément, une croix dorée est générée lorsque la moyenne mobile à court terme franchit la moyenne mobile à long terme par le bas et indique une hausse; une croix morte est générée lorsque la moyenne mobile à court terme franchit la moyenne mobile à long terme par le haut et indique une baisse.
Principe de stratégie
Cette stratégie est basée sur deux principes:
Les moyennes mobiles reflètent les tendances et les forces du marché. Les moyennes mobiles à court terme capturent les mouvements et les points de basculement les plus récents du marché. Les moyennes mobiles à long terme représentent les principales tendances du marché.
La formation d’une croix d’or entre une moyenne mobile à court terme et une moyenne mobile à long terme indique que la force du marché à court terme dépasse la force de la tendance à long terme et qu’il est donc probable que de nouvelles tendances haussières commencent. La formation d’une croix de mort indique que la tendance à la baisse à long terme est dominante et qu’il est donc probable que la baisse se poursuive.
Plus précisément, la stratégie définit des moyennes mobiles simples de 13 cycles et de 30 cycles et génère un signal de transaction lorsqu’elles se croisent. Le principe de la croisée est le suivant:
Lorsque la courte moyenne mobile à court terme traverse la moyenne mobile à long terme, un signal de croix dorée est généré, indiquant une opportunité de faire plus. En ce moment, l’entrée est effectuée en évaluant la robustesse de la tendance: si le prix est maintenu à la hausse pendant plus d’un certain cycle, et que vous êtes convaincu que la tendance actuelle est à la hausse, faites plus.
Lorsque la courte moyenne mobile à court terme passe sous la moyenne mobile à long terme, un signal de croix de mort est généré, indiquant une opportunité de prise de position. En ce moment, l’entrée est effectuée en évaluant la robustesse de la tendance: si le prix maintient la baisse au-delà d’un certain cycle, il est convaincu que la tendance actuelle est à la baisse, alors la prise de position.
L’intensité du signal croisé est évaluée par la pente de la moyenne mobile. Un signal croisé est considéré comme suffisamment puissant pour mériter l’entrée seulement si la pente de la moyenne mobile à court et à long terme est supérieure à une certaine valeur de seuil. Cela inhibe l’interférence du signal faux ordinaire.
Le stop loss est réglé sur 20% et le stop loss sur 100%.
Analyse des avantages
Les avantages de cette stratégie sont les suivants:
Les idées sont claires, simples, faciles à comprendre et à mettre en œuvre, adaptées aux débutants.
L’utilisation des caractéristiques de prix moyens a un certain effet de réduction du bruit, afin d’éviter d’être induit en erreur par les fluctuations de prix à court terme.
L’évaluation de la robustesse de la tendance, en évitant de faire mécaniquement trop de blanchiment, mais en combinant le jugement du gros marché.
L’introduction d’un facteur de dynamique de la pente de la moyenne mobile rend le signal plus fiable.
L’optimisation de la rétroaction est simple et ne nécessite que quelques paramètres clés tels que l’ajustement des paramètres des moyennes mobiles et du temps de maintien de la tendance.
Analyse des risques
La stratégie présente également les risques suivants:
La nature de l’intersection biunivoque est toujours un signal en retard, il n’est pas possible de prédire parfaitement le point de basculement, il y a un certain degré de retard. Le cycle de la moyenne mobile doit être raccourci de manière appropriée ou utilisé en combinaison avec des facteurs qui peuvent prédire le point de basculement.
Les systèmes de négociation mécanique sont susceptibles d’être frappés en même temps, ce qui aggrave les situations excessives, rendant inefficaces les arrêts de perte ou les freins. Les freins de perte de perte de perte doivent être configurés en échelles ou une intervention manuelle appropriée.
Il est préférable d’éviter les variétés qui se répètent à l’horizontale pendant ce type de cycle et de choisir les variétés qui ont une direction claire pour le commerce.
La fenêtre de temps d’évaluation de la robustesse de la tendance est définie de manière à ce que les valeurs optimales soient testées à plusieurs reprises pour déterminer si elles ont une influence significative sur les résultats.
Direction d’optimisation
Les stratégies d’équilibrage bi-linéaire peuvent également être optimisées en ce qui concerne:
Ajouter des indicateurs pour évaluer les tendances à grande échelle et éviter les opérations de contre-courant. Par exemple, ajouter la position de la courbe de comparaison ou de la courbe lunaire.
Ajouter la vérification du volume des transactions, émettre des signaux uniquement lorsque le volume des transactions est élevé, éviter les faux signaux.
Optimiser les paramètres de la moyenne mobile pour trouver la combinaison de périodes optimale. Vous pouvez essayer d’adapter les paramètres de la moyenne mobile.
La combinaison d’indicateurs de formule courants, tels que MACD, KD et autres, permet d’améliorer la précision du signal.
La mise en place d’un stop-loss en échelle permet de mieux contrôler les risques.
Résumer
La stratégie d’intersection de deux lignes homogènes est une stratégie très intuitive et interprétable dans l’ensemble. Elle combine les caractéristiques de la suppression du bruit des moyennes mobiles avec la capacité de reconnaître les tendances simples de la détermination de la croix.
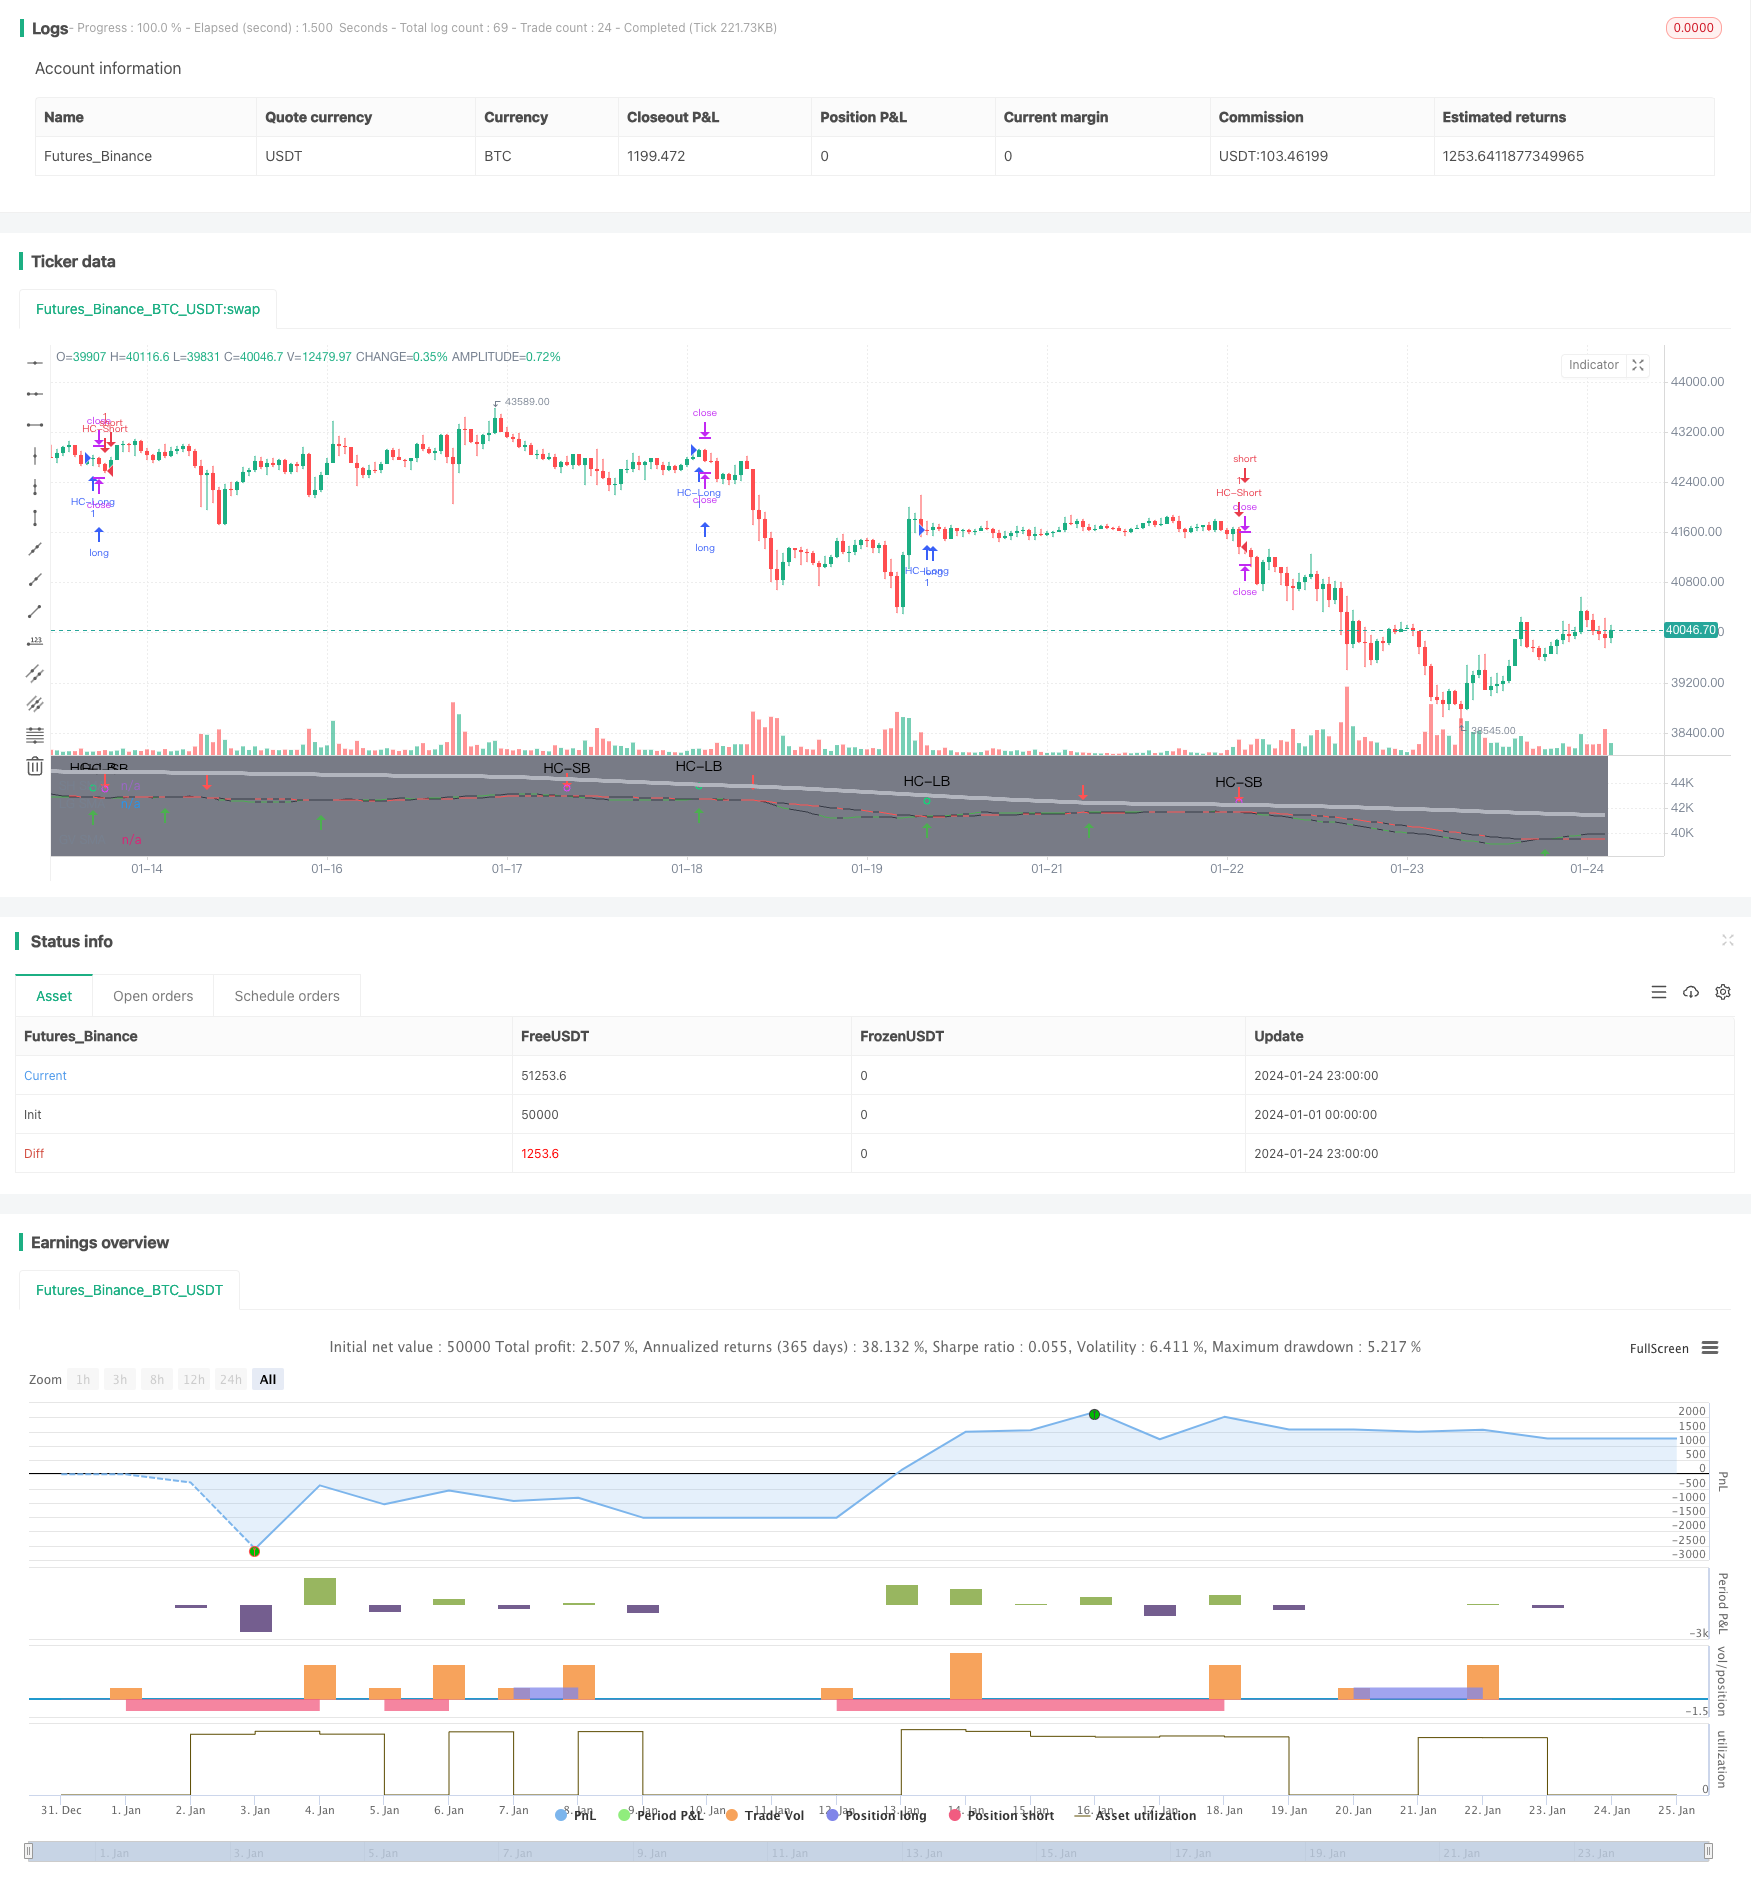
/*backtest
start: 2024-01-01 00:00:00
end: 2024-01-25 00:00:00
period: 1h
basePeriod: 15m
exchanges: [{"eid":"Futures_Binance","currency":"BTC_USDT"}]
*/

//@version=4

// This source code is subject to the terms of the Mozilla Public License 2.0 at https://mozilla.org/MPL/2.0/
// © MakeMoneyCoESTB2020


//*********************Notes for continued work***************

//************************************************************

//Hello my fellow investors
//I am creating a simple non-cluttered strategy that uses 3(+1) simple means to determine: viability, entry, and exit
//1) Has a consistent trend been maintained for several days/weeks
//2) SH SMA crossover LG SMA = Bullish entry/LG SMA crossover SH SMA = Bearish entry
//3) Use the Slope factor & Weeks in Trend (WiT) to dertermine how strong of an entry signal you are comfortable with
//4) Exit position based on next SMA cross and trend reversal or stop loss%
//3+1) For added confidence in trend detection: Apply MACD check - buy--> MACD line above signal line and corssover below histogram \\ sell --> MACD line below signal line and crossover above histogram.
//*)This code also allows you to determine your desired backtesting date compliments of alanaster


//This code is the product of many hours of hard work on the part of the greater tradingview community.  The credit goes to everyone in the community who has put code out there for the greater good.

//Happy Hunting!

// 1. Define strategy settings*************************************************************************************************************************************************************************

//Title
strategy("KISS Strategy: SMA + EMA", shorttitle="KISS Strat")

//define calculations price source
price = input(title="Price Source", defval=close)

// 2. Calculate strategy values*************************************************************************************************************************************************************************

//Calculate 13/30/200SMA
SH_SMA_length= input(title="SH SMA Length", defval=13) //short SMA length
LG_SMA_length= input(title="LG SMA Length", defval=30) //long SMA length
GV_SMA_length= input(title="SH SMA Length", defval=200) //Gravitational SMA length

SH_SMA=sma(price, SH_SMA_length) //short SMA
LG_SMA=sma(price, LG_SMA_length) //long SMA
GV_SMA=sma(price, GV_SMA_length) //gravitational SMA

//calculate MACD
//define variables for speed
fast = 12, slow = 26
//define parameters to calculate MACD
fastMA = ema(price, fast)
slowMA = ema(price, slow)
//define MACD line
macd = fastMA - slowMA
//define SIGNAL line
signal = sma(macd, 9)

//Determine what type of trend we are in
dcp = security(syminfo.tickerid, 'D', close)   //daily close price
wcp = security(syminfo.tickerid, 'W', close)   //weekly close price

WiT = input(title="Weeks In Trend", defval=1, maxval=5, minval=1)    //User input for how many weeks of price action to evaluate (Weeks in Trend = WiT)
BearTrend = false       //initialize trend variables as false
BullTrend = false       //initialize trend variables as false

// BullTrend := (wcp > SH_SMA) and (SH_SMA > LG_SMA)  //true if price is trending up based on weekly price close
// BearTrend := (wcp < SH_SMA) and (SH_SMA < LG_SMA)  //true if price is trending down based on weekly price close


// BullTrend := (price > SH_SMA) and (SH_SMA > LG_SMA)  //true if price is trending up
// BearTrend := (price < SH_SMA) and (SH_SMA < LG_SMA)  //true if price is trending down

//Determine if the market has been in a trend for 'n' weeks

n=WiT                           //create loop internal counting variable
for i=1 to WiT                  //create loop to determine if BearTrend=true to set number of weeks
    if (wcp[n] < price)         //evaluate if BearTrend=false comparing the current price to a paticular week close
        BearTrend := false      //set value to false if older price value is less than newer: trending up
        break                   //break out of for loop when trend first falters
    if (wcp[n] > price)         //evaluate if BearTrend=true comparing the current price to a paticular week close
        BearTrend := true       //set value to true if older price value is greater than newer: trending down
    n:=n-1                      //set internal counter one day closer to present

m=WiT                           //create loop internal counting variable
for j=1 to WiT                  //create loop to determine if BearTrend=true to set number of weeks
    if (wcp[m] > price)         //evaluate if BullTrend=false comparing the current price to a paticular week close
        BullTrend := false      //set value to false if older price value is greater than newer: trending down
        break                   //break out of for loop when trend first falters
    if (wcp[m] < price)         //evaluate if BullTrend=true comparing the current price to a paticular week close
        BullTrend := true       //set value to true if older price value is less than newer: trending up
    m:=m-1                      //set internal counter one day closer to present


//Determine if crossings occur
SH_LGcrossover = crossover(SH_SMA, LG_SMA)  //returns true if short crosses over long
SH_LGcrossunder = crossunder(SH_SMA, LG_SMA)    //returns true if short crosses under long

//Determine the slope of the SMAs when a cross over occurs
SlopeFactor= input(title="Slope Factor", defval=.01, minval=0, step = 0.001) //user input variable for what slope to evaluate against
XSlopeSH = abs(SH_SMA-SH_SMA[2]) //slope of short moving average (time cancels out)
XSlopeLG = abs(LG_SMA-LG_SMA[2]) //slope of long moving average (time cancels out)
StrongSlope = iff (abs(XSlopeSH-XSlopeLG)>SlopeFactor, true, false) //create a boolean variable to determine is slope intensity requirement is met

// ************************************ INPUT BACKTEST RANGE ******************************************=== coutesy of alanaster
fromMonth = input(defval = 4,    title = "From Month",      type = input.integer, minval = 1, maxval = 12)
fromDay   = input(defval = 1,    title = "From Day",        type = input.integer, minval = 1, maxval = 31)
fromYear  = input(defval = 2020, title = "From Year",       type = input.integer, minval = 1970)
thruMonth = input(defval = 1,    title = "Thru Month",      type = input.integer, minval = 1, maxval = 12)
thruDay   = input(defval = 1,    title = "Thru Day",        type = input.integer, minval = 1, maxval = 31)
thruYear  = input(defval = 2112, title = "Thru Year",       type = input.integer, minval = 1970)

// === INPUT SHOW PLOT ===
showDate  = input(defval = true, title = "Show Date Range", type = input.bool)

// === FUNCTION EXAMPLE ===
start     = timestamp(fromYear, fromMonth, fromDay, 00, 00)        // backtest start window
finish    = timestamp(thruYear, thruMonth, thruDay, 23, 59)        // backtest finish window
window()  => true

bgcolor(color = showDate and window() ? color.gray : na, transp = 90)
// === EXECUTION ===
//strategy.entry("L", strategy.long, when = window() and crossOv)    // enter long when "within window of time" AND crossover
//strategy.close("L", when = window() and crossUn)                   // exit long when "within window of time" AND crossunder

// 3. Output strategy data*************************************************************************************************************************************************************************

//Embolden line if a trend exists
trendcolorLG = BearTrend?color.red:color.black //highlights beartrend condition met graphically
trendcolorSH = BullTrend?color.green:color.black //highlights beartrend condition met graphically

//plot SMAs
plot(SH_SMA, title = "SH SMA", color = trendcolorSH)
plot(LG_SMA, title = "LG SMA", color = trendcolorLG)
plot(GV_SMA, title = "GV SMA", color = color.silver, linewidth = 4, transp = 70)

//Highlight crossovers
plotshape(series=SH_LGcrossover, style=shape.arrowup, location=location.belowbar,size=size.normal, color=color.green)
plotshape(series=SH_LGcrossunder, style=shape.arrowdown, location=location.abovebar,size=size.normal, color=color.red)

// 4. Determine Long & Short Entry Calculations*************************************************************************************************************************************************************************

//Define countback variable
countback=input(minval=0, maxval=5, title="Price CountBack", defval=0)
//User input for what evaluations to run: SMA or SMA + EMA
SMA_Y_N=input(defval = "Y", title="Run SMA", type=input.string, options=["Y", "N"])
MACD_Y_N=input(defval = "N", title="Run MACD", type=input.string, options=["Y", "N"])

//Calculate SMA Cross entry conditions
SMAbuy=false
SMAsell=false
SMAbuy := SH_LGcrossover and StrongSlope and BearTrend[WiT*7]   //enter long if short SMA crosses over long SMA & security has been in a BearTrend for 'n' days back
SMAsell := SH_LGcrossunder and StrongSlope and BullTrend[WiT*7] //enter short if short SMA crosses under long SMA & security has been in a BullTrend for 'n' days back

//Calculate MACD Cross entry conditions
MACDbuy = iff(MACD_Y_N=="Y", crossunder(signal[countback], macd[countback]), true) and iff(MACD_Y_N=="Y", macd[countback]<0, true) and StrongSlope and BearTrend     //enter long if fast MACD crosses over slow MACD & there is a strong slope & security has been in a BearTrend for 'n' days back
MACDsell = iff(MACD_Y_N=="Y", crossunder(macd[countback], signal[countback]), true) and iff(MACD_Y_N=="Y", signal[countback]>0, true) and StrongSlope and BullTrend  //enter short if fast MACD crosses under slow MACD & there is a strong slope & security has been in a BullTrend for 'n' days back

//long entry condition
dataHCLB=(iff(SMA_Y_N=="Y", SMAbuy, true) and iff(MACD_Y_N=="Y", MACDbuy, true))
plotshape(dataHCLB, title= "HC-LB", color=color.lime, style=shape.circle, text="HC-LB")
strategy.entry("HC-Long", strategy.long, comment="HC-Long", when = dataHCLB and window())

//short entry condition
dataHCSB=(iff(SMA_Y_N=="Y", SMAsell, true) and iff(MACD_Y_N=="Y", MACDsell, true))
plotshape(dataHCSB, title= "HC-SB", color=color.fuchsia, style=shape.circle, text="HC-SB")
strategy.entry("HC-Short", strategy.short, comment="HC-Short", when=dataHCSB and window())


// 5. Submit Profit and Loss Exit Calculations Orders*************************************************************************************************************************************************************************

// User Options to Change Inputs (%)
stopPer = input(12, title='Stop Loss %', type=input.float) / 100
takePer = input(25, title='Take Profit %', type=input.float) / 100

// Determine where you've entered and in what direction
longStop = strategy.position_avg_price * (1 - stopPer)
shortStop = strategy.position_avg_price * (1 + stopPer)
shortTake = strategy.position_avg_price * (1 - takePer)
longTake = strategy.position_avg_price * (1 + takePer)

//exit position conditions and orders
if strategy.position_size > 0//or crossunder(price[countback], upperBB)
    strategy.exit(id="Close Long", when = window(), stop=longStop, limit=longTake)
if strategy.position_size < 0 //or crossover(price[countback], lowerBB)
    strategy.exit(id="Close Short", when = window(), stop=shortStop, limit=shortTake)


//Evaluate/debug equation***************************************************************************************************************************************************************************
// plotshape((n==5? true : na), title='n=5', style=shape.labeldown, location=location.abovebar, text='5', color=color.white, textcolor=color.black, transp=0) //print n value if 5
// plotshape((n==4? true : na), title='n=4', style=shape.labeldown, location=location.abovebar, text='4', color=color.white, textcolor=color.black, transp=0) //print n value if 4
// plotshape((n==3? true : na), title='n=3', style=shape.labeldown, location=location.abovebar, text='3', color=color.white, textcolor=color.black, transp=0) //print n value if 3
// plotshape((n==2? true : na), title='n=2', style=shape.labeldown, location=location.abovebar, text='2', color=color.white, textcolor=color.black, transp=0) //print n value if 2
// plotshape((n==1? true : na), title='n=1', style=shape.labeldown, location=location.abovebar, text='1', color=color.white, textcolor=color.black, transp=0) //print n value if 1
// lineValue = 11                                           //set random visible line value to check when equation is true
// colorP = (BearTrend==true) ? color.green : color.red
// plot (lineValue, title = "BearTrend", color = colorP)   //Plot when condition true=green, false=red
// plot (XSlopeLG+15, color=color.white) //used for code debugging
// plot (XSlopeSH+15, color=color.blue) //used for code debugging
// plot (abs(XSlopeSH-XSlopeLG)+20, color=color.fuchsia) //used for code debugging