Stratégie de suivi de tendance de rupture du canal Donchian
Aperçu
La stratégie de rupture du canal de Dongguan est une stratégie de suivi de la tendance qui forme un canal de prix en calculant les prix les plus élevés et les plus bas d’une période donnée et utilise les limites du canal comme signal d’achat et de vente. Lorsque le prix atteint la trajectoire supérieure, faites un short; lorsque le prix atteint la trajectoire inférieure, faites plus.
Principe de stratégie
La stratégie utilise l’indicateur de la voie de Dongxian pour déterminer la tendance des prix et calculer les points d’entrée et de sortie. La voie de Dongxian se compose de la voie supérieure, de la voie inférieure et de la voie médiane. La voie supérieure est le prix le plus élevé, la voie inférieure est le prix le plus bas et la voie médiane est le prix moyen d’une période donnée.
La longueur des cycles d’entrée et de sortie peut être configurée indépendamment. Lorsque le prix monte vers le bas, il y a une entrée supplémentaire. Lorsque le prix descend vers le haut, il y a une entrée vide.
En outre, la stratégie définit également un point d’arrêt. Le prix d’arrêt pour les positions multiples est le rapport entre le prix d’entrée et le prix d’arrêt (+ 1), tandis que le positionnement en position nulle est le contraire. En activant cette fonction, vous pouvez verrouiller les bénéfices et éviter l’expansion des pertes.
Dans l’ensemble, la stratégie juge les tendances tout en assurant qu’il y a suffisamment d’espace pour mettre en place des arrêts de perte et des arrêts de rupture. Cela le rend particulièrement adapté aux variétés à forte volatilité telles que les monnaies numériques.
Analyse des avantages
Cette stratégie présente les avantages suivants:
- La stratégie est claire, la génération de signaux simple et fiable.
- L’indicateur du canal de Dongxian est insensible aux fluctuations des prix et est propice à la capture des tendances.
- Les paramètres de passage peuvent être personnalisés pour s’adapter à différentes variétés et périodes de temps.
- La fonction anti-destruction intégrée permet de contrôler efficacement les risques.
- Il s’agit d’une variété à forte volatilité comme les monnaies numériques, avec un potentiel de revenus élevé.
Analyse des risques
La stratégie présente également les risques suivants:
- Le risque d’une vente massive ne peut pas être évité, bien qu’elle puisse arrêter les pertes.
- Une mauvaise configuration des paramètres peut entraîner des transactions trop fréquentes, augmentant les coûts de transaction et le risque de glissement.
- Cette stratégie est insensible aux fluctuations des prix et peut laisser passer des opportunités de trading.
Afin de maîtriser ces risques, il est recommandé de prendre les mesures suivantes:
- Réduire les fonds individuels, diversifier les types d’investissement et contrôler les risques globaux.
- Optimiser les paramètres pour trouver la meilleure combinaison de paramètres. Vous pouvez essayer d’optimiser automatiquement les méthodes telles que l’apprentissage automatique.
- Les signaux de rupture, combinés à des indicateurs supplémentaires, permettent d’évaluer la fiabilité et d’éviter les erreurs de transaction.
Direction d’optimisation
La stratégie peut être optimisée dans les dimensions suivantes:
- Tester et optimiser plus de combinaisons de paramètres pour trouver les meilleurs. Les principaux paramètres incluent le cycle du canal, le taux d’arrêt, la possibilité de faire plus de blanchiment, etc.
- Ajout de modèles d’apprentissage automatique pour identifier automatiquement les paramètres optimaux. Des méthodes telles que l’apprentissage par renforcement peuvent être utilisées.
- Les tendances et la fiabilité des signaux sont évaluées en combinaison avec d’autres indicateurs, tels que la moyenne, le volume de transactions, etc.
- Développer des stratégies de stop-loss, comme le suivi des stops, la sortie Chandelier, etc. pour contrôler davantage le risque.
- Élargissons notre champ d’application à d’autres variétés et recherchons les variétés commerciales qui correspondent le mieux à cette stratégie.
Résumer
Dans l’ensemble, la stratégie de rupture de la chaîne de Dongguan est une stratégie de suivi de la tendance avec un jugement clair et un risque contrôlable. Elle convient particulièrement aux variétés à forte volatilité telles que les monnaies numériques, avec un potentiel de rendement élevé.
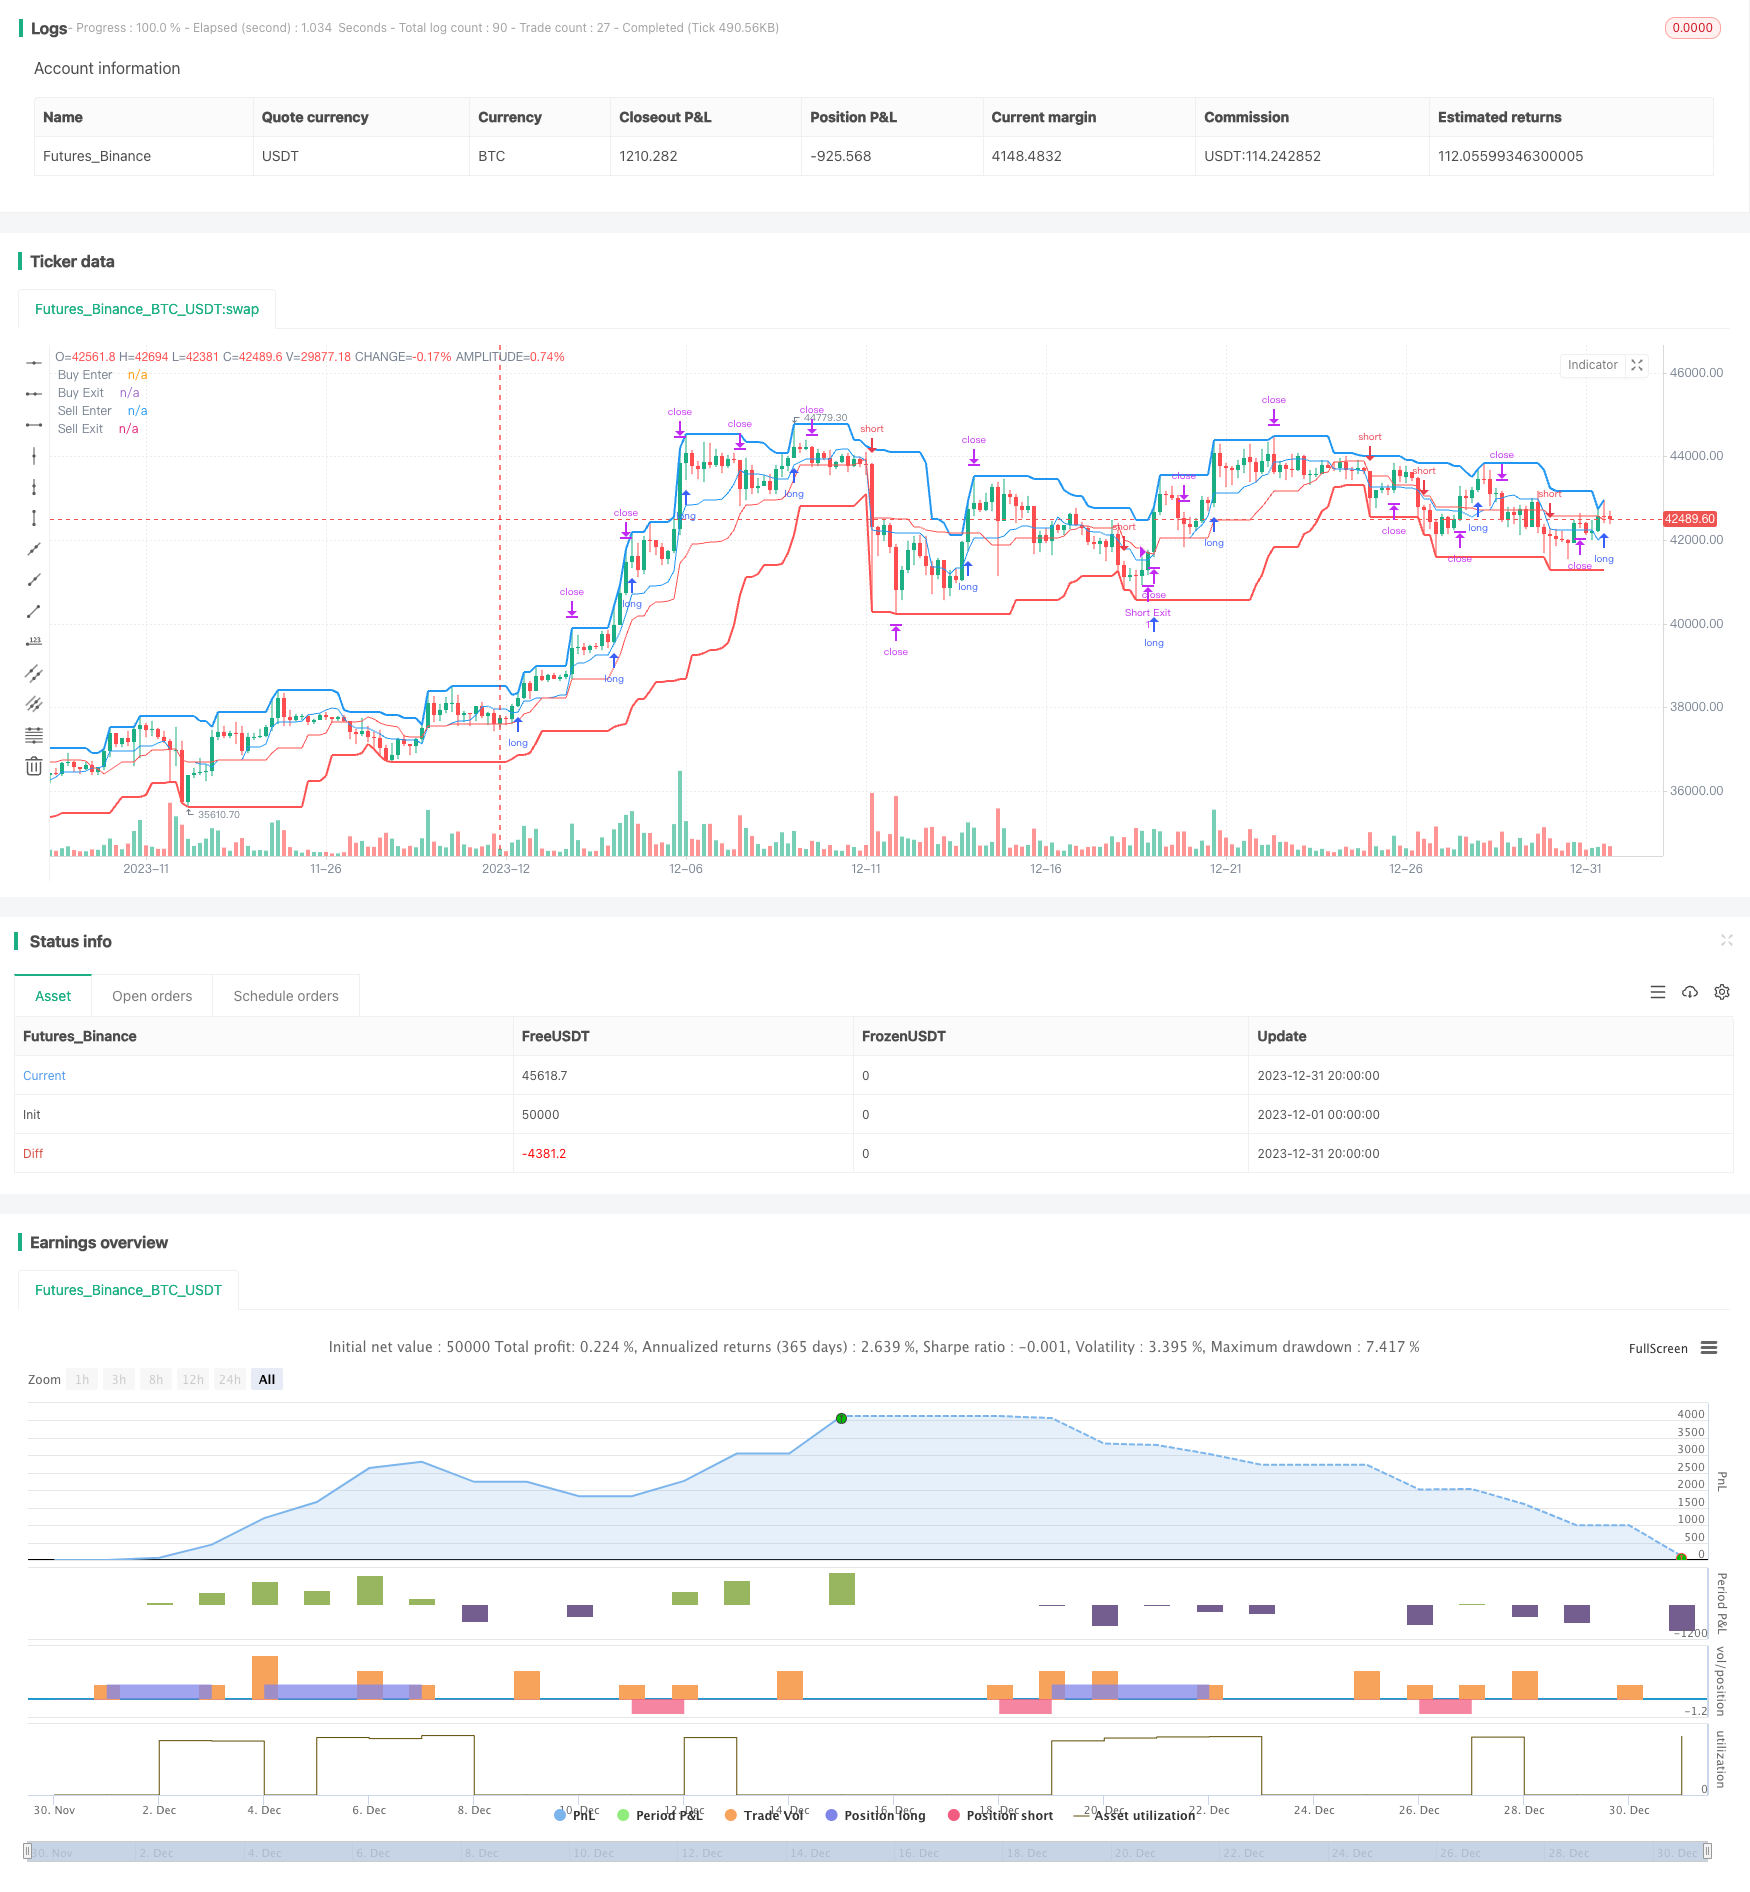
/*backtest
start: 2023-12-01 00:00:00
end: 2023-12-31 23:59:59
period: 4h
basePeriod: 15m
exchanges: [{"eid":"Futures_Binance","currency":"BTC_USDT"}]
*/

// This source code is subject to the terms of the Mozilla Public License 2.0 at https://mozilla.org/MPL/2.0/
// © algotradingcc
// Strategy testing and optimisation for free trading bot

//@version=4
strategy("Donchian Channel Strategy [for free bot]", overlay=true )

//Long optopns
buyPeriodEnter = input(10, "Channel Period for Long enter position")
buyPeriodExit = input(10, "Channel Period for Long exit position")
isMiddleBuy = input(true, "Is exit on Base Line? If 'no' - exit on bottom line")
takeProfitBuy = input(2.5, "Take Profit (%) for Long position")
isBuy = input(true, "Allow Long?")

//Short Options
sellPeriodEnter = input(20, "Channel Period for Short enter position")
sellPeriodExit = input(20, "Channel Period for Short exit position")
isMiddleSell = input(true, "Is exit on Base Line? If 'no' - exit on upper line")
takeProfitSell = input(2.5, "Take Profit (%) for Short position")
isSell = input(true, "Allow Short?")

// Test Start
startYear = input(2005, "Test Start Year")
startMonth = input(1, "Test Start Month")
startDay = input(1, "Test Start Day")
startTest = timestamp(startYear,startMonth,startDay,0,0)

//Test End
endYear = input(2050, "Test End Year")
endMonth = input(12, "Test End Month")
endDay = input(30, "Test End Day")
endTest = timestamp(endYear,endMonth,endDay,23,59)

timeRange = time > startTest and time < endTest ? true : false

// Long&Short Levels
BuyEnter = highest(buyPeriodEnter)
BuyExit = isMiddleBuy ? ((highest(buyPeriodExit) + lowest(buyPeriodExit)) / 2): lowest(buyPeriodExit)

SellEnter = lowest(sellPeriodEnter)
SellExit = isMiddleSell ? ((highest(sellPeriodExit) + lowest(sellPeriodExit)) / 2): highest(sellPeriodExit)

// Plot Data
plot(BuyEnter, style=plot.style_line, linewidth=2, color=color.blue, title="Buy Enter")
plot(BuyExit, style=plot.style_line, linewidth=1, color=color.blue, title="Buy Exit", transp=50)
plot(SellEnter, style=plot.style_line, linewidth=2, color=color.red, title="Sell Enter")
plot(SellExit, style=plot.style_line, linewidth=1, color=color.red, title="Sell Exit", transp=50)

// Calc Take Profits
TakeProfitBuy = 0.0
TakeProfitSell = 0.0
if strategy.position_size > 0
    TakeProfitBuy := strategy.position_avg_price*(1 + takeProfitBuy/100)

if strategy.position_size < 0
    TakeProfitSell := strategy.position_avg_price*(1 - takeProfitSell/100)

// Long Position
if isBuy and timeRange
    strategy.entry("Long", strategy.long, stop = BuyEnter, when = strategy.position_size == 0)

strategy.exit("Long Exit", "Long", stop=BuyExit, limit = TakeProfitBuy, when = strategy.position_size > 0)

// Short Position
if isSell and timeRange
    strategy.entry("Short", strategy.short, stop = SellEnter, when = strategy.position_size == 0)

strategy.exit("Short Exit", "Short", stop=SellExit, limit = TakeProfitSell, when = strategy.position_size < 0)

// Close & Cancel when over End of the Test
if time > endTest
    strategy.close_all()
    strategy.cancel_all()