Stratégie de capture de points bas basée sur la régression linéaire de réparation Vix
Aperçu
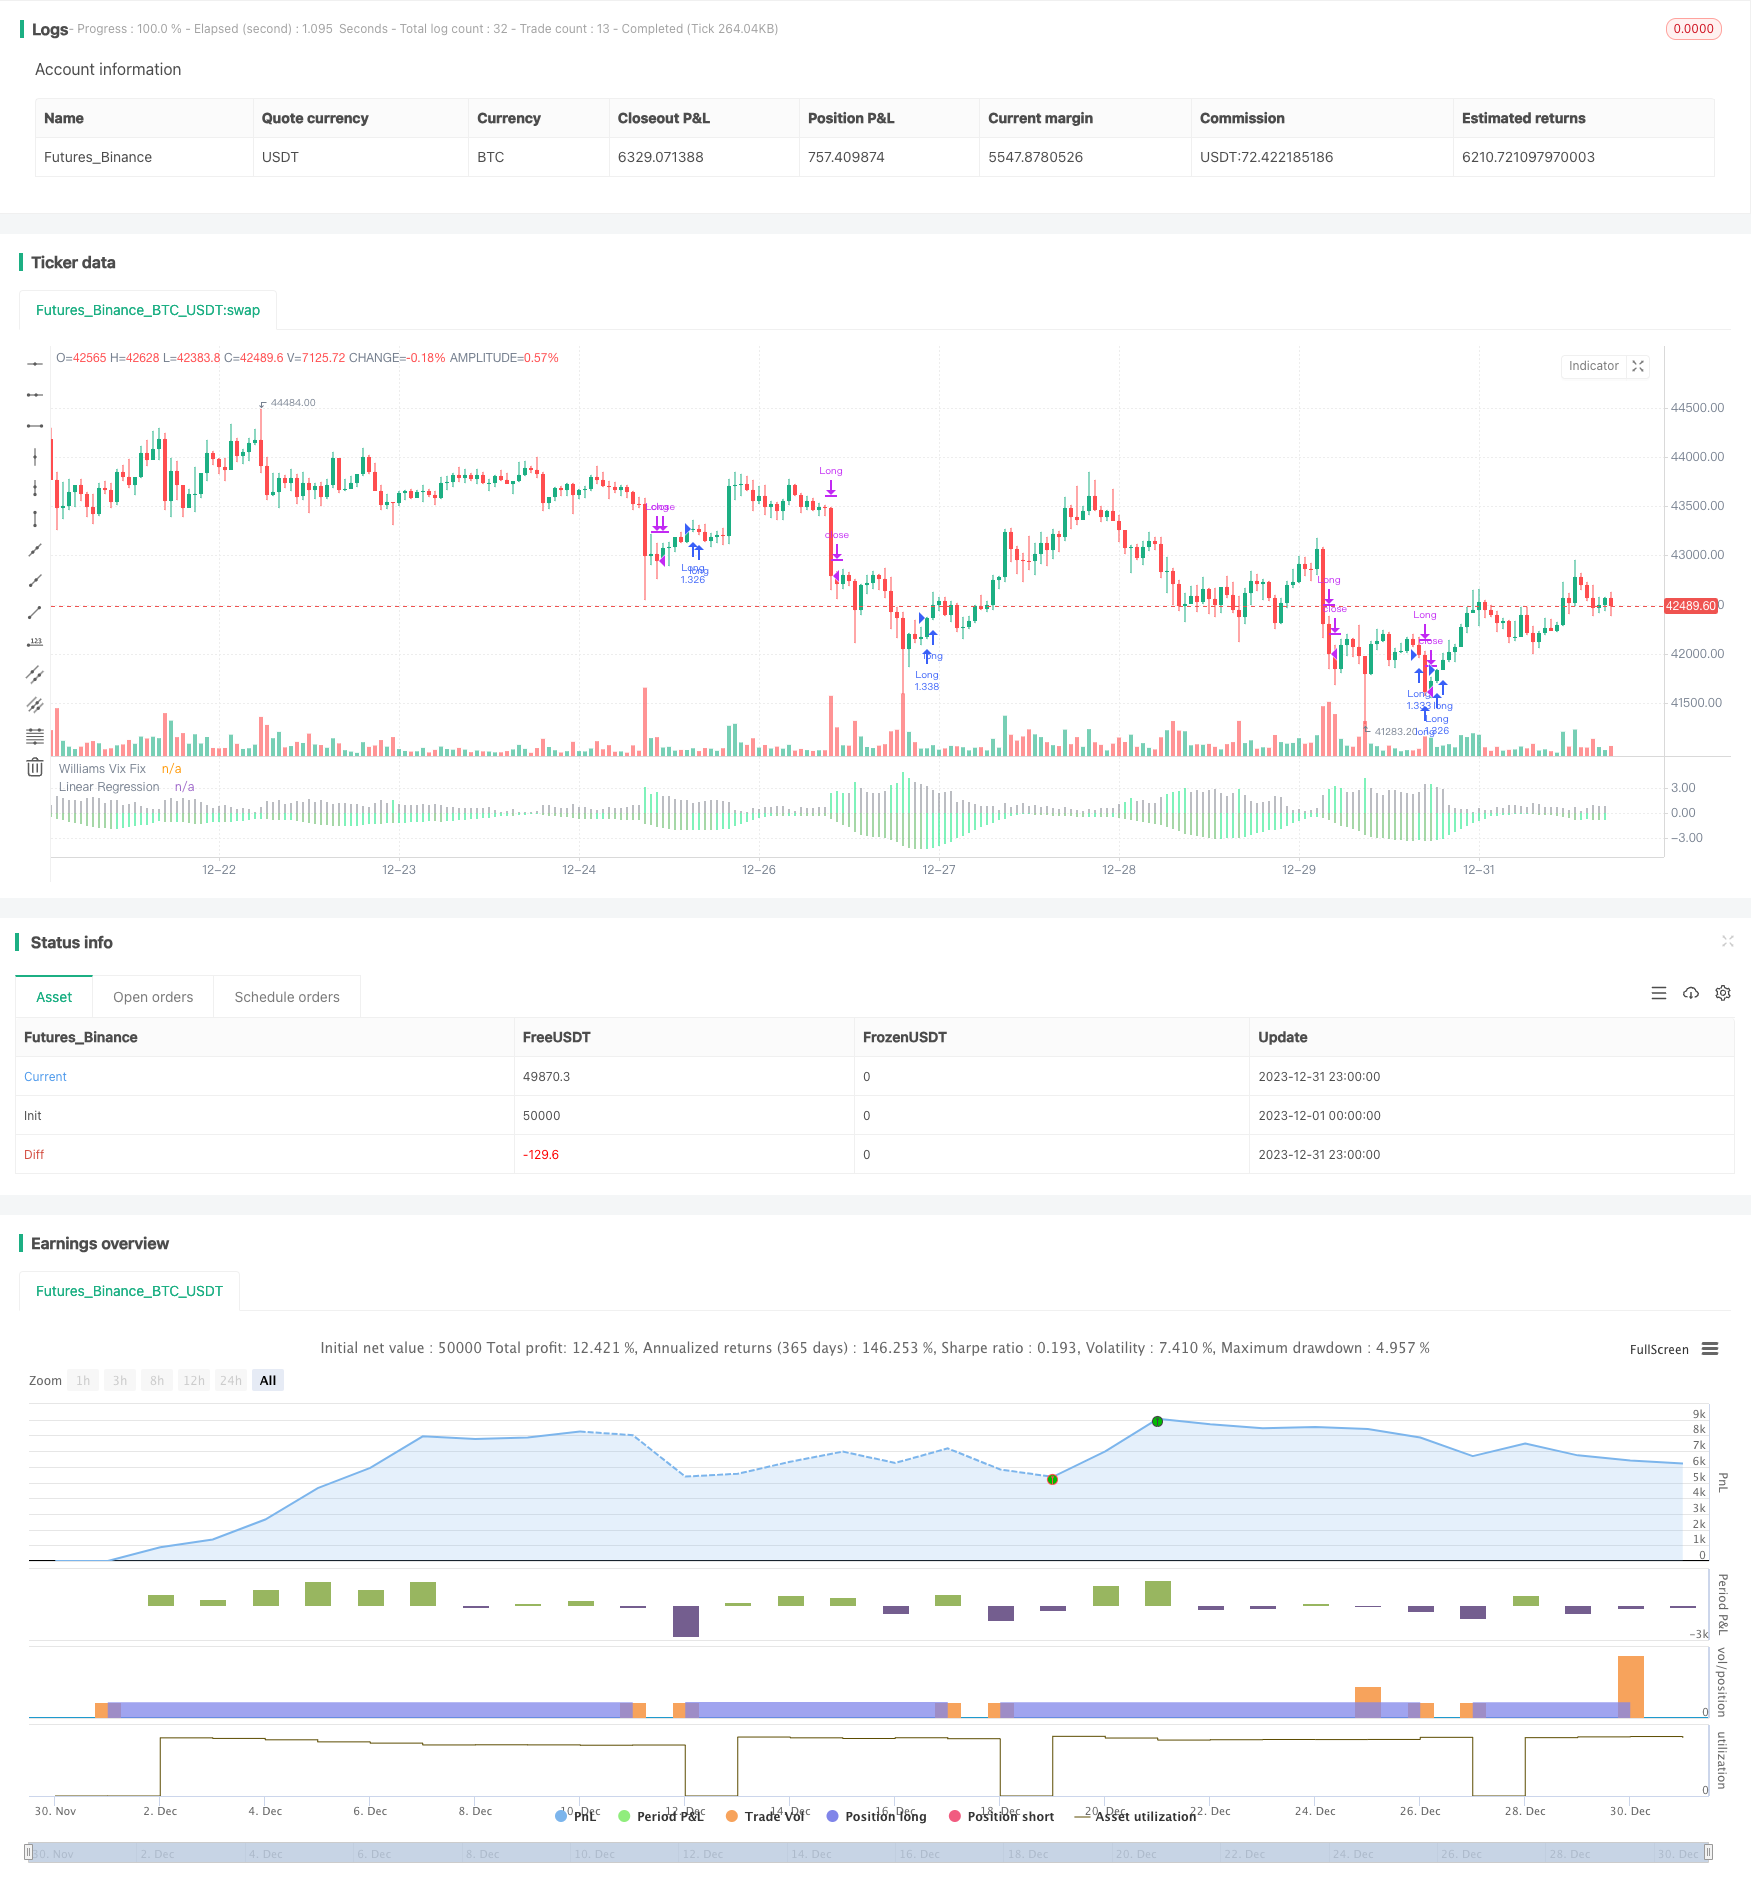
L’idée centrale de cette stratégie est de combiner l’indicateur de réparation de Wix et sa régression linéaire pour capturer avec précision les points bas du marché. La stratégie s’appelle la stratégie de réparation linéaire des points bas de la régression.
Principe de stratégie
- Calculer l’indicateur de réparation de Wix pour mieux connaître les points faibles du marché
- Appliquer la régression linéaire à l’indicateur de réparation de Wix. Lorsque l’histogramme de régression linéaire devient vert, indiquant que la régression linéaire de réparation de Wix commence à augmenter, un signal d’achat peut être émis
- En combinaison avec la colonne verte de l’indicateur de réparation de Wix, il est possible de confirmer davantage le moment de l’achat.
- Lorsque l’histogramme de régression linéaire devient rouge, indiquant que la régression linéaire de réparation de Wix commence à décliner, un signal de vente est émis.
Le processus ci-dessus utilise la régression linéaire pour améliorer l’exactitude et la rapidité des signaux de réparation de l’indicateur Wix, en filtrant certains faux signaux afin de capturer avec précision les points faibles.
Analyse des avantages
- Stratégie utilisant une régression linéaire pour filtrer les faux signaux partiels de l’indicateur de réparation Wix afin de rendre les signaux d’achat/vente plus précis et plus fiables
- La régression linéaire améliore la sensibilité et la rapidité des signaux permettant de saisir rapidement les points de basculement du marché.
- La logique de la stratégie est simple et claire, facile à comprendre, adaptée aux transactions quantitatives
- Plus de paramètres configurables et plus de flexibilité pour s’adapter aux évolutions du marché
Risques et solutions
- Cette stratégie est principalement utilisée pour déterminer les points faibles du marché dans son ensemble et ne convient pas aux actions individuelles.
- La régression linéaire ne peut pas filtrer complètement les faux signaux, et la combinaison des indicateurs de réparation de Wix peut réduire le risque.
- Il est nécessaire d’ajuster les paramètres de manière appropriée pour s’adapter à l’évolution de la situation et éviter les défaillances.
- Recommandé en combinaison avec d’autres indicateurs pour une confirmation plus approfondie du signal
Direction d’optimisation
- On peut envisager une combinaison avec un indicateur de fluctuation ou un indicateur de quantité d’énergie pour filtrer davantage le signal
- Il est possible d’étudier des méthodes d’optimisation adaptative des paramètres pour rendre les stratégies plus intelligentes.
- Des méthodes d’apprentissage automatique peuvent être explorées pour prédire le mouvement des réparations de Wix à l’aide de modèles plus complexes.
- On pourrait essayer de faire quelque chose de similaire avec des actions individuelles pour étudier comment filtrer les faux signaux.
Résumer
La stratégie utilise la régression linéaire pour améliorer la qualité du signal, permettant ainsi de capturer efficacement les faiblesses du marché. La stratégie est simple et pratique, les résultats sont idéaux, le risque principal est que les faux signaux ne soient pas complètement filtrés. Nous devons encore optimiser les paramètres et envisager d’introduire d’autres moyens de confirmer davantage les signaux, ce qui rend la stratégie plus complète.
/*backtest
start: 2023-12-01 00:00:00
end: 2023-12-31 23:59:59
period: 1h
basePeriod: 15m
exchanges: [{"eid":"Futures_Binance","currency":"BTC_USDT"}]
*/

// This source code is subject to the terms of the Mozilla Public License 2.0 at https://mozilla.org/MPL/2.0/
// © HeWhoMustNotBeNamed

//@version=4
strategy("VixFixLinReg-Strategy", shorttitle="VixFixLinReg - Strategy",
                     overlay=false, initial_capital = 100000,
                     default_qty_type = strategy.percent_of_equity, default_qty_value = 100, commission_type = strategy.commission.percent, pyramiding = 1,
                     commission_value = 0.01)
pd = input(22, title="LookBack Period Standard Deviation High")
bbl = input(20, title="Bolinger Band Length")
mult = input(2.0    , minval=1, maxval=5, title="Bollinger Band Standard Devaition Up")
lb = input(50  , title="Look Back Period Percentile High")
ph = input(.85, title="Highest Percentile - 0.90=90%, 0.95=95%, 0.99=99%")
pl = input(1.01, title="Lowest Percentile - 1.10=90%, 1.05=95%, 1.01=99%")
hp = input(false, title="Show High Range - Based on Percentile and LookBack Period?")
sd = input(false, title="Show Standard Deviation Line?")
i_startTime = input(defval = timestamp("01 Jan 2010 00:00 +0000"), title = "Start Time", type = input.time)
i_endTime = input(defval = timestamp("01 Jan 2099 00:00 +0000"), title = "End Time", type = input.time)
inDateRange = true
considerVIXFixClose = input(false)
lengthKC=input(20, title="KC Length")
multKC = input(1.5, title="KC MultFactor")

atrLen = input(22)
atrMult = input(5)
initialStopBar = input(5)
waitForCloseBeforeStop = input(true)
f_getStop(atrLen, atrMult)=>
    stop = strategy.position_size > 0 ? close - (atrMult * atr(atrLen)) : lowest(initialStopBar)
    stop := strategy.position_size > 0 ? max(stop,nz(stop[1], stop)) : lowest(initialStopBar)
    stop

wvf = ((highest(close, pd)-low)/(highest(close, pd)))*100

sDev = mult * stdev(wvf, bbl)
midLine = sma(wvf, bbl)
lowerBand = midLine - sDev
upperBand = midLine + sDev

rangeHigh = (highest(wvf, lb)) * ph
rangeLow = (lowest(wvf, lb)) * pl


col = wvf >= upperBand or wvf >= rangeHigh ? color.lime : color.gray

val = linreg(wvf, pd, 0)
absVal = abs(val)

linRegColor = val>val[1]? (val > 0 ? color.green : color.orange): (val > 0 ? color.lime : color.red)
plot(hp and rangeHigh ? rangeHigh : na, title="Range High Percentile", style=plot.style_line, linewidth=4, color=color.orange)
plot(hp and rangeLow ? rangeLow : na, title="Range High Percentile", style=plot.style_line, linewidth=4, color=color.orange)
plot(wvf, title="Williams Vix Fix", style=plot.style_histogram, linewidth = 4, color=col)
plot(sd and upperBand ? upperBand : na, title="Upper Band", style=plot.style_line, linewidth = 3, color=color.aqua)

plot(-absVal, title="Linear Regression", style=plot.style_histogram, linewidth=4, color=linRegColor)

vixFixState = (col == color.lime) ? 1: 0
vixFixState := strategy.position_size == 0? max(vixFixState, nz(vixFixState[1],0)) : vixFixState

longCondition = (vixFixState == 1 and linRegColor == color.lime) and inDateRange
exitLongCondition = (linRegColor == color.orange or linRegColor == color.red) and considerVIXFixClose

stop = f_getStop(atrLen, atrMult)
label_x = time+(60*60*24*1000*20)
myLabel = label.new(x=label_x, y=0, text="Stop : "+tostring(stop), xloc=xloc.bar_time, style=label.style_none, textcolor=color.black, size=size.normal)
label.delete(myLabel[1])
strategy.entry("Long", strategy.long, when=longCondition, oca_name="oca_buy")
strategy.close("Long", when=exitLongCondition or (close < stop and waitForCloseBeforeStop and linRegColor == color.green))
strategy.exit("ExitLong", "Long", stop = stop, when=not waitForCloseBeforeStop and linRegColor == color.green)