Stratégie de suivi du momentum sur plusieurs périodes
Aperçu
Cette stratégie permet le suivi de la dynamique à travers les cadres temporels en combinant le 123 inverse et le MACD. Le 123 inverse détermine le point de renversement de la tendance à court terme, le MACD détermine la tendance à moyen terme, les deux combinés pour réaliser un signal plus clair de tendance à moyen terme tout en bloquant le renversement à court terme.
Principe de stratégie
La stratégie est composée de deux volets:
123 Partie inverse: les deux lignes K actuelles forment des hauts/bas et génèrent un signal d’achat/vente lorsque l’indicateur est au hasard inférieur/supérieur à 50.
Partie MACD: le passage de la ligne lente sur la ligne rapide génère un signal d’achat et celui de la ligne lente sous la ligne rapide génère un signal de vente.
Enfin, les deux sont combinés, c’est-à-dire que lorsque 123 inverse, le MACD génère également un signal synchrone, le signal final est émis.
Analyse des avantages
Cette stratégie combine des retournements à court terme et des tendances à moyen et long terme, permettant de piéger les tendances à moyen et long terme dans les fluctuations à court terme, ce qui permet d’obtenir un taux de victoire plus élevé. En particulier, dans des conditions de choc, le retournement 123 peut éliminer une partie du bruit, ce qui améliore la stabilité.
En ajustant les paramètres, il est possible d’équilibrer le rapport entre les signaux de retournement et les signaux de tendance pour s’adapter à différents environnements de marché.
Analyse des risques
La stratégie présente un certain retard de temps, en particulier lorsque l’on utilise un MACD à long terme, et peut manquer des événements à court terme. De plus, le signal de renversement est lui-même assez aléatoire et peut être facilement piégé.
Le cycle MACD peut être raccourci de manière appropriée ou le stop loss peut être augmenté pour contrôler le risque.
Direction d’optimisation
Cette stratégie peut être optimisée dans les domaines suivants:
Adaptation des paramètres de retournement 123 pour optimiser le retour
Modifier les paramètres MACD pour optimiser le jugement des tendances
Ajout de filtres sur d’autres indicateurs auxiliaires pour une meilleure efficacité
Augmenter les stratégies de prévention des pertes et contrôler les risques
Résumer
Cette stratégie intègre plusieurs paramètres et indicateurs techniques de plusieurs périodes de temps, en équilibrant les avantages de l’inversion et du trading de tendance par le suivi de la dynamique sur plusieurs périodes de temps. L’effet d’équilibre peut être ajusté à travers les paramètres et peut être optimisé par l’introduction de plus d’indicateurs ou de stop-loss, une idée de stratégie très potentielle.
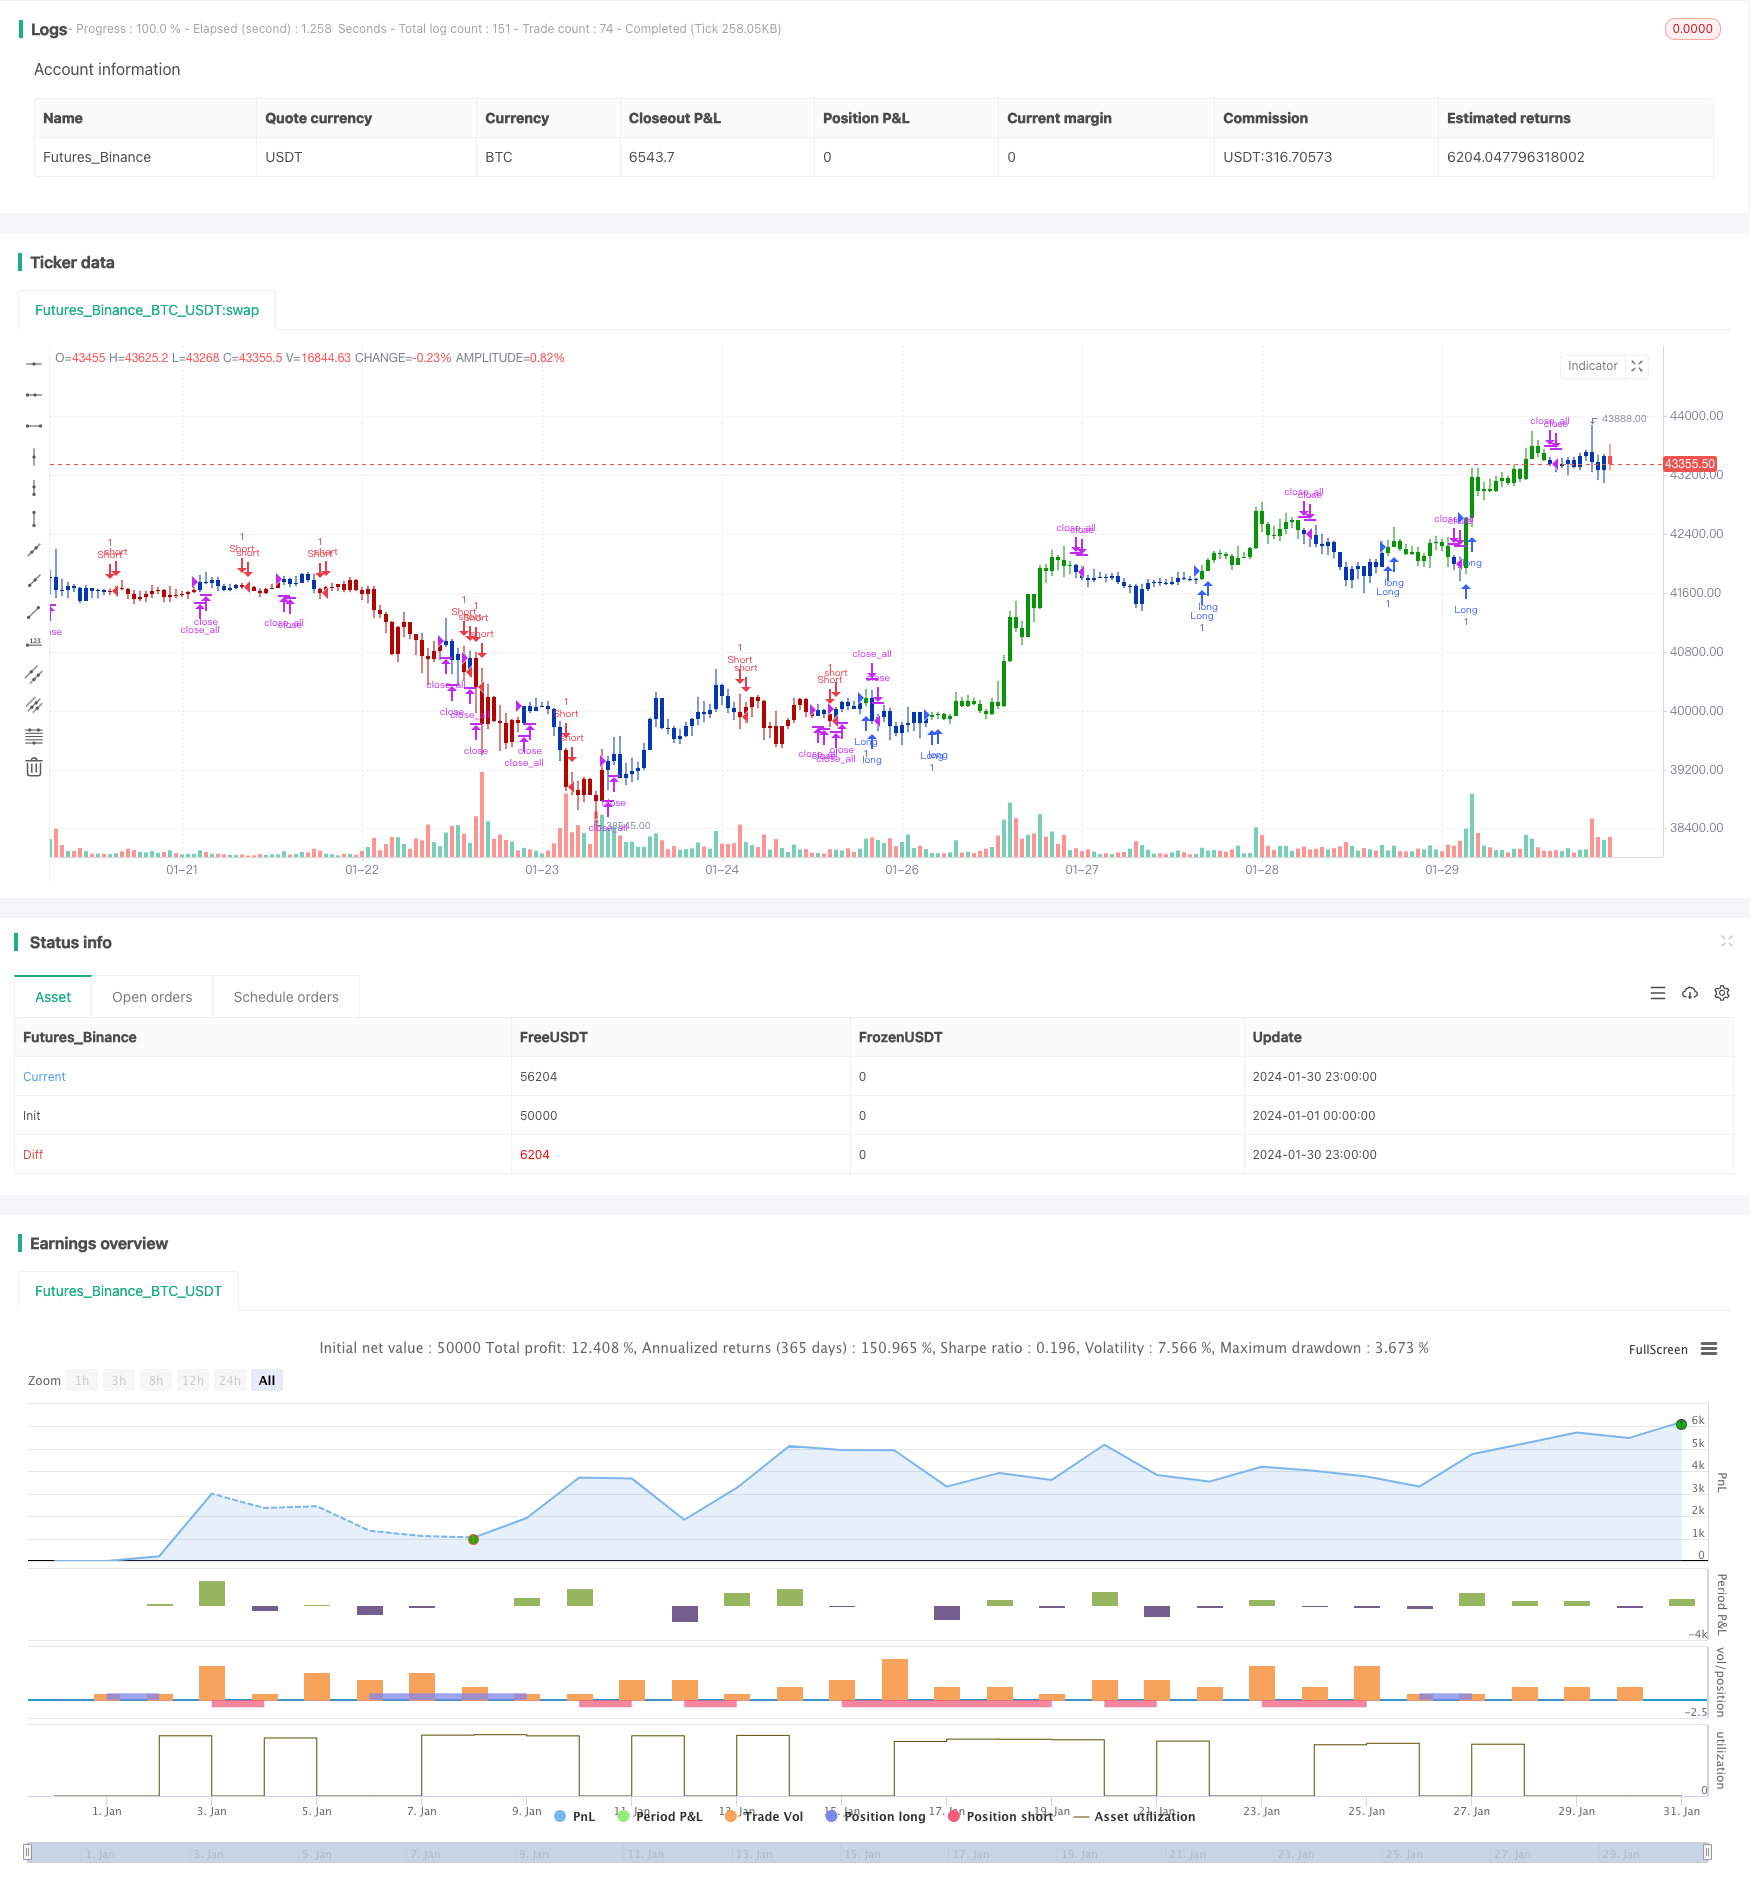
/*backtest
start: 2024-01-01 00:00:00
end: 2024-01-31 00:00:00
period: 1h
basePeriod: 15m
exchanges: [{"eid":"Futures_Binance","currency":"BTC_USDT"}]
*/

//@version=4
////////////////////////////////////////////////////////////
//  Copyright by HPotter v1.0 28/01/2021
// This is combo strategies for get a cumulative signal.
//
// First strategy
// This System was created from the Book "How I Tripled My Money In The
// Futures Market" by Ulf Jensen, Page 183. This is reverse type of strategies.
// The strategy buys at market, if close price is higher than the previous close
// during 2 days and the meaning of 9-days Stochastic Slow Oscillator is lower than 50.
// The strategy sells at market, if close price is lower than the previous close price
// during 2 days and the meaning of 9-days Stochastic Fast Oscillator is higher than 50.
//
// Second strategy
// MACD – Moving Average Convergence Divergence. The MACD is calculated
// by subtracting a 26-day moving average of a security's price from a
// 12-day moving average of its price. The result is an indicator that
// oscillates above and below zero. When the MACD is above zero, it means
// the 12-day moving average is higher than the 26-day moving average.
// This is bullish as it shows that current expectations (i.e., the 12-day
// moving average) are more bullish than previous expectations (i.e., the
// 26-day average). This implies a bullish, or upward, shift in the supply/demand
// lines. When the MACD falls below zero, it means that the 12-day moving average
// is less than the 26-day moving average, implying a bearish shift in the
// supply/demand lines.
// A 9-day moving average of the MACD (not of the security's price) is usually
// plotted on top of the MACD indicator. This line is referred to as the "signal"
// line. The signal line anticipates the convergence of the two moving averages
// (i.e., the movement of the MACD toward the zero line).
// Let's consider the rational behind this technique. The MACD is the difference
// between two moving averages of price. When the shorter-term moving average rises
// above the longer-term moving average (i.e., the MACD rises above zero), it means
// that investor expectations are becoming more bullish (i.e., there has been an
// upward shift in the supply/demand lines). By plotting a 9-day moving average of
// the MACD, we can see the changing of expectations (i.e., the shifting of the
// supply/demand lines) as they occur.
//
// WARNING:
// - For purpose educate only
// - This script to change bars colors.
////////////////////////////////////////////////////////////
Reversal123(Length, KSmoothing, DLength, Level) =>
    vFast = sma(stoch(close, high, low, Length), KSmoothing)
    vSlow = sma(vFast, DLength)
    pos = 0.0
    pos := iff(close[2] < close[1] and close > close[1] and vFast < vSlow and vFast > Level, 1,
	         iff(close[2] > close[1] and close < close[1] and vFast > vSlow and vFast < Level, -1, nz(pos[1], 0)))
	pos

MACD(fastLength,slowLength,signalLength) =>
    pos = 0.0
    fastMA = ema(close, fastLength)
    slowMA = ema(close, slowLength)
    macd = fastMA - slowMA
    signal = sma(macd, signalLength)
    pos:= iff(signal < macd , 1,
	       iff(signal > macd, -1, nz(pos[1], 0)))
    pos

strategy(title="Combo Backtest 123 Reversal & MACD Crossover", shorttitle="Combo", overlay = true)
line1 = input(true, "---- 123 Reversal ----")
Length = input(14, minval=1)
KSmoothing = input(1, minval=1)
DLength = input(3, minval=1)
Level = input(50, minval=1)
//-------------------------
fastLength = input(8, minval=1)
slowLength = input(16,minval=1)
signalLength=input(11,minval=1)
xSeria = input(title="Source", type=input.source, defval=close)
reverse = input(false, title="Trade reverse")
posReversal123 = Reversal123(Length, KSmoothing, DLength, Level)
posMACD = MACD(fastLength,slowLength, signalLength)
pos = iff(posReversal123 == 1 and posMACD == 1 , 1,
	   iff(posReversal123 == -1 and posMACD == -1, -1, 0))
possig = iff(reverse and pos == 1, -1,
          iff(reverse and pos == -1 , 1, pos))
if (possig == 1)
    strategy.entry("Long", strategy.long)
if (possig == -1)
    strategy.entry("Short", strategy.short)
if (possig == 0)
    strategy.close_all()
barcolor(possig == -1 ? #b50404: possig == 1 ? #079605 : #0536b3 )