Stratégie de stop loss de canal de prix dynamique
Aperçu
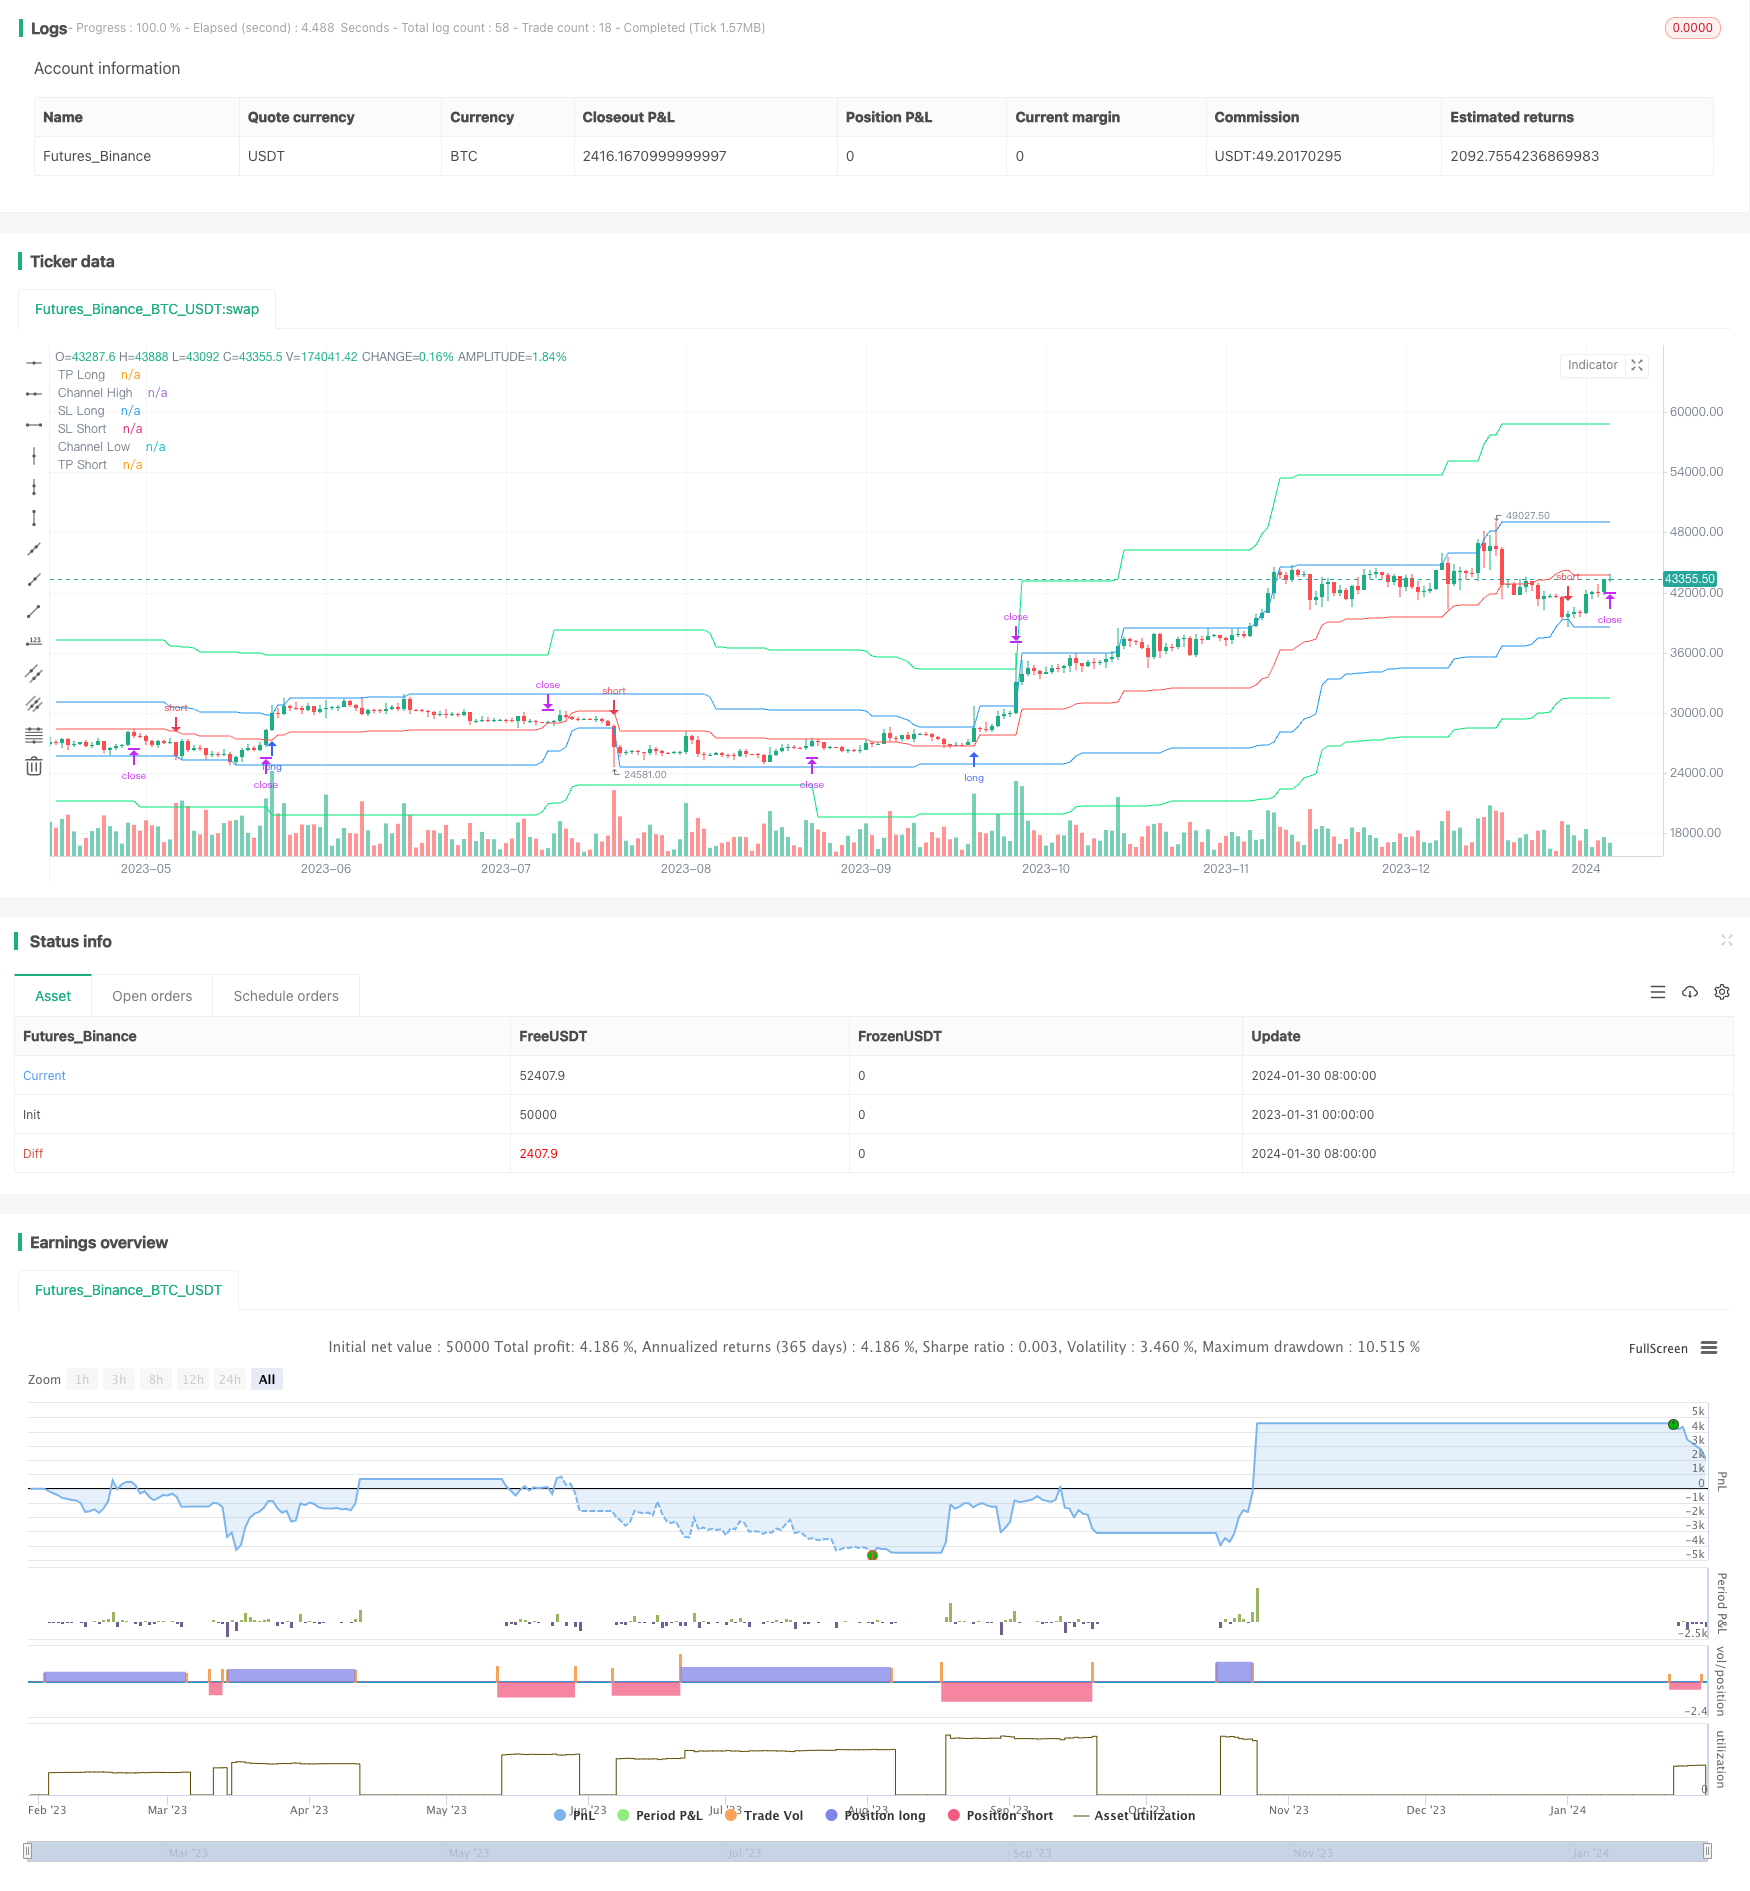
Cette stratégie est basée sur l’indicateur de canal de prix de Donchian. L’indicateur forme un canal de prix en calculant le prix le plus élevé et le prix le plus bas d’un certain cycle. La stratégie utilise le canal de prix pour réaliser des transactions bidirectionnelles et définit des prix d’arrêt et de rupture.
Principe de stratégie
Tout d’abord, la stratégie calcule la limite supérieure h et la limite inférieure l de la chaîne de prix en fonction des paramètres pclen. centre de la ligne médiane est la moyenne de la limite supérieure et inférieure de la chaîne de prix. Ensuite, en fonction des paramètres de blocage tp pour les positions longues et les positions vides, elle calcule les prix d’arrêt tpl et tps.
La logique des transactions est la suivante:
Signaux d’ouverture d’une position sur le marché: le prix est supérieur à la limite supérieure de la porte h et ouvre une position sur le marché lorsqu’il revient à l’intérieur de la porte Signaux de plafonnement de plus de la position: plafonnement de plus de la position lorsque le prix est inférieur au centre de la ligne médiane du canal (stop loss) ou supérieur au prix d’arrêt (stop loss)
Signaux d’ouverture d’un emplacement vide: prix inférieur à la limite inférieure de l et retour à l’intérieur de la passerelle lorsque l’emplacement est vide Signaux de plafonnement des positions vides: les prix sont supérieurs au centre de la ligne médiane du canal (stop loss) ou inférieurs au prix d’arrêt tps (stop stop) lorsque les positions vides sont à plat
Analyse des avantages
Cette stratégie présente les avantages suivants:
- Les échanges bidirectionnels permettent de capturer le renversement de tendance des prix
- Les canaux de prix sont utilisés pour déterminer la direction de la tendance et éviter les fausses ruptures.
- Régler le stop loss et maîtriser le risque
- Calculer la taille de la position associée à la taille du risque, pour que le risque soit maîtrisé
- Le suivi des arrêts et des pertes permet de verrouiller plus de bénéfices
Analyse des risques
Cette stratégie comporte aussi des risques:
- Une mauvaise configuration des paramètres de la chaîne de prix peut entraîner une fréquence de transaction excessive ou des opportunités de transaction manquées
- La tolérance excessive des prix d’arrêt pourrait accroître la marge de risque
- Les arrêts de suivi peuvent être déclenchés plus tôt en période de forte volatilité
Ces risques peuvent être réduits et maîtrisés par l’ajustement des paramètres et la surveillance manuelle.
Direction d’optimisation
Cette stratégie peut également être optimisée dans les domaines suivants:
- Ajout de filtres pour plus d’indicateurs afin d’éviter de faire de fréquentes opérations de clôture en période de choc
- Il est possible de tester différents algorithmes de stop-loss, comme le stop-loss ATR.
- Élargissement à un système de négociation sur des périodes de temps plus avancées pour déterminer la direction des tendances
- Ajout d’un module de gestion de position pour ajuster les positions en fonction du taux d’utilisation des fonds
- Un modèle d’apprentissage automatique pour déterminer le taux de réussite des ruptures de prix et éviter les fausses ruptures
Résumer
Cette stratégie est globalement une méthode efficace pour réaliser des transactions bidirectionnelles en utilisant les indicateurs de la chaîne de prix. Elle dispose d’un module de contrôle de stop loss et de position, ce qui permet de bien contrôler le risque. Avec une certaine optimisation et ajustement, elle peut devenir une stratégie de trading quantitative puissante.
/*backtest
start: 2023-01-31 00:00:00
end: 2024-01-31 00:00:00
period: 1d
basePeriod: 1h
exchanges: [{"eid":"Futures_Binance","currency":"BTC_USDT"}]
*/

//Noro
//2020

//@version=4
strategy(title = "Noro's RiskDonchian Strategy", shorttitle = "RiskDonchian str", overlay = true, default_qty_type = strategy.percent_of_equity, initial_capital = 100, default_qty_value = 100, commission_value = 0.1)

//Settings
needlong = input(true, defval = true, title = "Long")
needshort = input(true, defval = true, title = "Short")
tp = input(defval = 20.0, minval = 1, title = "Take-profit, %")
tptype = input(defval = "2. Fix", options = ["1. None", "2. Fix", "3. Trailing"], title = "Take-profit type")
sltype = input(defval = "2. Center", options = ["1. None", "2. Center"], title = "Take-profit type")
risklong  = input(5.0, minval = 0.0, maxval = 99.9, title = "Risk size for long, %")
riskshort = input(5.0, minval = 0.0, maxval = 99.9, title = "Risk size for short, %")
pclen = input(50, minval = 1, title = "Price Channel Length")
showll = input(true, defval = true, title = "Show lines")
showbg = input(false, defval = false, title = "Show Background")
showof = input(true, defval = true, title = "Show Offset")
showlabel = input(true, defval = true, title = "Show label")
fromyear = input(1900, defval = 1900, minval = 1900, maxval = 2100, title = "From Year")
toyear = input(2100, defval = 2100, minval = 1900, maxval = 2100, title = "To Year")
frommonth = input(01, defval = 01, minval = 01, maxval = 12, title = "From Month")
tomonth = input(12, defval = 12, minval = 01, maxval = 12, title = "To Month")
fromday = input(01, defval = 01, minval = 01, maxval = 31, title = "From day")
today = input(31, defval = 31, minval = 01, maxval = 31, title = "To day")

//Price Channel
h = highest(high, pclen)
l = lowest(low, pclen)
center = (h + l) / 2

//Take-profit
tpl = 0.0
tpl := tptype == "2. Fix" and strategy.position_size > 0 ? tpl[1] : h * (100 + tp) / 100

//Stop-loss
tps = 0.0
tps := tptype == "2. Fix" and strategy.position_size < 0 ? tps[1] : l * (100 - tp) / 100

//Lines
tplcol = showll and needlong and tptype != "1. None" ? color.lime : na
pclcol = showll and needlong ? color.blue : na
sllcol = showll and needlong and sltype != "1. None" ? color.red : na
tpscol = showll and needshort and tptype != "1. None" ? color.lime : na
pcscol = showll and needshort ? color.blue : na
slscol = showll and needshort and sltype != "1. None" ? color.red : na
offset = showof ? 1 : 0
plot(tpl, offset = offset, color = tplcol, title = "TP Long")
plot(h, offset = offset, color = pclcol, title = "Channel High")
plot(center, offset = offset, color = sllcol, title = "SL Long")
plot(center, offset = offset, color = slscol, title = "SL Short")
plot(l, offset = offset, color = pcscol, title = "Channel Low")
plot(tps, offset = offset, color = tpscol, title = "TP Short")

//Background
size = strategy.position_size
bgcol = showbg == false ? na : size > 0 ? color.lime : size < 0 ? color.red : na
bgcolor(bgcol, transp = 70)

//Lot size
risksizelong = -1 * risklong
risklonga = ((center / h) - 1) * 100
coeflong = abs(risksizelong / risklonga)
lotlong = (strategy.equity / close) * coeflong
risksizeshort = -1 * riskshort
riskshorta = ((center / l) - 1) * 100
coefshort = abs(risksizeshort / riskshorta)
lotshort = (strategy.equity / close) * coefshort

//Trading
truetime = time > timestamp(fromyear, frommonth, fromday, 00, 00) and time < timestamp(toyear, tomonth, today, 23, 59)
mo = 0
mo := strategy.position_size != 0 ? 0 : high >= center[1] and low <= center[1] ? 1 : mo[1]

if h > 0
    longlimit = tptype == "1. None" ? na : tpl
    longstop = sltype == "1. None" ? na : center
    strategy.entry("Long", strategy.long, lotlong, stop = h, when = strategy.position_size <= 0 and needlong and truetime and mo)
    strategy.exit("TP Long", "Long", limit = longlimit, stop = longstop)
    shortlimit = tptype == "1. None" ? na : tps
    shortstop = sltype == "1. None" ? na : center
    strategy.entry("Short", strategy.short, lotshort, stop = l, when = strategy.position_size >= 0 and needshort and truetime and mo)
    strategy.exit("Exit Short", "Short", limit = shortlimit, stop = shortstop)
if time > timestamp(toyear, tomonth, today, 23, 59)
    strategy.close_all()
    strategy.cancel("Long")
    strategy.cancel("Short")

if showlabel

    //Drawdown
    max = 0.0
    max := max(strategy.equity, nz(max[1]))
    dd = (strategy.equity / max - 1) * 100
    min = 100.0
    min := min(dd, nz(min[1]))

    //Label
    min := round(min * 100) / 100
    labeltext = "Drawdown: " + tostring(min) + "%"
    var label la = na
    label.delete(la)
    tc = min > -100 ? color.white : color.red
    osx = timenow + round(change(time)*10)
    osy = highest(100)