Stratégie quantitative basée sur le pivot de Kamachira et les bandes de Bollinger

1
Follow
1782
Followers
Aperçu
La stratégie calcule d'abord l'axe de Camachilla sur la base du prix le plus élevé, le prix le plus bas et le prix de clôture du jour de négociation précédent. Ensuite, elle filtre les prix en combinaison avec l'indicateur de la bande de Brin, générant un signal de transaction lorsque les prix franchissent l'axe.
Principe de stratégie
- Calculer le prix le plus élevé, le prix le plus bas et le prix de clôture du jour précédent
- Calculer l'axe de Camachira selon la formule H4, H3, H2 et H1 et L1, L2, L3 et L4
- Calcul du 20e jour: Brin sur et en bas de la voie
- Faire plus quand le prix monte et fait moins quand il descend
- Le point d'arrêt est situé à proximité de la bande de Bryn sur ou en dessous de la voie
Analyse des avantages
- L'axe de Camachilla contient plusieurs points de résistance de soutien clés pour améliorer la fiabilité des signaux de transaction
- Combiné à l'indicateur de la ceinture de Brin, il permet de filtrer efficacement les fausses percées.
- Plus de portfolios, plus de flexibilité de négociation
Analyse des risques
- Une mauvaise configuration des paramètres de l'indicateur de la ceinture de Brin peut entraîner une erreur de signal de transaction
- Le calcul des points critiques de l'axe de Camachilla dépend du prix du jour précédent et peut être influencé par des sauts de nuit
- Les opérations à plusieurs têtes sont risquées.
Direction d'optimisation
- Optimiser les paramètres de la bande de Bryn pour trouver la meilleure combinaison de paramètres
- Combiné à d'autres indicateurs de filtrage de faux signaux de rupture
- Augmentation des stratégies de stop loss et réduction des pertes individuelles
Résumer
La stratégie utilise l'axe de la camomille et l'indicateur de la ceinture de Brin pour générer des signaux de négociation lorsque le prix franchit les points de résistance de soutien critique. La rentabilité et la stabilité de la stratégie peuvent être améliorées par l'optimisation des paramètres et le filtrage des signaux.
Source
Pine
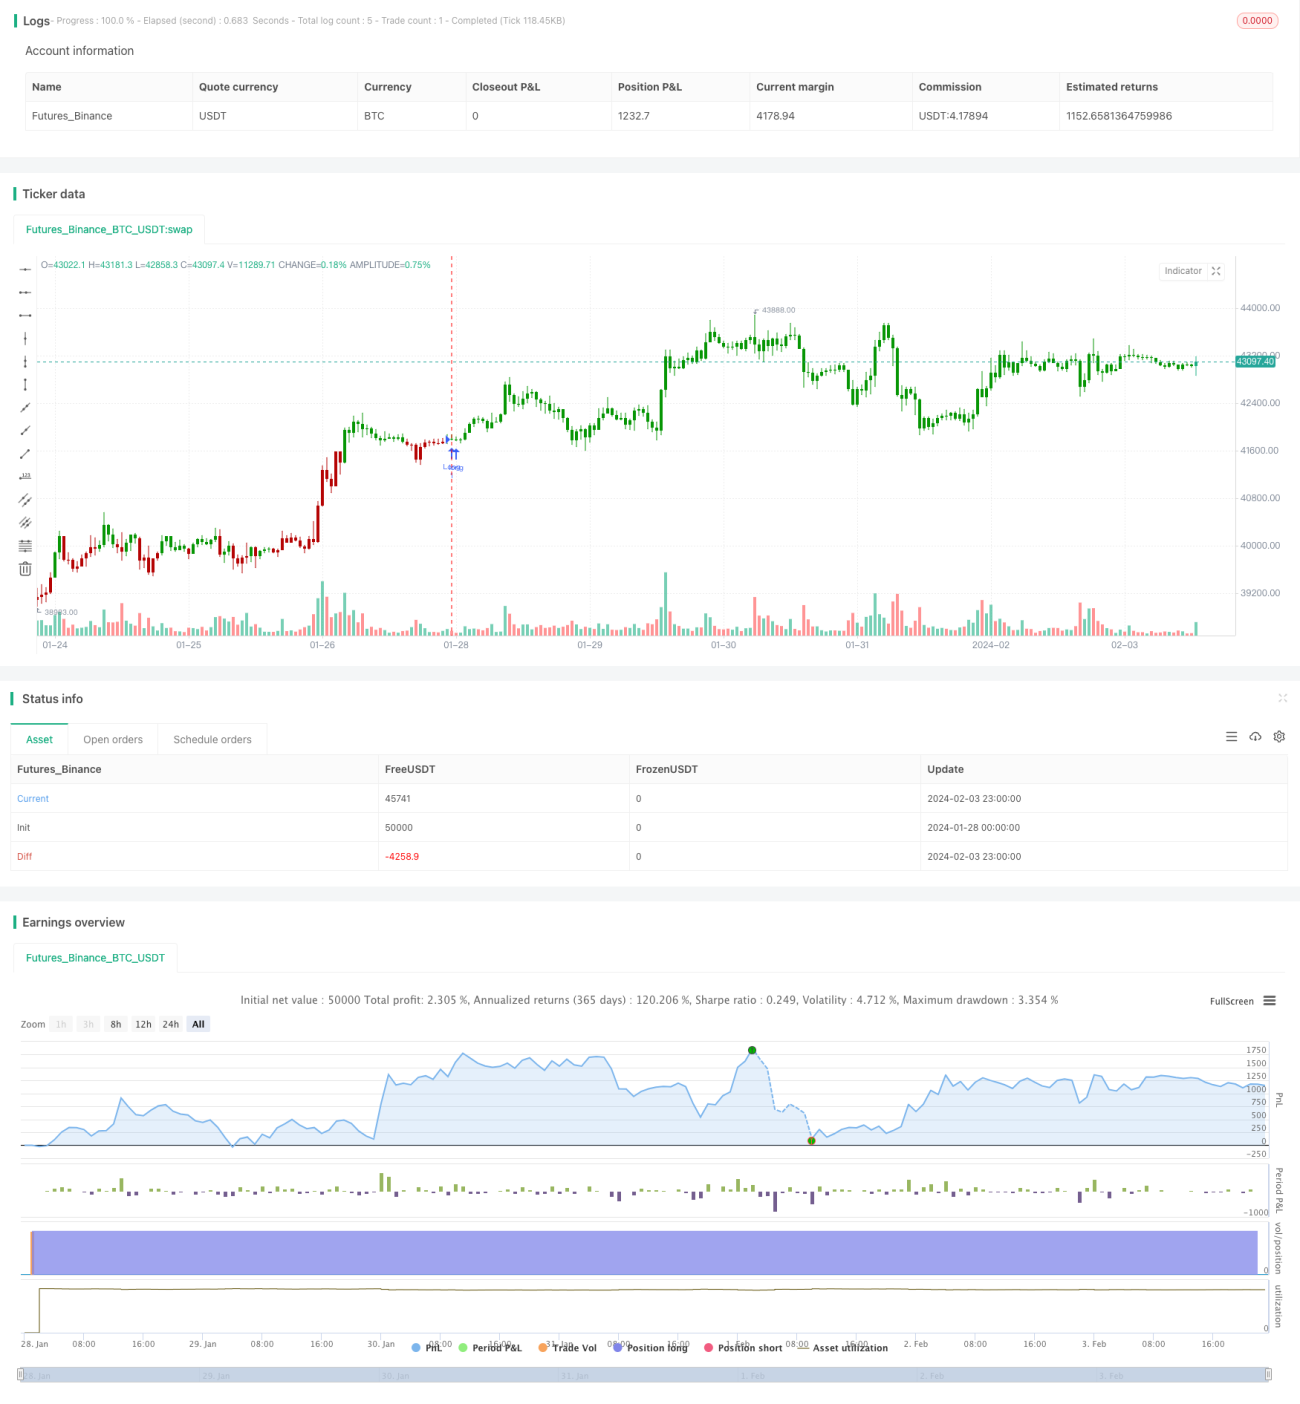
/*backtest
start: 2024-01-28 00:00:00
end: 2024-02-04 00:00:00
period: 1h
basePeriod: 15m
exchanges: [{"eid":"Futures_Binance","currency":"BTC_USDT"}]
*/

//@version=4
////////////////////////////////////////////////////////////
//  Copyright by HPotter v1.0 12/05/2020
// Camarilla pivot point formula is the refined form of existing classic pivot point formula. Strategy parameters
Related strategies
Comment
All comments (0)
No data
- 1