Stratégie de momentum révolutionnaire basée sur la moyenne mobile du Golden Cross
Aperçu
La stratégie est basée sur les moyennes mobiles indicielles du 12e jour (EMA) et la fourche de l’EMA du 26e jour comme signal d’entrée. Pour filtrer les fausses percées, la stratégie introduit également l’indicateur MACD pour déterminer la tendance du marché et l’indicateur RSI pour déterminer si le marché est en zone de survente.
En ce qui concerne l’arrêt des pertes, la stratégie offre trois options: stop de suivi, stop de ligne uniforme et forcage de ligne uniforme. En ce qui concerne l’arrêt des pertes, la stratégie offre deux objectifs d’arrêt de séquence.
Principe de stratégie
Signaux d’entrée
- 12e EMA sur le 26e EMA constitué d’une fourchette
- Le MACD est positif et la ligne MACD est supérieure à la ligne Signal
- La valeur de l’indicateur RSI se situe dans la plage définie
- Le cours de clôture est supérieur à l’EMA du 21 et au SMA du 7
Confirmation de l’entrée
- Détermination facultative: prix dépassant la résistance dynamique
Comment arrêter les pertes
- Stop loss suivi: pourcentage de stop loss suivi selon le prix d’entrée et le stop loss suivi défini
- Stop à la moyenne: les cours de clôture ont dépassé le 7e arrêt SMA
- La fourche moyenne est morte: 12 jours sous l’EMA et 26 jours sous l’EMA
La méthode d’arrêt
- Définir deux objectifs d’arrêt en séquence, en vendant une partie de la quantité lorsque le premier arrêt est déclenché et en vendant la totalité de la quantité lorsque le deuxième arrêt est déclenché
Avantages stratégiques
- Filtrage des signaux trompeurs avec un système homogène pour améliorer l’exactitude des entrées
- Plusieurs options de stop-loss adaptées à différents types de traders
- Le suivi dynamique des pertes pour la maîtrise des risques
- Le but de la suspension est de jouer en lots et de bloquer une partie des bénéfices.
Risque stratégique
- L’indicateur EMA produit plus de faux signaux lorsque le marché est en mouvement
- Tracking Stop Loss peut être détecté après une brèche
- Le stop de la fourchette moyenne ne peut pas être arrêté à temps lors d’une inversion de tendance
Les mesures prises:
- Les indicateurs MACD sont utilisés pour déterminer la tendance réelle du marché.
- Ajustez la taille de la perte de suivi
- Optionnel ou combiné
Orientation de l’optimisation de la stratégie
- Optimisation des paramètres EMA afin de déterminer la meilleure combinaison de paramètres
- Tester les différentes méthodes et paramètres d’arrêt afin de trouver la meilleure solution
- Test de différents paramètres de freinage pour optimiser l’effet de freinage
- Le temps d’entrée combiné à d’autres indicateurs
- Adapté aux variétés et aux paramètres de la période
Résumer
Cette stratégie utilise le système de ligne uniforme comme signal de trading principal, en plus de filtrer l’entrée avec des indicateurs tels que MACD, RSI. Les modes de stop-loss et les objectifs de stop-loss sont optimisés et peuvent être ajustés par paramètres pour correspondre à différents types d’investisseurs. Il y a beaucoup de place pour optimiser la stratégie.
/*backtest
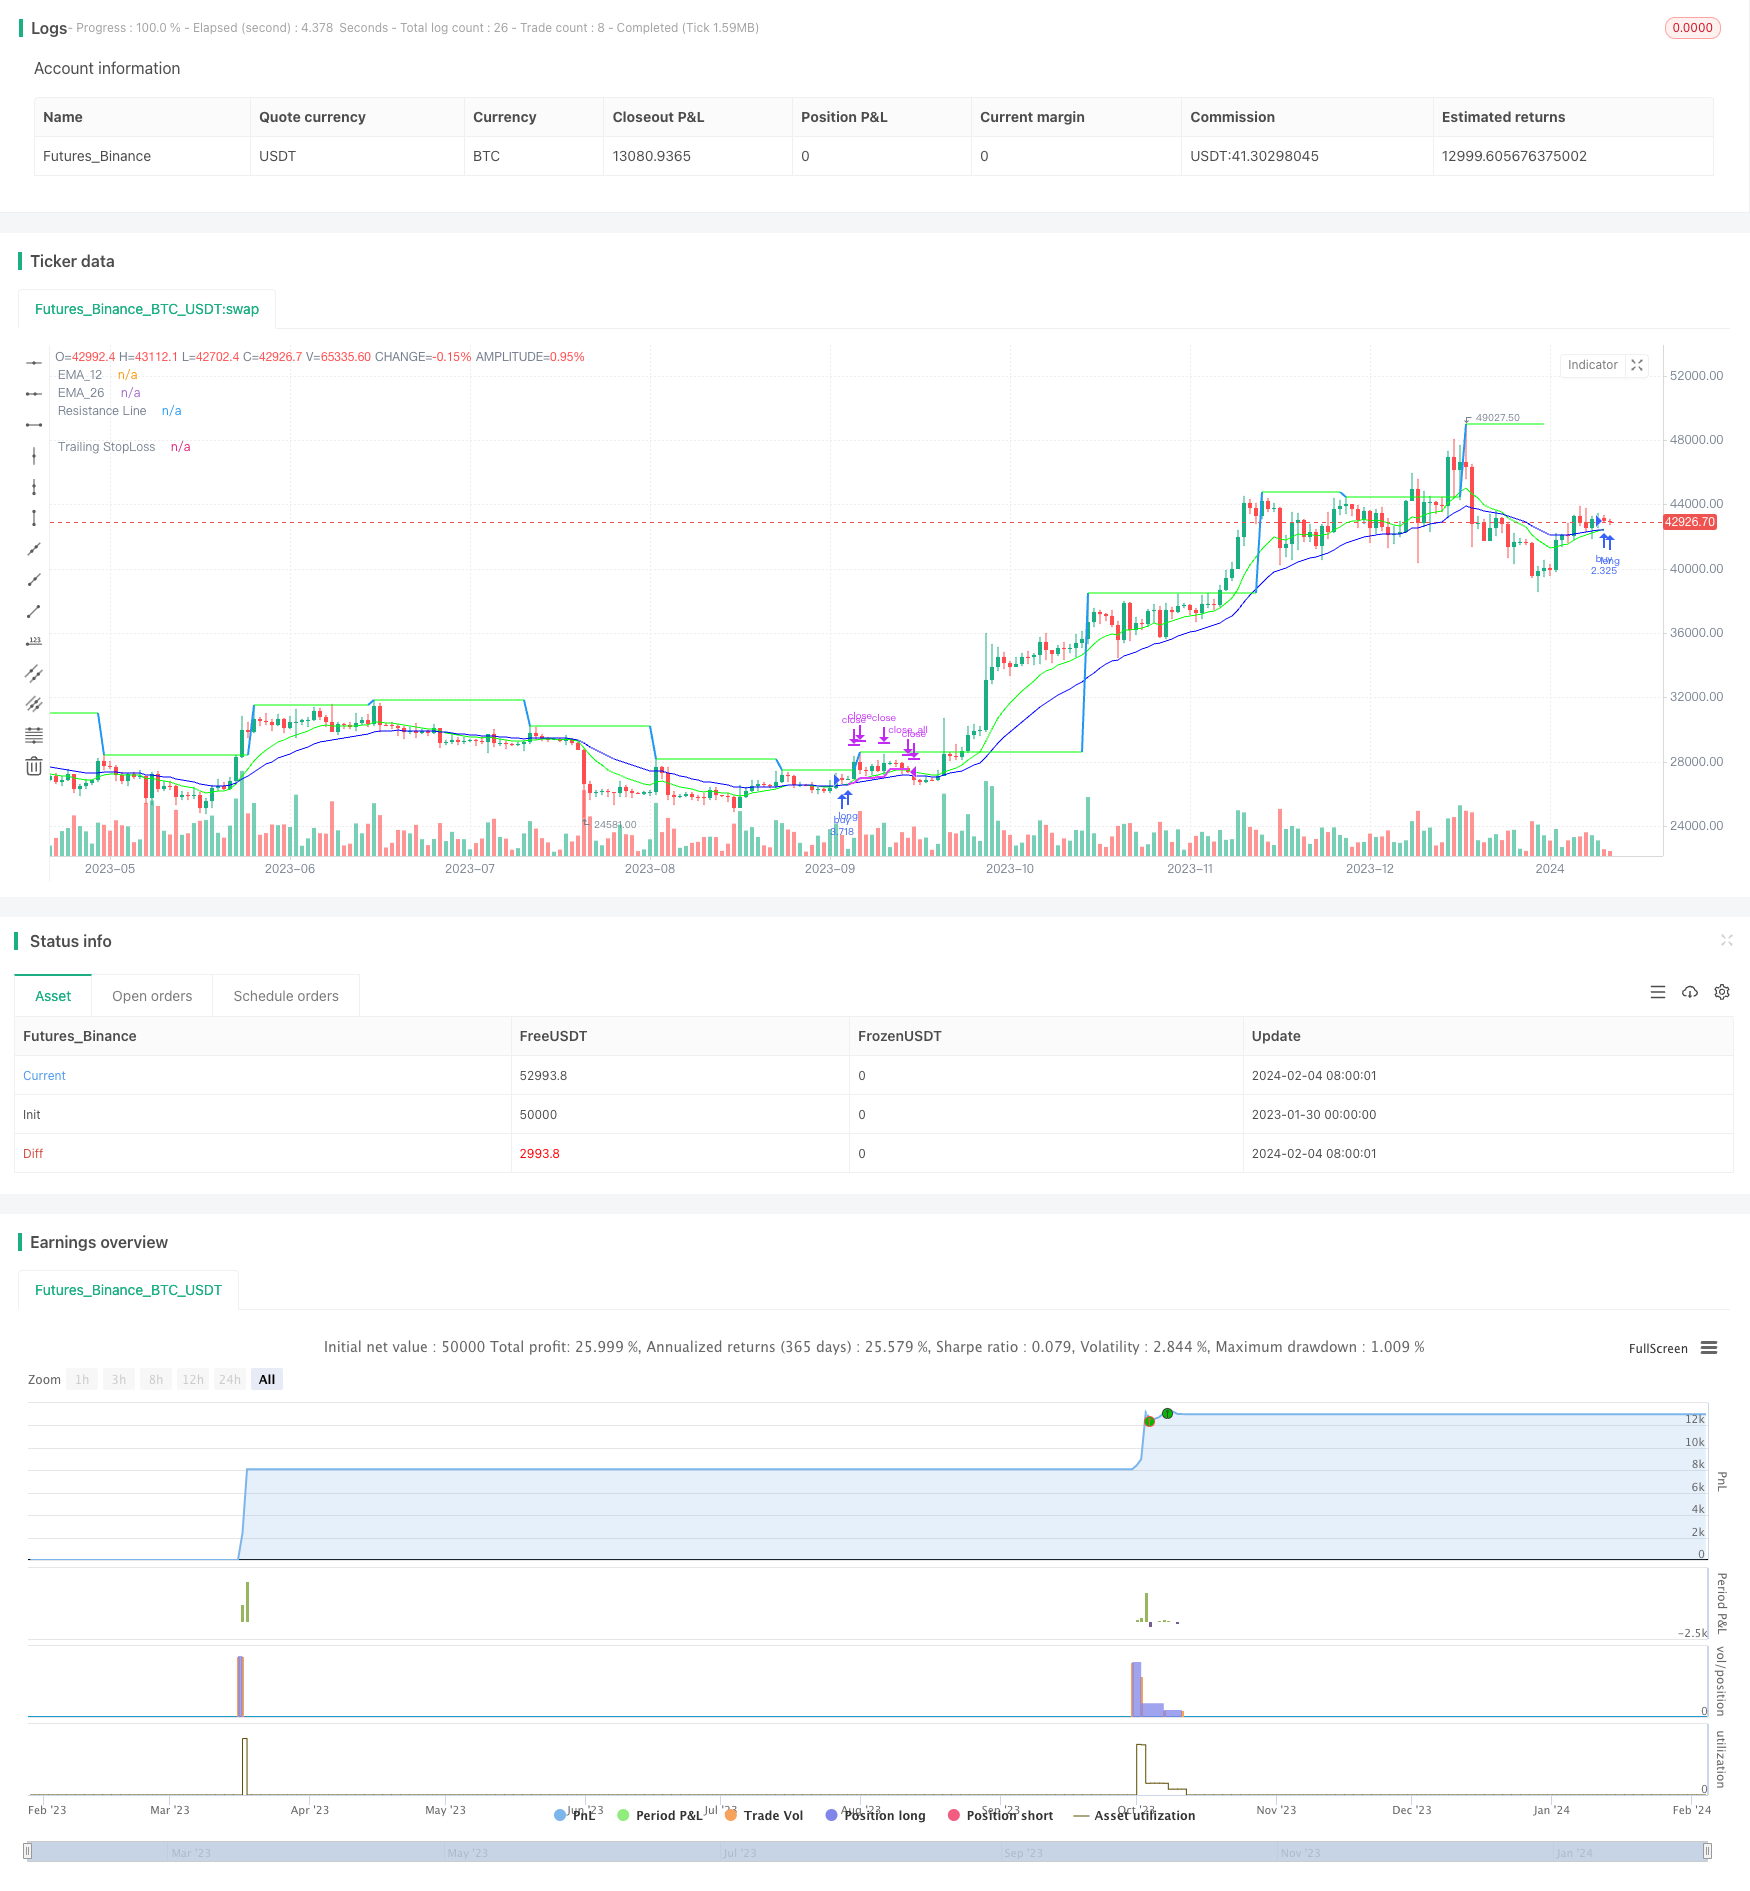
start: 2023-01-30 00:00:00
end: 2024-02-05 00:00:00
period: 1d
basePeriod: 1h
exchanges: [{"eid":"Futures_Binance","currency":"BTC_USDT"}]
*/
// This source code is subject to the terms of the Mozilla Public License 2.0 at https://mozilla.org/MPL/2.0/
// © AbdulRahimShama
//@version=5
strategy('12/26-IT strategy', overlay=true,initial_capital = 100000)
Show_Only_12_26_Crossover_Entry = input.bool(true, group = "Entry_Exit Criteria")
Show_12_26_Crossover_and_resistance_Entry = input.bool(false, group = "Entry_Exit Criteria")
Show_TSL_StopLoss = input.bool(true, group = "Entry_Exit Criteria")
Show_Crossdown_StopLoss = input.bool(true, group = "Entry_Exit Criteria")
Show_SMA7_StopLoss = input.bool(false, group = "Entry_Exit Criteria")
////////////////////////////////////////////////
////////////////TARGETS INPUT
////////////////////////////////////////////////
////////Target1
TargetPerc1 = input.float(title="Target (%)", minval=0,defval=5, group="Target-1") / 100
TargetPrice1 = strategy.position_avg_price * (1 + TargetPerc1)
Target1_exit_qty = input.int(50, group="Target-1",tooltip = "% qty to sell when Target1 is reached")
////////Target2
TargetPerc2 = input.float(title="Target (%)", minval=0,defval=10, group="Target-2") / 100
TargetPrice2 = strategy.position_avg_price * (1 + TargetPerc2)
Target2_exit_qty = input.int(100, group="Target-2",tooltip = "% qty to sell when Target2 is reached")
////////////////////////////////////////////////
////////////////TRAILING STOP LOSS
////////////////////////////////////////////////
TSLsource = input(low, title="TSL Source", group="Trailing StopLoss")
longTrailPerc = input.float(title='Trail Long Loss (%)', minval=0.0, step=0.1, defval=1, group="Trailing StopLoss") * 0.01
TrailStopPrice = 0.0
TrailStopPrice := if strategy.position_size > 0
sPIVOT_highValue = TSLsource * (1 - longTrailPerc)
math.max(sPIVOT_highValue, TrailStopPrice[1])
else
0
TSL = close < TrailStopPrice
plot(series=strategy.position_size > 0 and Show_TSL_StopLoss ? TrailStopPrice : na, color=color.new(color.fuchsia, 0), style=plot.style_linebr, linewidth=2, title='Trailing StopLoss')
////////////////////////////////////////////////
////////////////Moving Averages
////////////////////////////////////////////////
EMA_12=ta.ema(close, 12)
EMA_26=ta.ema(close, 26)
EMA_21=ta.ema(close,21)
plot(EMA_12, title="EMA_12", color=color.rgb(0, 255, 0), offset=0, linewidth=1)
plot(EMA_26, title="EMA_26", color=color.rgb(0, 0, 255), offset=0, linewidth=1)
plot(Show_SMA7_StopLoss ? ta.sma(close,7) : na, title="SMA_7", color=color.rgb(255, 0, 0), offset=0, linewidth=1)
////////////////////////////////////////////////
////////////////RESISTANCE INPUT and PLOTTING
////////////////////////////////////////////////
CrossOverLookbackCandles = input.int(10, group= "RESISTANCE")
resistanceSRC = input(high, group= "RESISTANCE")
resistanceLEFT = input(10, group= "RESISTANCE")
resistanceRIGHT = input(10, group= "RESISTANCE")
hih = ta.pivothigh(resistanceSRC, resistanceLEFT, resistanceRIGHT)
top = ta.valuewhen(hih, resistanceSRC[resistanceRIGHT], 0)
res = plot(top, color=top != top[1] ? na : color.new(#00ff00, 50), offset=-resistanceLEFT, linewidth=2, title="Resistance Line")
EMA_12_Low = ta.lowest(EMA_12, CrossOverLookbackCandles)
EMA_26_Low = ta.lowest(EMA_26, CrossOverLookbackCandles)
////////////////////////////////////////////////
////////////////RSI INPUT and PLOTTING
////////////////////////////////////////////////
RSI = ta.rsi(close, 14)
RSILowerRange = input.int(50, tooltip = "RSI value should be ABOVE this value for entry", group = "RSI")
RSIUpperRange = input.int(70, tooltip = "RSI value should be BELOW this value for entry", group = "RSI")
////////////////////////////////////////////////
////////////////MACD
////////////////////////////////////////////////
fast_length = 12
slow_length = 26
MACD_src = close
signal_length = 9
fast_ma = ta.ema(MACD_src, fast_length)
slow_ma = ta.ema(MACD_src, slow_length)
macd = fast_ma - slow_ma
signal = ta.ema(macd, signal_length)
hist = macd - signal
////////////////////////////////////////////////
////////////////ENTRY CRITERIA
////////////////////////////////////////////////
BUYVALUE= input(100000, tooltip = "Buy qty displayed on chart will be based on this value")
BASEENTRY = macd > signal and RSI > RSILowerRange and RSI < RSIUpperRange and close > EMA_21 and close > ta.sma(close, 7)
Entry= ta.crossover(EMA_12, EMA_26) and BASEENTRY
Entry2 = ta.crossover(close, top) and EMA_12_Low < EMA_26_Low and EMA_12 > EMA_26 and RSI < 70
////////////////////////////////////////////////
////////////////BUY SELL STRATEGY
////////////////////////////////////////////////
if ((Entry and Show_Only_12_26_Crossover_Entry))
strategy.entry("buy", strategy.long, qty=BUYVALUE/close)
if (Entry2 and Show_12_26_Crossover_and_resistance_Entry)
strategy.entry("buy", strategy.long, qty=BUYVALUE/close)
strategy.exit("Tg1", "buy", limit=TargetPrice1, qty_percent = Target1_exit_qty)
strategy.exit("Tg2", "buy", limit=TargetPrice2, qty_percent = Target2_exit_qty)
if TSL and Show_TSL_StopLoss and close < EMA_12
strategy.close_all ("sl")
if ta.crossunder(EMA_12, EMA_26) and Show_Crossdown_StopLoss
strategy.close_all ("sl")
if ta.crossunder(close, ta.sma(close, 7)) and Show_SMA7_StopLoss
strategy.close_all ("sl")