Basé sur une stratégie de double contre-mouvement
Aperçu
La stratégie de double inversion permet d’effectuer des transactions de tendance en combinant des signaux de revers de prix et des signaux de revers de volatilité. Elle est principalement basée sur le jugement de la forme 123 des points de revers de prix, tout en aidant à utiliser les fluctuations du canal Donchian pour filtrer les faux signaux.
Principe de stratégie
La partie inverse de prix utilise le jugement de la forme 123. Cette forme signifie que les deux premières lignes de prix de K sont inversées (haut ou bas) et que la troisième ligne de prix de K est inversée (bas ou haut) et est donc appelée la forme 123.
La partie inverse de la volatilité utilise la volatilité des canaux donchiens. Les canaux donchiens reflètent principalement l’amplitude des fluctuations des prix. Lorsque les fluctuations des prix augmentent, la largeur des canaux donchiens s’élargit; lorsque les fluctuations des prix diminuent, la largeur des canaux donchiens se rétrécit.
Dans l’ensemble, la stratégie assure la fiabilité des signaux de négociation et maîtrise les risques grâce à une double vérification inversée, ce qui en fait une stratégie de tendance relativement robuste.
Avantages stratégiques
- Un double mécanisme de filtrage assure la fiabilité des signaux de transaction et évite les fausses ruptures
- Contrôler les risques et réduire la probabilité de pertes
- Avoir des positions de taille moyenne et longue, éviter le “Noise” du marché et saisir les gains en trop
- Les paramètres ont beaucoup d’espace d’optimisation et peuvent être ajustés à un état optimal
- Un style unique et une bonne combinaison avec les indicateurs techniques courants
Risque stratégique
- Optimisation par paramètres, les paramètres inappropriés peuvent affecter la performance de la stratégie
- Les stratégies de stop-loss doivent encore être améliorées, et les contrôles de retraits maximaux doivent être améliorés.
- La fréquence de transaction peut être faible et ne pas s’adapter à la négociation d’algorithmes à haute fréquence
- Il faut choisir la bonne variété et le bon moment, le champ d’application est limité.
- L’apprentissage automatique peut être utilisé pour trouver les paramètres optimaux.
Direction d’optimisation
- L’ajout d’un module d’arrêt de perte adaptatif peut réduire considérablement le retrait maximal
- Ajout d’indicateurs de volume de transactions pour assurer une entrée en bourse lors d’une rupture de volume
- Optimiser les paramètres pour une stabilité optimale
- Essayez différentes variétés et périodes de temps pour trouver le meilleur environnement
- Essayez d’obtenir une synergie de 1 + 1 > 2 avec d’autres indicateurs ou combinaisons de stratégies
Résumer
La stratégie de double inversion permet une meilleure maîtrise des risques grâce à une double vérification des retournements de prix et des retournements de volatilité. Par rapport à un seul indicateur, elle filtre beaucoup de bruit et est plus stable. La stratégie peut améliorer encore la qualité du signal et la stabilité des gains grâce à l’optimisation des paramètres, au renforcement des modules d’arrêt et à l’introduction de la quantité d’énergie.
/*backtest
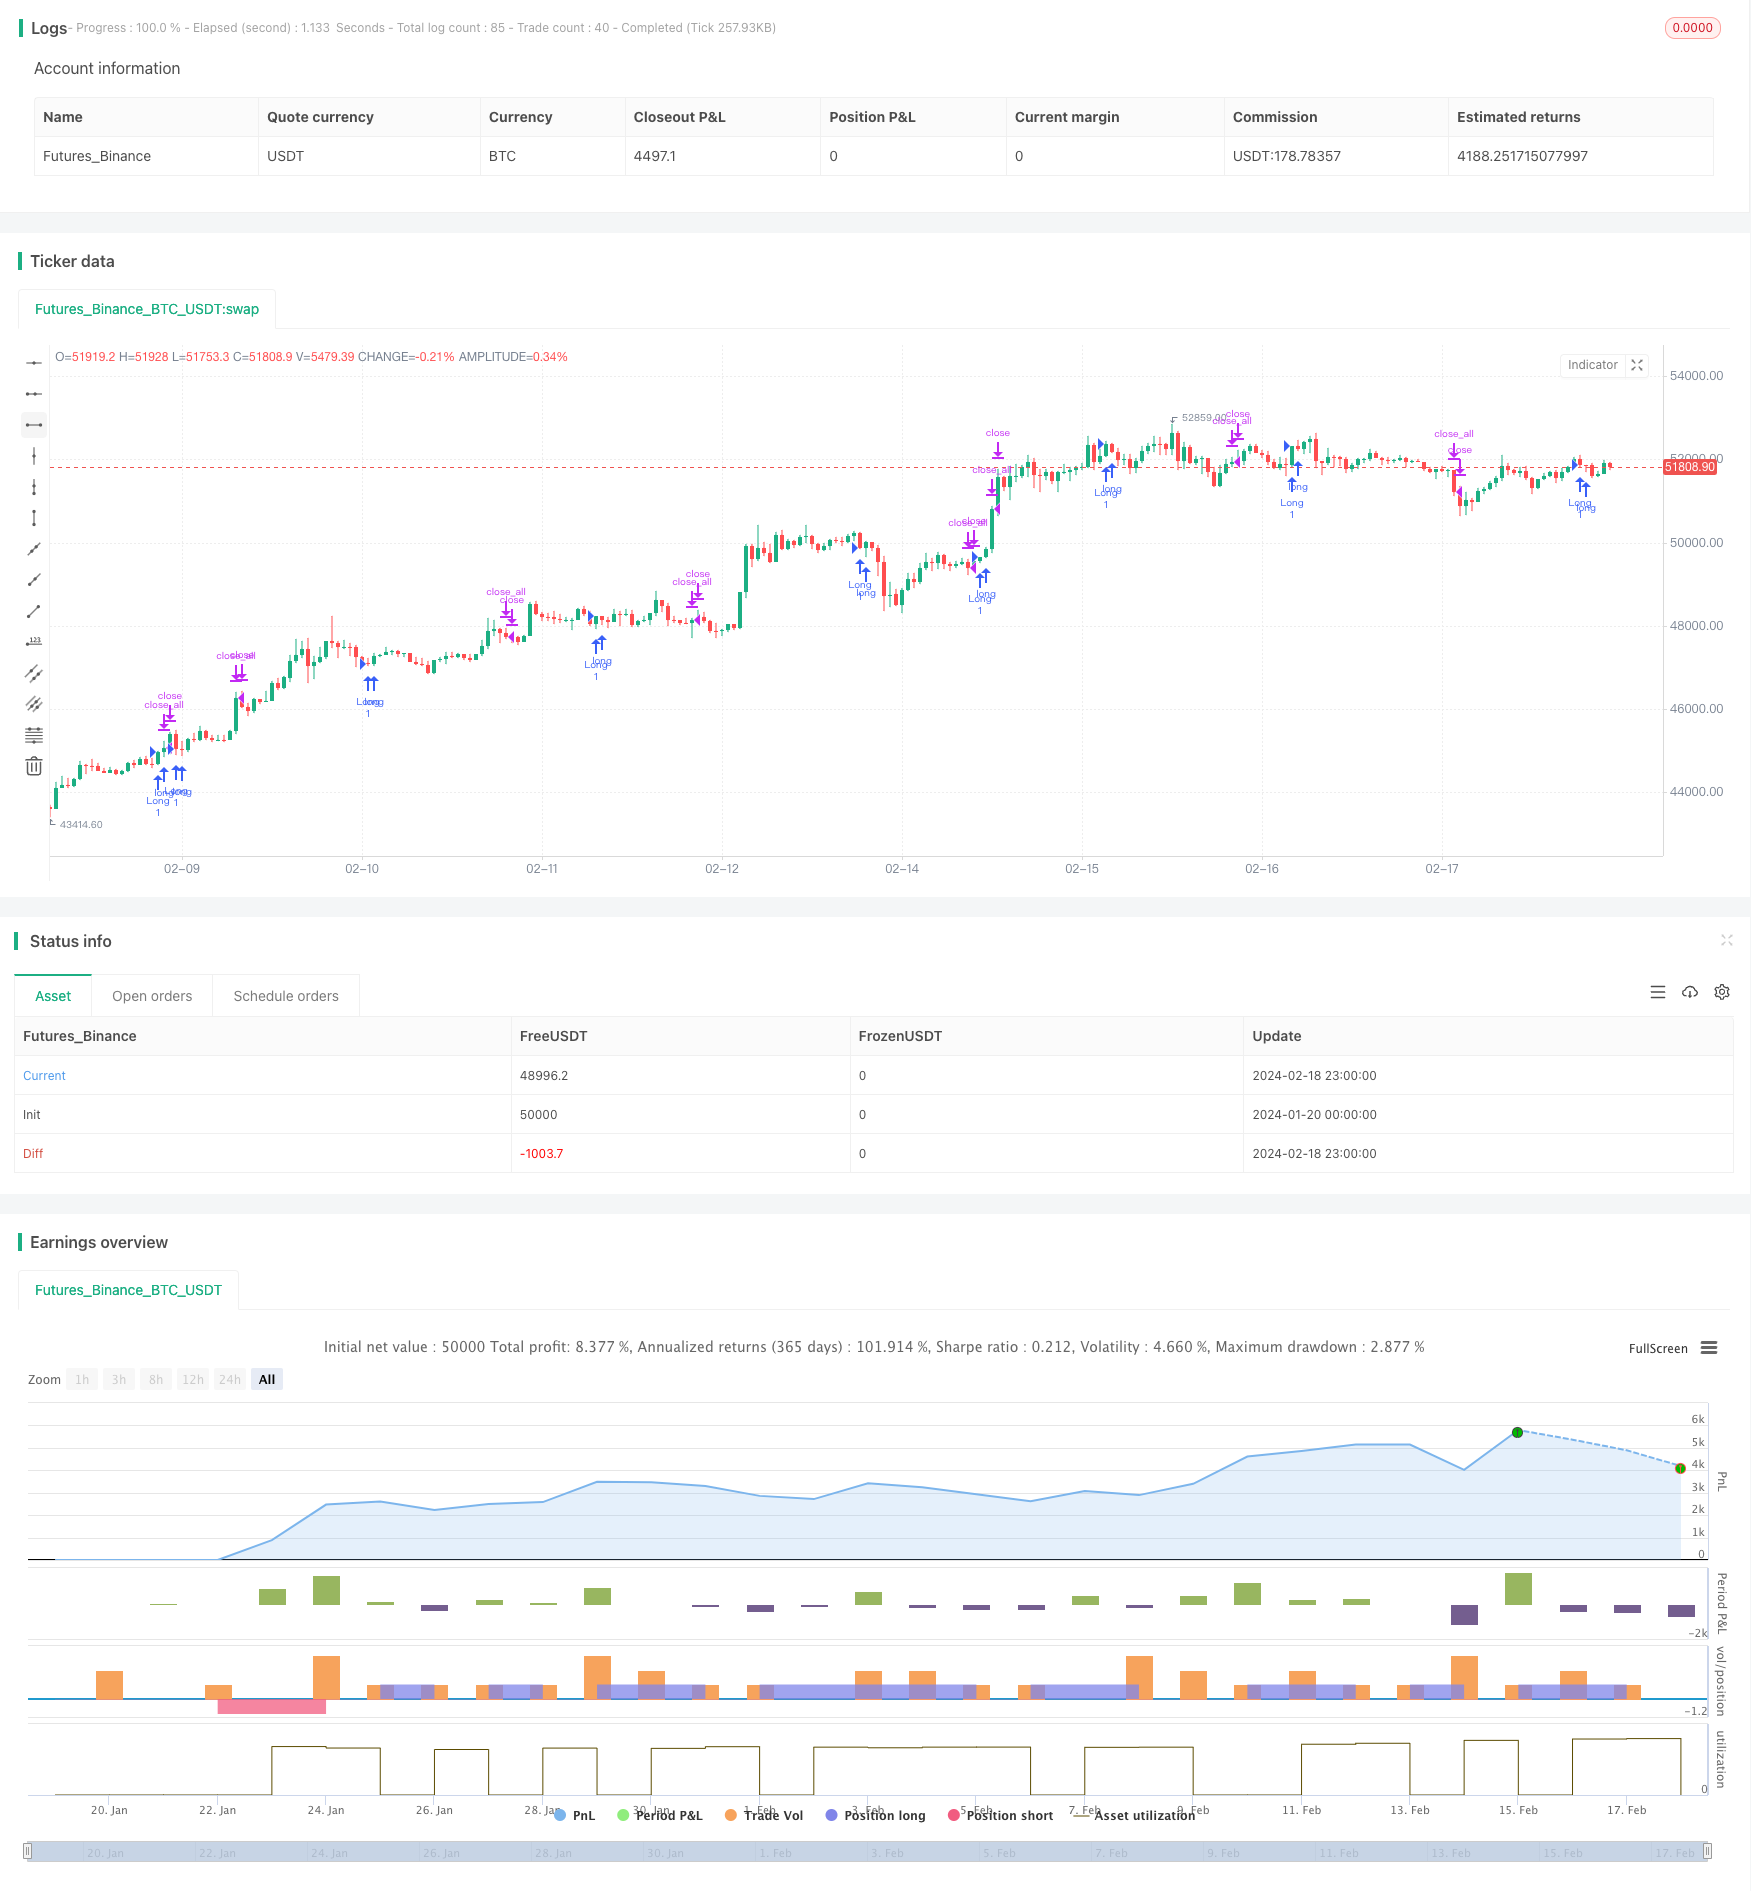
start: 2024-01-20 00:00:00
end: 2024-02-19 00:00:00
period: 1h
basePeriod: 15m
exchanges: [{"eid":"Futures_Binance","currency":"BTC_USDT"}]
*/
//@version=4
////////////////////////////////////////////////////////////
// Copyright by HPotter v1.0 06/03/2020
// This is combo strategies for get a cumulative signal.
//
// First strategy
// This System was created from the Book "How I Tripled My Money In The
// Futures Market" by Ulf Jensen, Page 183. This is reverse type of strategies.
// The strategy buys at market, if close price is higher than the previous close
// during 2 days and the meaning of 9-days Stochastic Slow Oscillator is lower than 50.
// The strategy sells at market, if close price is lower than the previous close price
// during 2 days and the meaning of 9-days Stochastic Fast Oscillator is higher than 50.
//
// Second strategy
// The Donchian Channel was developed by Richard Donchian and it could be compared
// to the Bollinger Bands. When it comes to volatility analysis, the Donchian Channel
// Width was created in the same way as the Bollinger Bandwidth technical indicator was.
//
// As was mentioned above the Donchian Channel Width is used in technical analysis to measure
// volatility. Volatility is one of the most important parameters in technical analysis.
// A price trend is not just about a price change. It is also about volume traded during this
// price change and volatility of a this price change. When a technical analyst focuses his/her
// attention solely on price analysis by ignoring volume and volatility, he/she only sees a part
// of a complete picture only. This could lead to a situation when a trader may miss something and
// lose money. Lets take a look at a simple example how volatility may help a trader:
//
// Most of the price based technical indicators are lagging indicators.
// When price moves on low volatility, it takes time for a price trend to change its direction and
// it could be ok to have some lag in an indicator.
// When price moves on high volatility, a price trend changes its direction faster and stronger.
// An indicator's lag acceptable under low volatility could be financially suicidal now - Buy/Sell signals could be generated when it is already too late.
//
// Another use of volatility - very popular one - it is to adapt a stop loss strategy to it:
// Smaller stop-loss recommended in low volatility periods. If it is not done, a stop-loss could
// be generated when it is too late.
// Bigger stop-loss recommended in high volatility periods. If it is not done, a stop-loss could
// be triggered too often and you may miss good trades.
//
// WARNING:
// - For purpose educate only
// - This script to change bars colors.
////////////////////////////////////////////////////////////
Reversal123(Length, KSmoothing, DLength, Level) =>
vFast = sma(stoch(close, high, low, Length), KSmoothing)
vSlow = sma(vFast, DLength)
pos = 0.0
pos := iff(close[2] < close[1] and close > close[1] and vFast < vSlow and vFast > Level, 1,
iff(close[2] > close[1] and close < close[1] and vFast > vSlow and vFast < Level, -1, nz(pos[1], 0)))
pos
DCW(length, smoothe) =>
pos = 0.0
xUpper = highest(high, length)
xLower = lowest(low, length)
xDonchianWidth = xUpper - xLower
xSmoothed = sma(xDonchianWidth, smoothe)
pos := iff(xDonchianWidth > xSmoothed, -1,
iff(xDonchianWidth < xSmoothed, 1, nz(pos[1], 0)))
pos
strategy(title="Combo Backtest 123 Reversal & Donchian Channel Width", shorttitle="Combo", overlay = true)
Length = input(14, minval=1)
KSmoothing = input(1, minval=1)
DLength = input(3, minval=1)
Level = input(50, minval=1)
//-------------------------
LengthDCW = input(20, minval=1)
SmootheSCW = input(22, minval=1)
reverse = input(false, title="Trade reverse")
posReversal123 = Reversal123(Length, KSmoothing, DLength, Level)
posDCW = DCW(LengthDCW, SmootheSCW)
pos = iff(posReversal123 == 1 and posDCW == 1 , 1,
iff(posReversal123 == -1 and posDCW == -1, -1, 0))
possig = iff(reverse and pos == 1, -1,
iff(reverse and pos == -1 , 1, pos))
if (possig == 1)
strategy.entry("Long", strategy.long)
if (possig == -1)
strategy.entry("Short", strategy.short)
if (possig == 0)
strategy.close_all()
barcolor(possig == -1 ? #b50404: possig == 1 ? #079605 : #0536b3 )