Stratégie de bande moyenne mobile exponentielle triple
Aperçu
La stratégie consiste à calculer l’indice RSI avec trois ensembles de paramètres différents et les six moyennes mobiles correspondantes, formant ainsi trois bandes de moyennes mobiles, sur la base desquelles la direction de la tendance du marché est déterminée et les opérations en ligne longue sont effectuées.
Principe de stratégie
- Calculez trois groupes d’indicateurs RSI: RSI à la période rapide = 50, RSI à la période moyenne = 75 et RSI à la période lente = 100
- Pour chaque groupe d’indicateurs RSI, une moyenne mobile simple ou une moyenne mobile indicielle de 5, 30, 50, 70, 90 et 100 cycles est calculée, formant une bande de moyenne mobile.
- Il s’agit d’un signal à plusieurs têtes lorsque le RSI de la ligne rapide correspond à une hausse de la ligne complète de la moyenne mobile; un signal à vide lorsque le RSI de la ligne rapide correspond à une baisse de la ligne complète de la moyenne mobile.
- Le RSI moyen et le RSI lent correspondent aux signaux de négociation fournis par les moyennes mobiles.
- Au cours d’une période donnée de négociation, le plus-value de la position est ouvert à 100% lorsque le signal d’achat apparaît; le plus-value de la position précédente est annulée lorsque le signal de vente apparaît.
Analyse des avantages
Cette stratégie combine les avantages de l’indicateur RSI et des moyennes mobiles, en utilisant trois ensembles de paramètres pour définir différents RSI afin de capturer les changements de tendance à différents niveaux de cycle, tout en utilisant six moyennes mobiles pour filtrer une partie du bruit, ce qui améliore la fiabilité du signal.
Par rapport au RSI unique et aux moyennes mobiles, le composé utilise une méthode systématique pour la formation de la base de jugement, ne dépend pas de l’optimisation des paramètres, utilise la rigueur scientifique, la simplicité d’exécution et la facilité de maîtrise.
Analyse des risques
Le RSI est tributaire de paramètres qui, s’ils ne sont pas correctement définis, peuvent générer des signaux erronés. De plus, des fluctuations rapides peuvent également déclencher de faux signaux.
Pour réduire le risque de faux signaux, il convient d’ajuster le paramètre de cycle du RSI ou d’ajuster le nombre de cycles de la moyenne mobile pour trouver la combinaison optimale de paramètres.
Direction d’optimisation
La stratégie peut être optimisée de la manière suivante:
- Ajout de la logique de stop loss. Les stratégies existantes n’ont pas de stop loss et sont vulnérables aux fortes fluctuations des cours.
- Optimiser les paramètres. Vous pouvez tester plus de combinaisons pour trouver les meilleurs paramètres.
- Ajout de filtres pour d’autres indicateurs. D’autres indicateurs tels que le MACD, les bandes de Brin peuvent être introduits pour confirmer le signal.
- Filtrez le temps et le volume des transactions. Évitez les faux signaux de périodes et de quantités anormales.
Résumer
La stratégie de la bande de moyenne mobile RSI triple intègre les avantages de plusieurs indicateurs, forme des signaux de négociation et juge les tendances de la ligne longue par un jugement logique rigoureux. La stratégie est simple à utiliser, facile à maîtriser et convient à l’apprentissage et à la pratique de la stratégie de négociation de la bande de moyenne mobile.
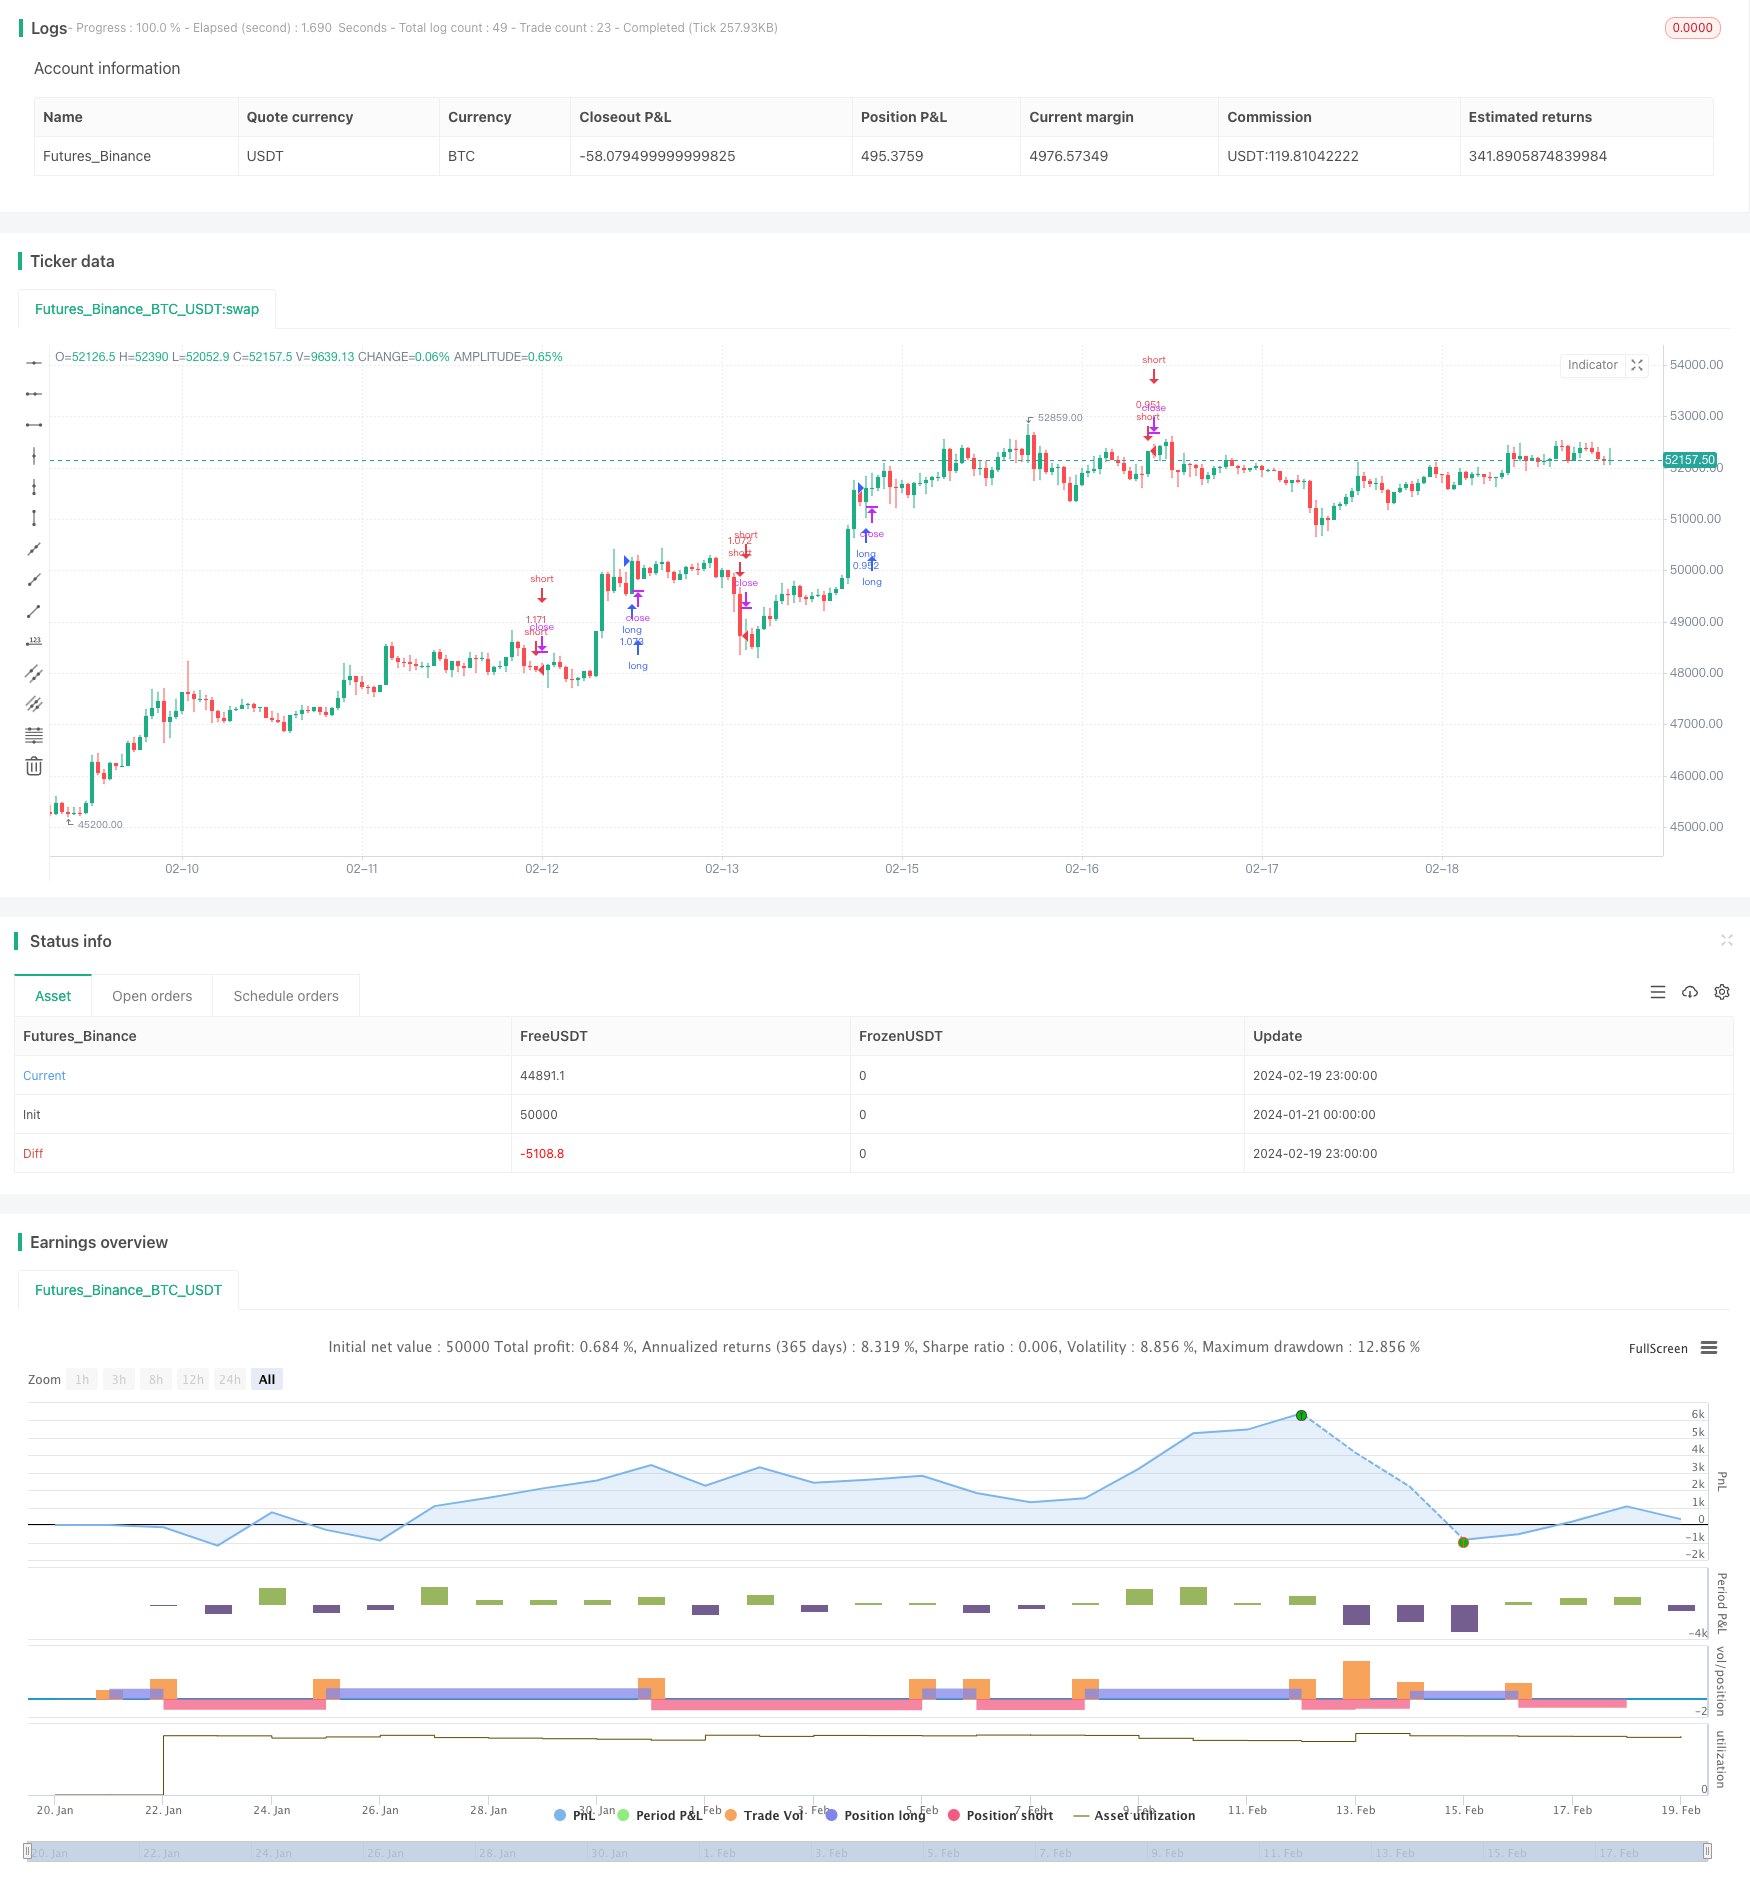
/*backtest
start: 2024-01-21 00:00:00
end: 2024-02-20 00:00:00
period: 1h
basePeriod: 15m
exchanges: [{"eid":"Futures_Binance","currency":"BTC_USDT"}]
*/

// This source code is subject to the terms of the Mozilla Public License 2.0 at https://mozilla.org/MPL/2.0/
// © exlux99

//@version=4

strategy(title="3 RSI MA movement crypto strategy", overlay=true, initial_capital = 100, default_qty_type=strategy.percent_of_equity, default_qty_value=100, commission_type=strategy.commission.percent, commission_value=0.03, pyramiding=1  )

///////////////
fromDay = input(defval = 1, title = "From Day", minval = 1, maxval = 31)
fromMonth = input(defval = 1, title = "From Month", minval = 1, maxval = 12)
fromYear = input(defval = 2019, title = "From Year", minval = 1970)
 //monday and session
// To Date Inputs
toDay = input(defval = 31, title = "To Day", minval = 1, maxval = 31)
toMonth = input(defval = 12, title = "To Month", minval = 1, maxval = 12)
toYear = input(defval = 2021, title = "To Year", minval = 1970)

startDate = timestamp(fromYear, fromMonth, fromDay, 00, 00)
finishDate = timestamp(toYear, toMonth, toDay, 00, 00)
time_cond = true

source = input(ohlc4)

RSIFast  = rsi(source, 50)
RSINorm  = rsi(source, 75)
RSISlow = rsi(source, 100)

// plot(RSIFast, color=color.silver, style=plot.style_area, histbase=50)
// plot(RSINorm, color=#98b8be, style=plot.style_area, histbase=50)
// plot(RSISlow, color=#be9e98, style=plot.style_area, histbase=50)

// plot(RSIFast, color=color.gray, style=plot.style_line, linewidth=1)
// plot(RSINorm, color=color.purple, style=plot.style_line, linewidth=2)
// plot(RSISlow, color=color.black, style=plot.style_line, linewidth=3)

exponential = false//input(false, title="Exponential MA")

src = (RSIFast)

ma05 = exponential ? ema(src, 05) : sma(src, 05)
ma30 = exponential ? ema(src, 30) : sma(src, 30)
ma50 = exponential ? ema(src, 50) : sma(src, 50)
ma70 = exponential ? ema(src, 70) : sma(src, 70)
ma90 = exponential ? ema(src, 90) : sma(src, 90)
ma100 = exponential ? ema(src, 100) : sma(src, 100)

leadMAColor = change(ma30)>=0 and ma30>ma100 ? color.lime            : change(ma30)<0  and ma30>ma100 ? color.red            : change(ma30)<=0 and ma30<ma100 ? color.maroon            : change(ma30)>=0 and ma30<ma100 ? color.green            : color.gray
maColor(ma, maRef) =>
              change(ma)>=0 and ma30>maRef ? color.lime            : change(ma)<0  and ma30>maRef ? color.red            : change(ma)<=0 and ma30<maRef ? color.maroon            : change(ma)>=0 and ma30<maRef ? color.green            : color.gray

// plot( ma30, color=maColor(ma30,ma100), style=plot.style_line, title="MMA30", linewidth=2)
// plot( ma50, color=maColor(ma50,ma100), style=plot.style_line, title="MMA50", linewidth=2)
// plot( ma70, color=maColor(ma70,ma100), style=plot.style_line, title="MMA70", linewidth=2)
// plot( ma90, color=maColor(ma90,ma100), style=plot.style_line, title="MMA90", linewidth=2)

long0=(leadMAColor==color.lime and maColor(ma30,ma100)==color.lime and maColor(ma50,ma100)==color.lime and maColor(ma70,ma100)==color.lime and maColor(ma90,ma100)==color.lime ) or (leadMAColor==color.green and maColor(ma30,ma100)==color.green and maColor(ma50,ma100)==color.green and maColor(ma70,ma100)==color.green and maColor(ma90,ma100)==color.green )
exit0=leadMAColor==color.maroon and maColor(ma30,ma100)==color.maroon and maColor(ma50,ma100)==color.maroon and maColor(ma70,ma100)==color.maroon and maColor(ma90,ma100)==color.maroon


exponential1 = false//input(false, title="Exponential MA")

src1 = (RSINorm)

ma051 = exponential1 ? ema(src1, 05) : sma(src1, 05)
ma301 = exponential1 ? ema(src1, 30) : sma(src1, 30)
ma501 = exponential1 ? ema(src1, 50) : sma(src1, 50)
ma701 = exponential1 ? ema(src1, 70) : sma(src1, 70)
ma901 = exponential1 ? ema(src1, 90) : sma(src1, 90)
ma1001 = exponential1 ? ema(src1, 100) : sma(src1, 100)

leadMAColor1 = change(ma051)>=0 and ma051>ma1001 ? color.lime            : change(ma051)<0  and ma051>ma1001 ? color.red            : change(ma051)<=0 and ma051<ma1001 ? color.maroon            : change(ma051)>=0 and ma051<ma1001 ? color.green            : color.gray
maColor1(ma, maRef) =>
              change(ma)>=0 and ma05>maRef ? color.lime            : change(ma)<0  and ma05>maRef ? color.red            : change(ma)<=0 and ma05<maRef ? color.maroon            : change(ma)>=0 and ma05<maRef ? color.green            : color.gray

// plot( ma051, color=leadMAColor1, style=plot.style_line, title="MMA05", linewidth=1)
// plot( ma301, color=maColor1(ma301,ma1001), style=plot.style_line, title="MMA30", linewidth=3)
// plot( ma501, color=maColor1(ma501,ma1001), style=plot.style_line, title="MMA50", linewidth=3)
// plot( ma701, color=maColor1(ma701,ma1001), style=plot.style_line, title="MMA70", linewidth=3)
// plot( ma901, color=maColor1(ma901,ma1001), style=plot.style_line, title="MMA90", linewidth=3)

long1=(leadMAColor1==color.lime and maColor1(ma301,ma1001)==color.lime and maColor1(ma501,ma1001)==color.lime and maColor1(ma701,ma1001)==color.lime and maColor1(ma901,ma1001)==color.lime ) or (leadMAColor1==color.green and maColor1(ma301,ma1001)==color.green and maColor1(ma501,ma1001)==color.green and maColor1(ma701,ma1001)==color.green and maColor1(ma901,ma100)==color.green )
exit1=leadMAColor1==color.maroon and maColor1(ma301,ma1001)==color.maroon and maColor1(ma501,ma1001)==color.maroon and maColor1(ma701,ma1001)==color.maroon and maColor1(ma901,ma1001)==color.maroon


exponential2 = false//input(false, title="Exponential MA")

src2 = (RSISlow)

ma052 = exponential2 ? ema(src2, 05) : sma(src2, 05)
ma302 = exponential2 ? ema(src2, 30) : sma(src2, 30)
ma502 = exponential2 ? ema(src2, 50) : sma(src2, 50)
ma702 = exponential2 ? ema(src2, 70) : sma(src2, 70)
ma902 = exponential2 ? ema(src2, 90) : sma(src2, 90)
ma1002 = exponential2 ? ema(src2, 100) : sma(src2, 100)

leadMAColor2 = change(ma052)>=0 and ma052>ma1002 ? color.lime            : change(ma052)<0  and ma052>ma1002 ? color.red            : change(ma052)<=0 and ma052<ma1002 ? color.maroon            : change(ma052)>=0 and ma052<ma1002 ? color.green            : color.gray
maColor2(ma, maRef) =>
              change(ma)>=0 and ma05>maRef ? color.lime            : change(ma)<0  and ma05>maRef ? color.red            : change(ma)<=0 and ma05<maRef ? color.maroon            : change(ma)>=0 and ma05<maRef ? color.green            : color.gray

// plot( ma052, color=leadMAColor2, style=plot.style_line, title="MMA05", linewidth=1)
// plot( ma302, color=maColor2(ma302,ma1001), style=plot.style_line, title="MMA30", linewidth=4)
// plot( ma502, color=maColor2(ma502,ma1001), style=plot.style_line, title="MMA50", linewidth=4)
// plot( ma702, color=maColor2(ma701,ma1001), style=plot.style_line, title="MMA70", linewidth=4)
// plot( ma902, color=maColor2(ma901,ma1001), style=plot.style_line, title="MMA90", linewidth=4)

long2=(leadMAColor2==color.lime and maColor2(ma302,ma1002)==color.lime and maColor2(ma502,ma1002)==color.lime and maColor2(ma702,ma1002)==color.lime and maColor2(ma902,ma1002)==color.lime ) or (leadMAColor2==color.green and maColor2(ma302,ma1002)==color.green and maColor2(ma502,ma1002)==color.green and maColor2(ma701,ma1002)==color.green and maColor2(ma901,ma1002)==color.green )
exit2=leadMAColor2==color.maroon and maColor2(ma302,ma1002)==color.maroon and maColor2(ma502,ma1002)==color.maroon and maColor2(ma702,ma1002)==color.maroon and maColor2(ma902,ma1002)==color.maroon


long= long1 or long2
exit=  exit1 or exit2


// ------------------------- Strategy Logic --------------------------------- //
var longOpened = false
var shortOpened = false
var int timeOfBuy = na


longConditionLongOnly= long and not longOpened

if longConditionLongOnly
    longOpened := true
    timeOfBuy := time


longExitSignal = exit
exitLongConditionLongOnly = longOpened[1] and longExitSignal

if exitLongConditionLongOnly
    longOpened := false
    timeOfBuy := na


//plotshape(longConditionLongOnly, color=color.green, text= "Buy", location= location.belowbar,style= shape.labelup, textcolor=color.white, size = size.tiny, title="Buy Alert",editable=false, transp=60)
//plotshape(exitLongConditionLongOnly, color=color.red, text= "exit", location= location.abovebar,style= shape.labeldown, textcolor=color.white, size = size.tiny, title="Sell Alert", editable=false, transp=60)

//alertcondition(longConditionLongOnly ,title='Buy Alert', message='Buy Alert')
//alertcondition(exitLongConditionLongOnly , title='exit Alert', message='exit Alert')

if(time_cond)
    strategy.entry("long",1,when=longConditionLongOnly)
    strategy.entry("short",0,when=exitLongConditionLongOnly)