Basé sur une stratégie de tendance englobante dynamique
Aperçu
La stratégie de tendance à l’absorption dynamique est une stratégie de négociation dans la direction de la tendance en fonction de la forme de l’absorption. La stratégie utilise la gamme moyenne de fluctuation réelle (ATR) pour identifier la volatilité du marché, l’indicateur de tendance supérieure pour déterminer la direction de la tendance du marché et effectuer des opérations de reprise multiple lorsque la forme de l’absorption est conforme à la direction de la tendance.
Principe de stratégie
- Calculer l’ATR, une mesure de la volatilité du marché.
- Calculer les indicateurs de super-tendance pour déterminer les principales tendances du marché.
- Définir les conditions du marché à tête multiple et du marché à tête vide
- Identifier les formes d’absorption à plusieurs têtes (en tendance haussière) et d’absorption à vide (en tendance baissière) qui correspondent à la direction de la tendance.
- Le stop-loss et le stop-loss sont calculés en fonction de la forme de l’ingestion.
- Lorsque l’on identifie une forme de glissement et qu’elle correspond à la direction de la tendance, on effectue des opérations de plus ou de moins.
- Lorsque le prix atteint le seuil de stop-loss ou de stop-loss, un placement est effectué.
- Définition de la forme de la déglutition sur le graphique:
Analyse des forces stratégiques
Cette stratégie présente les avantages suivants:
- La combinaison de la dérive et de la reconnaissance des tendances du signal de transaction améliore la qualité du signal.
- Il est possible d’identifier les points de basculement des tendances et d’opérer de manière ciblée.
- Les signaux de dégagement sont plus clairs et plus faciles à maîtriser.
- La stratégie Stop Loss engloutit à la fois la tendance et le contrôle des risques.
- Le cadre de code est clair et facile à optimiser et à améliorer.
Analyse stratégique des risques
Cette stratégie comporte aussi des risques:
- La forme de la déglutition peut être une fausse percée, et une erreur d’identification peut entraîner des pertes.
- Il est difficile de saisir les paramètres de la forme de l’ingestion, tels que la taille du volume, la durée, etc.
- Le mécanisme de détection des tendances est imparfait, ce qui peut conduire à des opérations non conformes aux tendances.
- Les paramètres de Stop Loss et Stop Out dépendent de l’expérience et peuvent être trop subjectifs.
- L’effet dépend de l’optimisation des paramètres et nécessite une grande quantité de données historiques.
Les risques mentionnés ci-dessus peuvent être maîtrisés et améliorés par:
- En combinaison avec d’autres indicateurs techniques, il permet de filtrer les fausses signaux de rupture.
- Utilisation de méthodes de calcul de paramètres plus robustes, telles que l’ATR adapté.
- Augmenter la fiabilité des mécanismes de jugement des tendances, par exemple en introduisant des modèles d’apprentissage automatique.
- L’algorithme génétique est utilisé pour trouver la combinaison optimale de paramètres.
- Les paramètres sont vérifiés dans une fenêtre de temps plus longue pour assurer la stabilité des paramètres.
Orientation de l’optimisation de la stratégie
Cette stratégie a beaucoup de marge d’optimisation:
- L’introduction de modèles d’apprentissage automatique peut améliorer la précision des jugements de tendance.
- L’identification des formes englouties a été améliorée par la combinaison de nouvelles méthodes de reconnaissance des formes.
- Optimisez votre point d’arrêt en utilisant les dernières stratégies d’arrêt et de perte.
- Des stratégies de dénivelé de données basées sur des données à haute fréquence peuvent être développées pour des opérations plus adaptées aux lignes courtes.
- Il peut être utilisé pour l’ajustement et l’optimisation des paramètres de différentes variétés.
Résumer
Dans l’ensemble, la stratégie de tendance à l’absorption dynamique, combinée à une forme d’absorption significative et à un jugement de tendance précis, forme une stratégie de négociation raisonnable. Dans le processus d’application, la stabilité et la rentabilité de la stratégie peuvent être encore améliorées par l’optimisation des paramètres, le contrôle des risques et l’introduction de nouvelles technologies. Le cadre de la stratégie est clair, a une grande universalité et mérite une étude et une application approfondies.
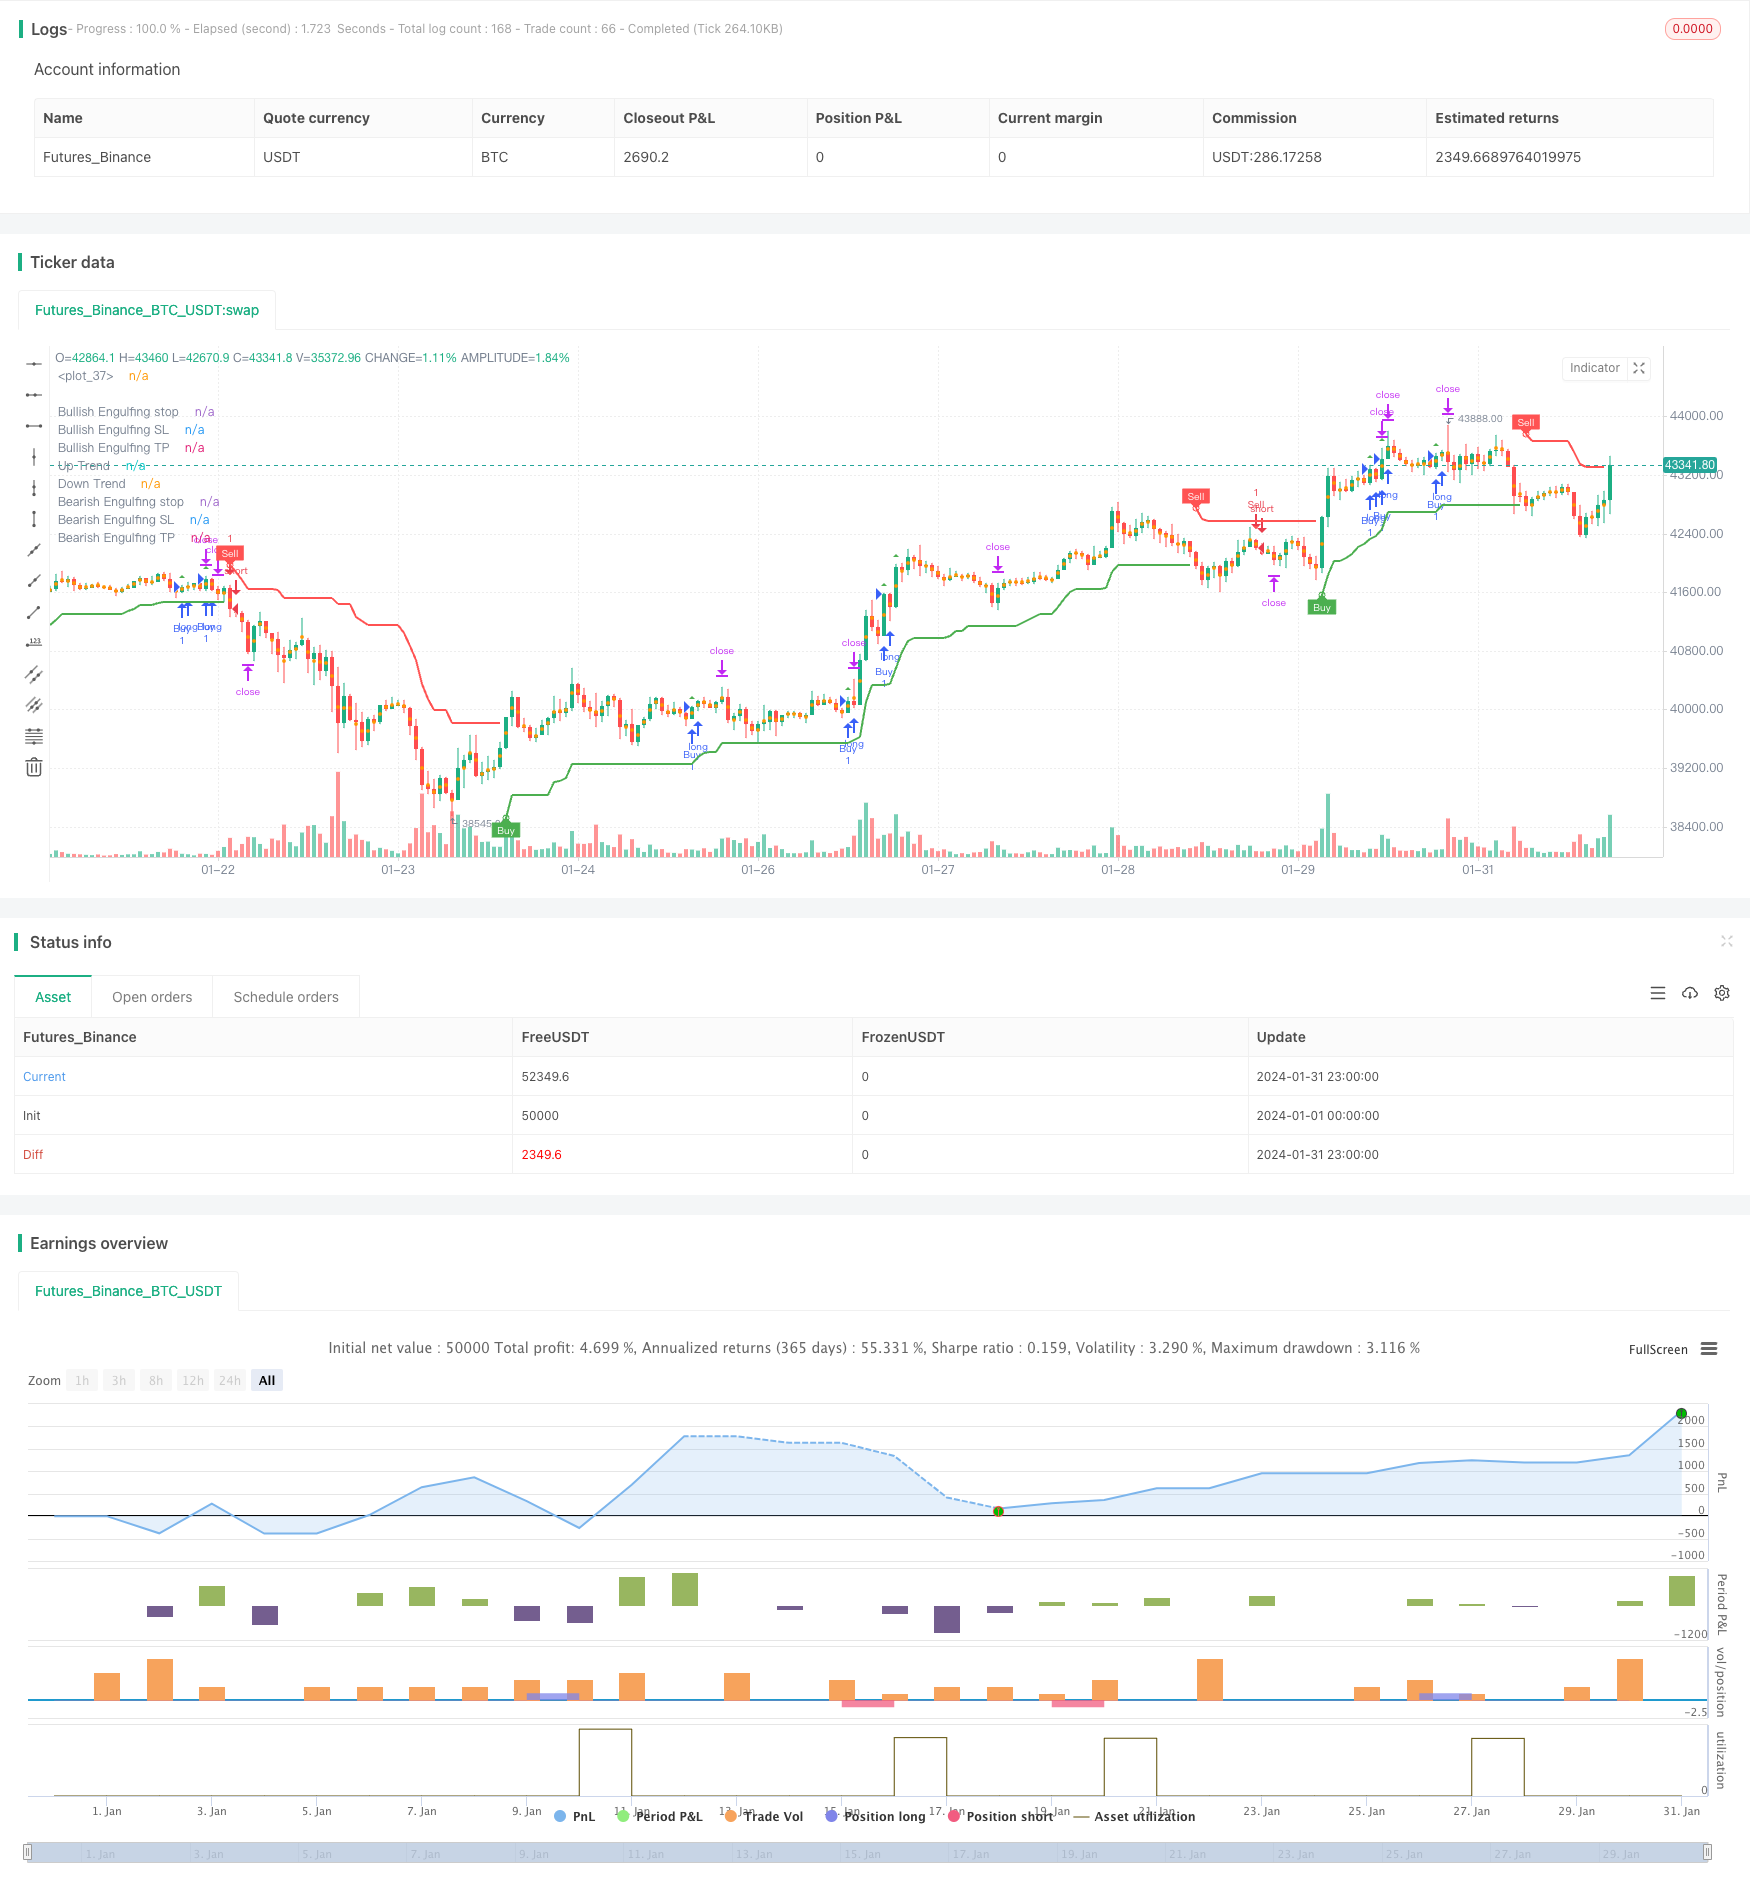
/*backtest
start: 2024-01-01 00:00:00
end: 2024-01-31 23:59:59
period: 1h
basePeriod: 15m
exchanges: [{"eid":"Futures_Binance","currency":"BTC_USDT"}]
*/

// This source code is subject to the terms of the Mozilla Public License 2.0 at https://mozilla.org/MPL/2.0/
// © Malikdrajat


//@version=4
strategy("Engulfing with Trend", overlay=true)

Periods = input(title="ATR Period", type=input.integer, defval=10)
src = input(hl2, title="Source")
Multiplier = input(title="ATR Multiplier", type=input.float, step=0.1, defval=3.0)
changeATR= input(title="Change ATR Calculation Method ?", type=input.bool, defval=true)
showsignals = input(title="Show Buy/Sell Signals ?", type=input.bool, defval=true)
highlighting = input(title="Highlighter On/Off ?", type=input.bool, defval=true)

atr2 = sma(tr, Periods)
atr= changeATR ? atr(Periods) : atr2

up=src-(Multiplier*atr)
up1 = nz(up[1],up)
up := close[1] > up1 ? max(up,up1) : up
dn=src+(Multiplier*atr)
dn1 = nz(dn[1], dn)
dn := close[1] < dn1 ? min(dn, dn1) : dn

trend = 1
trend := nz(trend[1], trend)
trend := trend == -1 and close > dn1 ? 1 : trend == 1 and close < up1 ? -1 : trend

upPlot = plot(trend == 1 ? up : na, title="Up Trend", style=plot.style_linebr, linewidth=2, color=color.green)
buySignal = trend == 1 and trend[1] == -1
plotshape(buySignal ? up : na, title="UpTrend Begins", location=location.absolute, style=shape.circle, size=size.tiny, color=color.green, transp=0)
plotshape(buySignal and showsignals ? up : na, title="Buy", text="Buy", location=location.absolute, style=shape.labelup, size=size.tiny, color=color.green, textcolor=color.white, transp=0)
dnPlot = plot(trend == 1 ? na : dn, title="Down Trend", style=plot.style_linebr, linewidth=2, color=color.red)
sellSignal = trend == -1 and trend[1] == 1
plotshape(sellSignal ? dn : na, title="DownTrend Begins", location=location.absolute, style=shape.circle, size=size.tiny, color=color.red, transp=0)
plotshape(sellSignal and showsignals ? dn : na, title="Sell", text="Sell", location=location.absolute, style=shape.labeldown, size=size.tiny, color=color.red, textcolor=color.white, transp=0)
mPlot = plot(ohlc4, title="", style=plot.style_circles, linewidth=0)
longFillColor = highlighting ? (trend == 1 ? color.green : color.white) : color.white
shortFillColor = highlighting ? (trend == -1 ? color.red : color.white) : color.white
fill(mPlot, upPlot, title="UpTrend Highligter", color=longFillColor)
fill(mPlot, dnPlot, title="DownTrend Highligter", color=shortFillColor)
alertcondition(buySignal, title="SuperTrend Buy", message="SuperTrend Buy!")
alertcondition(sellSignal, title="SuperTrend Sell", message="SuperTrend Sell!")
changeCond = trend != trend[1]
alertcondition(changeCond, title="SuperTrend Direction Change", message="SuperTrend has changed direction!")

// Define Downtrend and Uptrend conditions
downtrend = trend == -1
uptrend = trend == 1


// Engulfing
boringThreshold = input(25, title="Boring Candle Threshold (%)", minval=1, maxval=100, step=1)
engulfingThreshold = input(50, title="Engulfing Candle Threshold (%)", minval=1, maxval=100, step=1)
stopLevel = input(200, title="Stop Level (Pips)", minval=1)


// Boring Candle (Inside Bar) and Engulfing Candlestick Conditions
isBoringCandle = abs(open[1] - close[1]) * 100 / abs(high[1] - low[1]) <= boringThreshold
isEngulfingCandle = abs(open - close) * 100 / abs(high - low) <= engulfingThreshold

// Bullish and Bearish Engulfing Conditions
bullEngulfing = uptrend and close[1] < open[1] and close > open[1] and not isBoringCandle and not isEngulfingCandle
bearEngulfing = downtrend and close[1] > open[1] and close < open[1] and not isBoringCandle and not isEngulfingCandle

// Stop Loss, Take Profit, and Entry Price Calculation
bullStop = close + (stopLevel * syminfo.mintick)
bearStop = close - (stopLevel * syminfo.mintick)
bullSL = low
bearSL = high
bullTP = bullStop + (bullStop - low)
bearTP = bearStop - (high - bearStop)

// Entry Conditions
enterLong = bullEngulfing and uptrend
enterShort = bearEngulfing and downtrend

// Exit Conditions
exitLong = crossover(close, bullTP) or crossover(close, bullSL)
exitShort = crossover(close, bearTP) or crossover(close, bearSL)

// Check if exit conditions are met by the next candle
exitLongNextCandle = exitLong and (crossover(close[1], bullTP[1]) or crossover(close[1], bullSL[1]))
exitShortNextCandle = exitShort and (crossover(close[1], bearTP[1]) or crossover(close[1], bearSL[1]))

// Strategy Execution
strategy.entry("Buy", strategy.long, when=enterLong )
strategy.entry("Sell", strategy.short, when=enterShort )

// Exit Conditions for Long (Buy) Positions
if (bullEngulfing and not na(bullTP) and not na(bullSL))
    strategy.exit("Exit Long", from_entry="Buy", stop=bullSL, limit=bullTP)

// Exit Conditions for Short (Sell) Positions
if (bearEngulfing and not na(bearTP) and not na(bearSL))
    strategy.exit("Exit Short", from_entry="Sell", stop=bearSL, limit=bearTP)

// Plot Shapes and Labels
plotshape(bullEngulfing, style=shape.triangleup, location=location.abovebar, color=color.green)
plotshape(bearEngulfing, style=shape.triangledown, location=location.abovebar, color=color.red)

// Determine OP, SL, and TP
plot(bullEngulfing ? bullStop : na, title="Bullish Engulfing stop", color=color.red, linewidth=3, style=plot.style_linebr)
plot(bearEngulfing ? bearStop : na, title="Bearish Engulfing stop", color=color.red, linewidth=3, style=plot.style_linebr)
plot(bullEngulfing ? bullSL : na, title="Bullish Engulfing SL", color=color.red, linewidth=3, style=plot.style_linebr)
plot(bearEngulfing ? bearSL : na, title="Bearish Engulfing SL", color=color.red, linewidth=3, style=plot.style_linebr)
plot(bullEngulfing ? bullTP : na, title="Bullish Engulfing TP", color=color.green, linewidth=3, style=plot.style_linebr)
plot(bearEngulfing ? bearTP : na, title="Bearish Engulfing TP", color=color.green, linewidth=3, style=plot.style_linebr)