Stratégie de suivi de tendance à triple confirmation
Aperçu
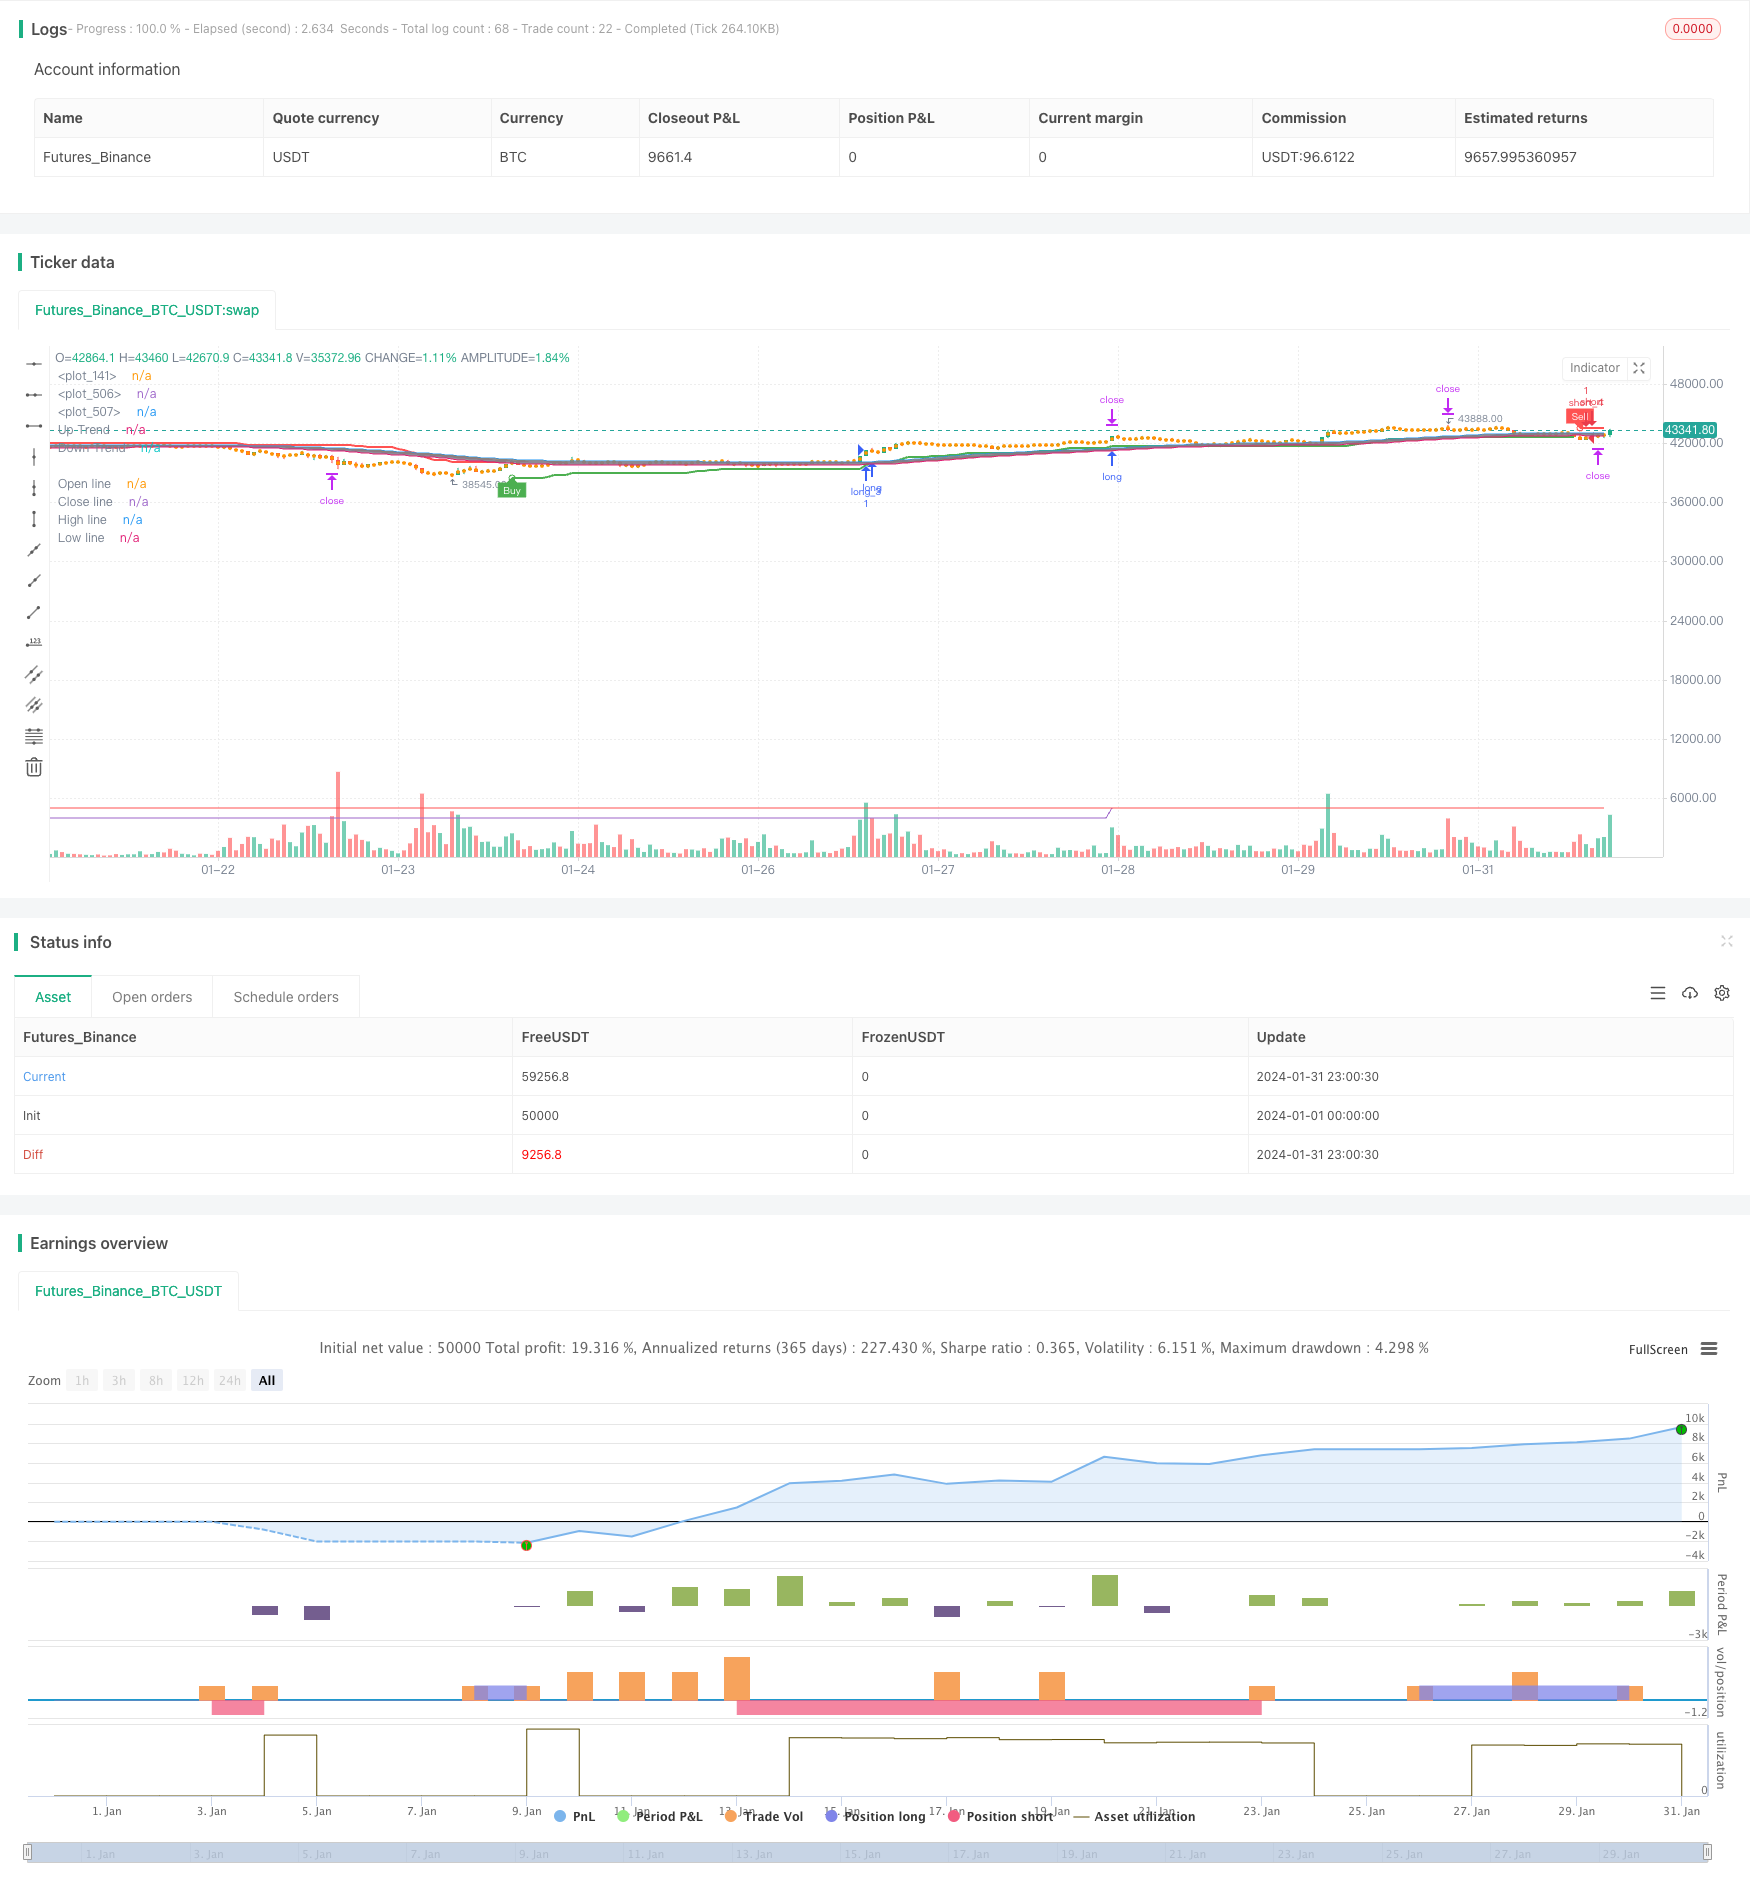
La stratégie de suivi de la tendance de triple confirmation permet de capturer une tendance à haute probabilité en combinant les signaux de trois indicateurs majeurs tels que la ligne moyenne, la ligne de mémoire et la super-tendance. Lorsque les trois indicateurs majeurs émettent simultanément un signal d’achat ou de vente, la stratégie entre en jeu et suit la tendance.
Principe de stratégie
La courbe de la moyenne
La stratégie utilise une ligne moyenne de 52 cycles pour déterminer la direction de la tendance principale. Lorsque le prix est au-dessus de la ligne moyenne, il est jugé comme une tendance à la hausse; lorsque le prix est au-dessous de la ligne moyenne, il est jugé comme une tendance à la baisse.
Inversion secondaire de la reconnaissance des lignes de mémoire
La stratégie utilise également la ligne d’intention pour identifier les inversions secondaires à court terme. La ligne d’intention est calculée de la même manière que la ligne moyenne, mais le prix de clôture est remplacé par le prix d’ouverture, ce qui permet de refléter plus rapidement les informations sur les inversions de prix.
Le point de basculement de la super tendance
La stratégie utilise également l’indicateur de super-tendance pour déterminer les points de retournement clés. L’indicateur de super-tendance utilise l’indicateur ATR pour déterminer la période de la fenêtre et les données de prix, afin d’ajuster dynamiquement les voies de montée et de descente et ainsi déterminer le moment de la reprise.
Triple confirmation du filtre
La stratégie ne fait plus que lorsque les trois indicateurs émettent simultanément un signal d’achat: la ligne moyenne, la ligne d’oubli et la super tendance. La stratégie est vide lorsque les trois indicateurs émettent simultanément des signaux de vente. La confirmation par le triple indicateur peut filtrer efficacement les faux signaux et augmenter la probabilité d’entrée.
Analyse des avantages
Le jugement multidimensionnel, une probabilité élevée
La stratégie consiste à combiner les trois indicateurs de la ligne moyenne, de la ligne d’oubli et de la super-tendance pour évaluer les tendances et les points critiques à partir de différentes dimensions, assurant une forte probabilité d’entrée.
Rapidement, en temps réel
L’introduction d’une ligne d’oubli assure que la stratégie peut réagir rapidement à la courte inversion de la ligne de prix; l’ATR s’adapte à l’indicateur de super-tendance du canal et peut également suivre les variations de prix en temps réel.
Arrêt automatique des pertes, contrôle efficace des risques
La stratégie est dotée d’une logique d’arrêt automatique, qui permet de régler le point d’arrêt en fonction de l’ATR dynamique et de contrôler efficacement les pertes individuelles.
Les risques et les solutions
Risques liés à la fréquence des transactions
La fréquence des signaux de négociation stratégique peut entraîner des transactions excessives. Il est possible d’augmenter de manière appropriée le paramètre de cycle de la ligne moyenne et de réduire la fréquence des transactions.
Risque d’incertitude inversée
L’effet de la ligne d’oubli et de l’indicateur de tendance super est incertain pour déterminer le point de retournement, il peut y avoir un risque d’erreur. Les conditions de filtrage des paramètres de l’indicateur peuvent être augmentées pour assurer un signal de retournement plus probable.
Les risques de pertes en cas de choc
Dans une situation de choc, la stratégie peut être fréquemment ouverte et arrêtée en raison d’un croisement répété, ce qui entraîne un risque de perte. La situation de choc peut être identifiée et le trading de la stratégie peut être suspendu à ce stade.
Direction d’optimisation
Indicateur de volatilité
On peut envisager de combiner des indicateurs de volatilité, tels que les bandes de Brin. Lorsque les prix sont proches de la bande de Brin vers le bas, il est préférable d’éviter d’ouvrir de nouvelles positions, ce qui permet d’éviter efficacement le risque de choc sur le marché.
Ajout de filtres d’entrée
Il est possible d’essayer d’ajouter d’autres indicateurs de jugement auxiliaires, tels que KDJ, MACD, etc., et d’entrer en jeu uniquement lorsqu’ils émettent également des signaux en même temps. Cela permet de filtrer davantage les faux signaux et de réduire les transactions inutiles.
Optimiser les stratégies de stop loss
Il est possible d’optimiser les stratégies de stop-loss, telles que le stop-move, le stop-move indexé, le stop-stop à mi-parcours, etc., pour augmenter et stabiliser les profits.
Résumer
La triple confirmation de la stratégie de suivi de la tendance exploite pleinement les avantages des trois indicateurs majeurs de la ligne moyenne, de la ligne d’oubli et de la super-tendance, permettant un jugement et une capture de tendance à haute probabilité. En même temps, un mécanisme de stop-loss automatique est mis en place pour contrôler efficacement les pertes individuelles.
/*backtest
start: 2024-01-01 00:00:00
end: 2024-01-31 23:59:59
period: 1h
basePeriod: 15m
exchanges: [{"eid":"Futures_Binance","currency":"BTC_USDT"}]
*/

//@version=5


//custom variables
hei_col = 0  //1 for green 0 for red
qqe_col = 0  //1 for blue 0 for red
supa_col = 0  //1 for buy 0 for sell
float upratr=0
float lwratr=0
//end


strategy(title='Death_star', overlay=true,calc_on_every_tick = true)

ma_type = input.string(title='MA Type', defval='EMA', options=['EMA', 'SMA', 'SWMA', 'VWMA', 'WMA'])
ma_period = input.int(title='MA Period (Length)', defval=52, minval=1)
ma_period_smoothing = input.int(title='MA Period smoothing (Length)', defval=10, minval=1)

color_positive = input(title='Positive color (Bullish)', defval=color.new(#26A69A, 50))
color_negative = input(title='Negative color (Bearish)', defval=color.new(#EF5350, 50))
color_hl = input(title='High & Low cloud color', defval=color.new(#808080, 80))

show_line = input(title='Show (lines)', defval=false)
show_hl_cloud = input(title='Show (High & Low cloud)', defval=true)
show_oc_cloud = input(title='Show (Open & Close cloud)', defval=true)

//————————————————————————————————————————————————————————————————————————————————
// I.2. Settings, Function definition — — — — — — — — — — — — — — — — — — — — — —
//————————————————————————————————————————————————————————————————————————————————

f_ma_type(input_ma_type, input_source, input_ma_period) =>
    result = float(na)

    if input_ma_type == 'EMA'
        result := ta.ema(input_source, input_ma_period)
        result
    if input_ma_type == 'SMA'
        result := ta.sma(input_source, input_ma_period)
        result
    if input_ma_type == 'SWMA'
        result := ta.swma(input_source)
        result
    if input_ma_type == 'VWMA'
        result := ta.vwma(input_source, input_ma_period)
        result
    if input_ma_type == 'WMA'
        result := ta.wma(input_source, input_ma_period)
        result

    result

//————————————————————————————————————————————————————————————————————————————————
// II.1. Calculations, MA — — — — — — — — — — — — — — — — — — — — — — — — — — — —
//————————————————————————————————————————————————————————————————————————————————

o = f_ma_type(ma_type, open, ma_period)
c = f_ma_type(ma_type, close, ma_period)
h = f_ma_type(ma_type, high, ma_period)
l = f_ma_type(ma_type, low, ma_period)

//————————————————————————————————————————————————————————————————————————————————
// II.2. Calculations, Heikin Ashi — — — — — — — — — — — — — — — — — — — — — — — —
//————————————————————————————————————————————————————————————————————————————————

ha = ticker.heikinashi(syminfo.tickerid)

ha_o = request.security(ha, timeframe.period, o)
ha_c = request.security(ha, timeframe.period, c)
ha_h = request.security(ha, timeframe.period, h)
ha_l = request.security(ha, timeframe.period, l)

//————————————————————————————————————————————————————————————————————————————————
// II.3. Calculations, MA (Smoothing) — — — — — — — — — — — — — — — — — — — — — —
//————————————————————————————————————————————————————————————————————————————————

ha_o_smooth = f_ma_type(ma_type, ha_o, ma_period_smoothing)
ha_c_smooth = f_ma_type(ma_type, ha_c, ma_period_smoothing)
ha_h_smooth = f_ma_type(ma_type, ha_h, ma_period_smoothing)
ha_l_smooth = f_ma_type(ma_type, ha_l, ma_period_smoothing)

//————————————————————————————————————————————————————————————————————————————————
// III.1. Display, Colors — — — — — — — — — — — — — — — — — — — — — — — — — — — —
//————————————————————————————————————————————————————————————————————————————————

tren = ha_c_smooth >= ha_o_smooth

color_trend = tren ? color_positive : color_negative

hei_col := tren ? 1 : 0

color_show_line_positive = show_line ? color_positive : na
color_show_line_negative = show_line ? color_negative : na

color_show_hl_cloud = show_hl_cloud ? color_hl : na
color_show_oc_cloud = show_oc_cloud ? color_trend : na

//————————————————————————————————————————————————————————————————————————————————
// III.2. Display, Plotting & Filling — — — — — — — — — — — — — — — — — — — — — —
//————————————————————————————————————————————————————————————————————————————————

o_line = plot(ha_o_smooth, color=color_show_line_positive, title='Open line')
c_line = plot(ha_c_smooth, color=color_show_line_negative, title='Close line')

h_line = plot(ha_h_smooth, color=color_show_line_positive, title='High line')
l_line = plot(ha_l_smooth, color=color_show_line_negative, title='Low line')

fill(o_line, c_line, color=color_show_oc_cloud, title='Open & Close Trendcloud', transp=90)
fill(h_line, l_line, color=color_show_hl_cloud, title='High & Low Trendcloud', transp=90)

upratr:=(ha_h_smooth)
lwratr:=(ha_l_smooth)
// supa


Periods = input(title='ATR Period', defval=9)
src = input(hl2, title='Source')
Multiplier = input.float(title='ATR Multiplier', step=0.1, defval=3.9)
changeATR = input(title='Change ATR Calculation Method ?', defval=true)
showsignals = input(title='Show Buy/Sell Signals ?', defval=true)
highlighting = input(title='Highlighter On/Off ?', defval=true)
atr2 = ta.sma(ta.tr, Periods)
atr = changeATR ? ta.atr(Periods) : atr2
up = src - Multiplier * atr
up1 = nz(up[1], up)
up := close[1] > up1 ? math.max(up, up1) : up
dn = src + Multiplier * atr
dn1 = nz(dn[1], dn)
dn := close[1] < dn1 ? math.min(dn, dn1) : dn
trend = 1
trend := nz(trend[1], trend)
trend := trend == -1 and close > dn1 ? 1 : trend == 1 and close < up1 ? -1 : trend
upPlot = plot(trend == 1 ? up : na, title='Up Trend', style=plot.style_linebr, linewidth=2, color=color.new(color.green, 0))
buySignal = trend == 1 and trend[1] == -1
plotshape(buySignal ? up : na, title='UpTrend Begins', location=location.absolute, style=shape.circle, size=size.tiny, color=color.new(color.green, 0))
plotshape(buySignal and showsignals ? up : na, title='Buy', text='Buy', location=location.absolute, style=shape.labelup, size=size.tiny, color=color.new(color.green, 0), textcolor=color.new(color.white, 0))
dnPlot = plot(trend == 1 ? na : dn, title='Down Trend', style=plot.style_linebr, linewidth=2, color=color.new(color.red, 0))
sellSignal = trend == -1 and trend[1] == 1
plotshape(sellSignal ? dn : na, title='DownTrend Begins', location=location.absolute, style=shape.circle, size=size.tiny, color=color.new(color.red, 0))
plotshape(sellSignal and showsignals ? dn : na, title='Sell', text='Sell', location=location.absolute, style=shape.labeldown, size=size.tiny, color=color.new(color.red, 0), textcolor=color.new(color.white, 0))
mPlot = plot(ohlc4, title='', style=plot.style_circles, linewidth=0)
longFillColor = highlighting ? trend == 1 ? color.green : color.white : color.white
shortFillColor = highlighting ? trend == -1 ? color.red : color.white : color.white
supa_col := trend == 1 ? 1 : 0
fill(mPlot, upPlot, title='UpTrend Highligter', color=longFillColor, transp=90)
fill(mPlot, dnPlot, title='DownTrend Highligter', color=shortFillColor, transp=90)
alertcondition(buySignal, title='SuperTrend Buy', message='SuperTrend Buy!')
alertcondition(sellSignal, title='SuperTrend Sell', message='SuperTrend Sell!')
changeCond = trend != trend[1]
alertcondition(changeCond, title='SuperTrend Direction Change', message='SuperTrend has changed direction!')

//QQE


//By Glaz, Modified
//study("QQE MOD")
RSI_Period = input(6, title='RSI Length')
SF = input(5, title='RSI Smoothing')
QQE = input(3, title='Fast QQE Factor')
ThreshHold = input(3, title='Thresh-hold')
//

srctt = input(close, title='RSI Source')
//

//
Wilders_Period = RSI_Period * 2 - 1


Rsi = ta.rsi(srctt, RSI_Period)
RsiMa = ta.ema(Rsi, SF)
AtrRsi = math.abs(RsiMa[1] - RsiMa)
MaAtrRsi = ta.ema(AtrRsi, Wilders_Period)
dar = ta.ema(MaAtrRsi, Wilders_Period) * QQE

longband = 0.0
shortband = 0.0
trenda = 0

DeltaFastAtrRsi = dar
RSIndex = RsiMa
newshortband = RSIndex + DeltaFastAtrRsi
newlongband = RSIndex - DeltaFastAtrRsi
longband := RSIndex[1] > longband[1] and RSIndex > longband[1] ? math.max(longband[1], newlongband) : newlongband
shortband := RSIndex[1] < shortband[1] and RSIndex < shortband[1] ? math.min(shortband[1], newshortband) : newshortband
cross_1 = ta.cross(longband[1], RSIndex)
trenda := ta.cross(RSIndex, shortband[1]) ? 1 : cross_1 ? -1 : nz(trenda[1], 1)
FastAtrRsiTL = trenda == 1 ? longband : shortband
////////////////////


length = input.int(50, minval=1, title='Bollinger Length')
mult = input.float(0.35, minval=0.001, maxval=5, step=0.1, title='BB Multiplier')
basis = ta.sma(FastAtrRsiTL - 50, length)
dev = mult * ta.stdev(FastAtrRsiTL - 50, length)
upper = basis + dev
lower = basis - dev
color_bar = RsiMa - 50 > upper ? #00c3ff : RsiMa - 50 < lower ? #ff0062 : color.gray


//
// Zero cross
QQEzlong = 0
QQEzlong := nz(QQEzlong[1])
QQEzshort = 0
QQEzshort := nz(QQEzshort[1])
QQEzlong := RSIndex >= 50 ? QQEzlong + 1 : 0
QQEzshort := RSIndex < 50 ? QQEzshort + 1 : 0
//

//Zero = hline(0, color=color.rgb(116, 26, 26), linestyle=hline.style_dotted, linewidth=1)

////////////////////////////////////////////////////////////////

RSI_Period2 = input(6, title='RSI Length')
SF2 = input(5, title='RSI Smoothing')
QQE2 = input(1.61, title='Fast QQE2 Factor')
ThreshHold2 = input(3, title='Thresh-hold')

src2 = input(close, title='RSI Source')
//

//
Wilders_Period2 = RSI_Period2 * 2 - 1


Rsi2 = ta.rsi(src2, RSI_Period2)
RsiMa2 = ta.ema(Rsi2, SF2)
AtrRsi2 = math.abs(RsiMa2[1] - RsiMa2)
MaAtrRsi2 = ta.ema(AtrRsi2, Wilders_Period2)
dar2 = ta.ema(MaAtrRsi2, Wilders_Period2) * QQE2
longband2 = 0.0
shortband2 = 0.0
trend2 = 0

DeltaFastAtrRsi2 = dar2
RSIndex2 = RsiMa2
newshortband2 = RSIndex2 + DeltaFastAtrRsi2
newlongband2 = RSIndex2 - DeltaFastAtrRsi2
longband2 := RSIndex2[1] > longband2[1] and RSIndex2 > longband2[1] ? math.max(longband2[1], newlongband2) : newlongband2
shortband2 := RSIndex2[1] < shortband2[1] and RSIndex2 < shortband2[1] ? math.min(shortband2[1], newshortband2) : newshortband2
cross_2 = ta.cross(longband2[1], RSIndex2)
trend2 := ta.cross(RSIndex2, shortband2[1]) ? 1 : cross_2 ? -1 : nz(trend2[1], 1)
FastAtrRsi2TL = trend2 == 1 ? longband2 : shortband2


//
// Zero cross
QQE2zlong = 0
QQE2zlong := nz(QQE2zlong[1])
QQE2zshort = 0
QQE2zshort := nz(QQE2zshort[1])
QQE2zlong := RSIndex2 >= 50 ? QQE2zlong + 1 : 0
QQE2zshort := RSIndex2 < 50 ? QQE2zshort + 1 : 0
//

hcolor2 = RsiMa2 - 50 > ThreshHold2 ? color.silver : RsiMa2 - 50 < 0 - ThreshHold2 ? color.silver : na
// plot(FastAtrRsi2TL - 50, title='QQE Line', color=color.new(color.white, 0), linewidth=2)
// plot(RsiMa2 - 50, color=hcolor2, title='Histo2', style=plot.style_columns, transp=50)

Greenbar1 = RsiMa2 - 50 > ThreshHold2
Greenbar2 = RsiMa - 50 > upper

Redbar1 = RsiMa2 - 50 < 0 - ThreshHold2
Redbar2 = RsiMa - 50 < lower
// plot(Greenbar1 and Greenbar2 == 1 ? RsiMa2 - 50 : na, title='QQE Up', style=plot.style_columns, color=color.new(#00c3ff, 0))
// plot(Redbar1 and Redbar2 == 1 ? RsiMa2 - 50 : na, title='QQE Down', style=plot.style_columns, color=color.new(#ff0062, 0))

qqe_col:=Greenbar1 and Greenbar2 == 1 ?1:(Redbar1 and Redbar2 == 1 ?0:-1)


//lab=label.new(bar_index,50,str.tostring(qqe_col))


// ////////////////////////////////////////////////////////////////

// //custom code

// ////////////////////////////////////////////////////////////////


// sma=((lhitt+shitt)/cnt)
// plot(sma*1000)
// plot(250,color=color.red)


//begin


sess=input("0916-1200","time for reversals!!")
v=time(timeframe.period,sess)
rr=input.float(1,"enter the reward..def is 3")
on=na(v)?false:true
bool daybreak=input.bool(false,"daybreak ? true means day end close")
bool apply_on=input.bool(true,"do u want time for reversal?")
apply_on:=not apply_on
test=input.int(2,"train(0) test(1) all(2)?")
// if str.tonumber(timeframe.period)!=5
//     runtime.error("backtests and stocks only valid for 5 min tf!!")
on:=apply_on or on


pts=1/syminfo.mintick
var float sl=0
var float profit=0
// var dud=0
// var counter=0
var con_win=0
var con_lose=0
var tempwin=0
var templose=0
//adding analytics variables
var float[] stararr=array.new_float(10,-1)
var float[] sslarr=array.new_float(10,-1)
var float skipper=-1
var float[] ltararr=array.new_float(10,-1)
var float[] lslarr=array.new_float(10,-1)

var float lhit=0
var float shit=0
var float miss=0
var float cnt=0
var lflag=0
var sflag=0
var i=0
var dud=0
var gap=0
float begin=0
float end=0
// ei_col = 0  //1 for green 0 for red
// qqe_col = 0  //1 for blue 0 for red
// supa_col = 0
//plot(i)
//code begins here
if test==0
    begin:=0
    end:=5500/2
else if test==1
    begin:=5500/2
    end:=bar_index
else if test==2
    begin:=0
    end:=bar_index


if  hei_col==1 and qqe_col==1 and supa_col==1 and lflag==0 and low>upratr and bar_index>=begin and bar_index<=end and on
    lflag:=1
    sflag:=0
    if array.get(lslarr,i)!=-1
        dud:=dud+1
    array.set(lslarr,i,upratr)
    array.set(ltararr,i,(close+rr*(close-upratr)))
    cnt:=cnt+1
    skipper:=i
   // lab=label.new(bar_index,close+100,str.tostring(array.get(lslarr,i)) +"\n"+  str.tostring(array.get(ltararr,i)) +"\n"+str.tostring(i))
    i:=(i+1)%9
    strategy.order("long_"+str.tostring(i-1),strategy.long,1)
    strategy.order("sl_l"+str.tostring(i-1),strategy.short,stop=upratr,oca_name = "exit"+str.tostring(i-1))
    strategy.order("target_l"+str.tostring(i-1),strategy.short,limit=((close+rr*(close-upratr))),oca_name = "exit"+str.tostring(i-1))

if  hei_col==0 and qqe_col==0 and supa_col==0 and sflag==0 and high<lwratr and bar_index>=begin and bar_index<=end and on
    sflag:=1
    lflag:=0
    if array.get(sslarr,i)!=-1
        dud:=dud+1
    array.set(sslarr,i,lwratr)
    array.set(stararr,i,(close-rr*(lwratr-close)))
    skipper:=i
  //  lab=label.new(bar_index,close+100,str.tostring(array.get(sslarr,i)) +"\n"+  str.tostring(array.get(stararr,i)) +"\n"+str.tostring(i))
    i:=(i+1)%9
    cnt:=cnt+1
    strategy.order("short_"+str.tostring(i-1),strategy.short,1)
    strategy.order("sl_s"+str.tostring(i-1),strategy.long,stop=lwratr,oca_name = "exit"+str.tostring(i-1))
    strategy.order("target_s"+str.tostring(i-1),strategy.long,limit=((close-rr*(lwratr-close))),oca_name = "exit"+str.tostring(i-1))


for j=0 to 9
    if array.get(lslarr,j)!=-1 and j!=skipper
        if low < array.get(lslarr,j)  and array.get(lslarr,j)!=-1// and open>array.get(lslarr,j)
            miss:=miss+1
            array.set(ltararr,j,-1)
            array.set(lslarr,j,-1)

        else if high > array.get(ltararr,j)  and array.get(lslarr,j)!=-1 //and open<array.get(ltararr,j)
            lhit:=lhit+1
            array.set(ltararr,j,-1)
            array.set(lslarr,j,-1)

    if array.get(sslarr,j)!=-1 and j!=skipper


        if high > array.get(sslarr,j) and array.get(sslarr,j)!=-1 //and open<array.get(sslarr,j)
            miss:=miss+1
            array.set(stararr,j,-1)
            array.set(sslarr,j,-1)
        else if low < array.get(stararr,j) and array.get(sslarr,j)!=-1 //and open>array.get(stararr,j)
            shit:=shit+1
            array.set(stararr,j,-1)
            array.set(sslarr,j,-1)
skipper:=-1
var day_miss=0
string ender=""
if (timeframe.period)=="1"
    ender:="1528-1529"
else if (timeframe.period)=="5"
    ender:="1520-1525"
else if (timeframe.period)=="15"
    ender:="1500-1515"
else if (timeframe.period)=="60"
    ender:="1330-1430"
else
    //runtime.error("not accounted tf!!")
    daybreak:=false
if time(timeframe.period,ender) and daybreak
    if strategy.position_size!=0
        day_miss+=1
        strategy.cancel_all()
        strategy.close_all("day_end_close")
        for k=0 to (array.size(stararr)==0?na:(array.size(stararr)-1))
            array.set(stararr,k,-1)
            array.set(sslarr,k,-1)

            array.set(ltararr,k,-1)
            array.set(lslarr,k,-1)
    i:=0


if (lhit+shit)>(lhit[1]+shit[1])
    tempwin:=tempwin+1
    templose:=0

else if (miss)>(miss[1])
    templose:=templose+1
    tempwin:=0

if tempwin>con_win
    con_win:=tempwin
if templose>con_lose
    con_lose:=templose


// //*********************adding randomness indicator************

var float nhit=0,var float nphit=0
if cnt%10==0 and cnt>0
    nhit:=(lhit+shit)-nphit
    nphit:=(lhit+shit)

t=table.new(position.top_right,1,6,bgcolor = color.rgb(236, 172, 172))
table.cell(t,0,0,str.tostring(((lhit+shit)/cnt)*100))
table.cell(t,0,1,str.tostring(((lhit+shit)/(lhit+shit+miss))*100))
table.cell(t,0,2,"daymiss "+str.tostring(day_miss))
//table.cell(t,0,1,str.tostring(((lhit)/cnt)*100))
//table.cell(t,0,2,str.tostring(((shit)/cnt)*100))
table.cell(t,0,3,str.tostring(con_win))
// table.cell(t,0,4,str.tostring(gap))
table.cell(t,0,4,str.tostring(con_lose))
table.cell(t,0,5,str.tostring(cnt))
//plot(1000*cnt,color =color.rgb(105, 28, 28))
// // plot(40000+lhit+shit,color=strategy.closedtrades%10==0?color.green:color.white,style=plot.style_circles)
//plot(1000*(lhit+shit),color=color.green)
//plot(1000*miss,color=color.red)

// // hitrate=strategy.wintrades/strategy.closedtrades
// // plot(hitrate*100)
// // plot(strategy.wintrades)
//plot(nhit*10000)
//dud is overwritten trades whereas day_miss are the trades closed at days end

// sma=(lhit+shit)/(lhit+shit+miss)
// plot(sma*100000)
// plot(50000,color=color.red)

// plot(con_win*1000,color=color.green)
// plot(con_lose*1000,color=color.red)


var float[] dat=array.new_float(10,-1)
var dati=0
var float datp=0
if miss>miss[1]
    for cd=0 to ((miss-miss[1])-1)
        array.set(dat,dati,0)
        dati:=(dati+1)%10
if (lhit+shit)>(lhit[1]+shit[1])
    for cd=0 to (  ((lhit+shit)-(lhit[1]+shit[1]))  -1)
        array.set(dat,dati,1)
        dati:=(dati+1)%10

if array.get(dat,9)!=-1
    for cd=0 to 9
        datp:=datp+array.get(dat,cd)

plot((datp/10)*10000)
plot(5000,color = color.red)
datp:=0