Stratégie de trading combinée de la percée de clôture des triples bandes BB et de l'indicateur RSI
Aperçu
La stratégie génère des signaux de trading en combinant l’indicateur de la ceinture de Brin et l’indicateur RSI, un indice relativement faible. Elle surveille si le prix de clôture des trois lignes K est en train de franchir la trajectoire ascendante ou descendante en même temps, et confirme les signaux de trading en combinant l’indicateur de tour de force et l’indicateur RSI.
Principe de stratégie
La stratégie est basée sur les principes suivants:
- Utilisation d’une bande de 20 pouces de longueur pour émettre des signaux de négociation lorsque la clôture du cours est sur une trajectoire ascendante ou descendante
- Les prix de clôture des trois lignes K doivent être atteints simultanément pour éviter de fausses ruptures.
- Combiné avec l’indicateur de tour de force, le VIP est supérieur à 1,25 pour le surachat fort, et le VIM est supérieur à 1,25 pour le survente fort, un signal de filtrage
- En combinant l’indicateur RSI pour déterminer si vous êtes en survente ou en survente, le RSI au-dessus de 70 est considéré comme négatif, le RSI au-dessous de 30 est considéré comme négatif
- Génération d’un signal plus ou moins lorsque les conditions ci-dessus sont remplies
Analyse des avantages
Les principaux avantages de cette stratégie sont les suivants:
- Les bandes triple BB filtrent les fausses percées, assurant la fiabilité de la percée
- Les indicateurs de tour de force permettent de juger la force du marché et d’éviter les transactions défavorables
- L’indicateur RSI détermine les zones de survente et d’excédent, en combinaison avec l’indicateur Brin pour l’entrée
- Une combinaison d’indicateurs multiples, un jugement global sur la situation du marché et une fiabilité élevée du signal
Analyse des risques
Cette stratégie comporte aussi des risques:
- L’indicateur de bande de Brin est sensible aux paramètres et nécessite une optimisation de la longueur et du nombre de fois StdDev
- L’indicateur d’engrenage est également plus sensible aux paramètres cycliques et nécessite des ajustements dans différents marchés.
- L’indicateur RSI est sujet aux déviations et peut manquer la tendance
- Si vous êtes en désaccord sur ces trois critères, vous ne pourrez pas entrer et vous manquerez une partie de votre chance.
Les mesures de contrôle des risques comprennent:
- Paramètres d’optimisation, testé le paramètre avec le plus haut taux de réussite
- En combinaison avec d’autres indicateurs, tels que le filtrage du volume des transactions
- La logique de jugement des indicateurs doit être assouplie de manière appropriée pour éviter de rater des opportunités.
Direction d’optimisation
Cette stratégie peut être optimisée dans les domaines suivants:
- Optimiser la longueur et le coefficient StdDev de l’indicateur de la bande de Bryn pour trouver le paramètre optimal
- Optimisation de la cyclicité de l’indicateur des engrenages afin de le rendre plus adapté aux différents marchés
- Ajout d’autres indicateurs de jugement, tels que le volume des transactions, le macd, etc., pour enrichir les signaux de diversité
- Adaptation de la logique de jugement des indicateurs pour éviter que les divergences d’indicateurs ne conduisent à l’exclusion
- Augmentation des stratégies de stop loss pour contrôler les pertes maximales sur une seule transaction
Résumer
Cette stratégie utilise de multiples indicateurs pour juger, tout en assurant la fiabilité du signal. Par des moyens tels que l’optimisation des paramètres, l’enrichissement de la source de signal, l’ajustement de la logique de jugement et la suspension des pertes, la stabilité et la rentabilité de la stratégie peuvent être encore améliorées.
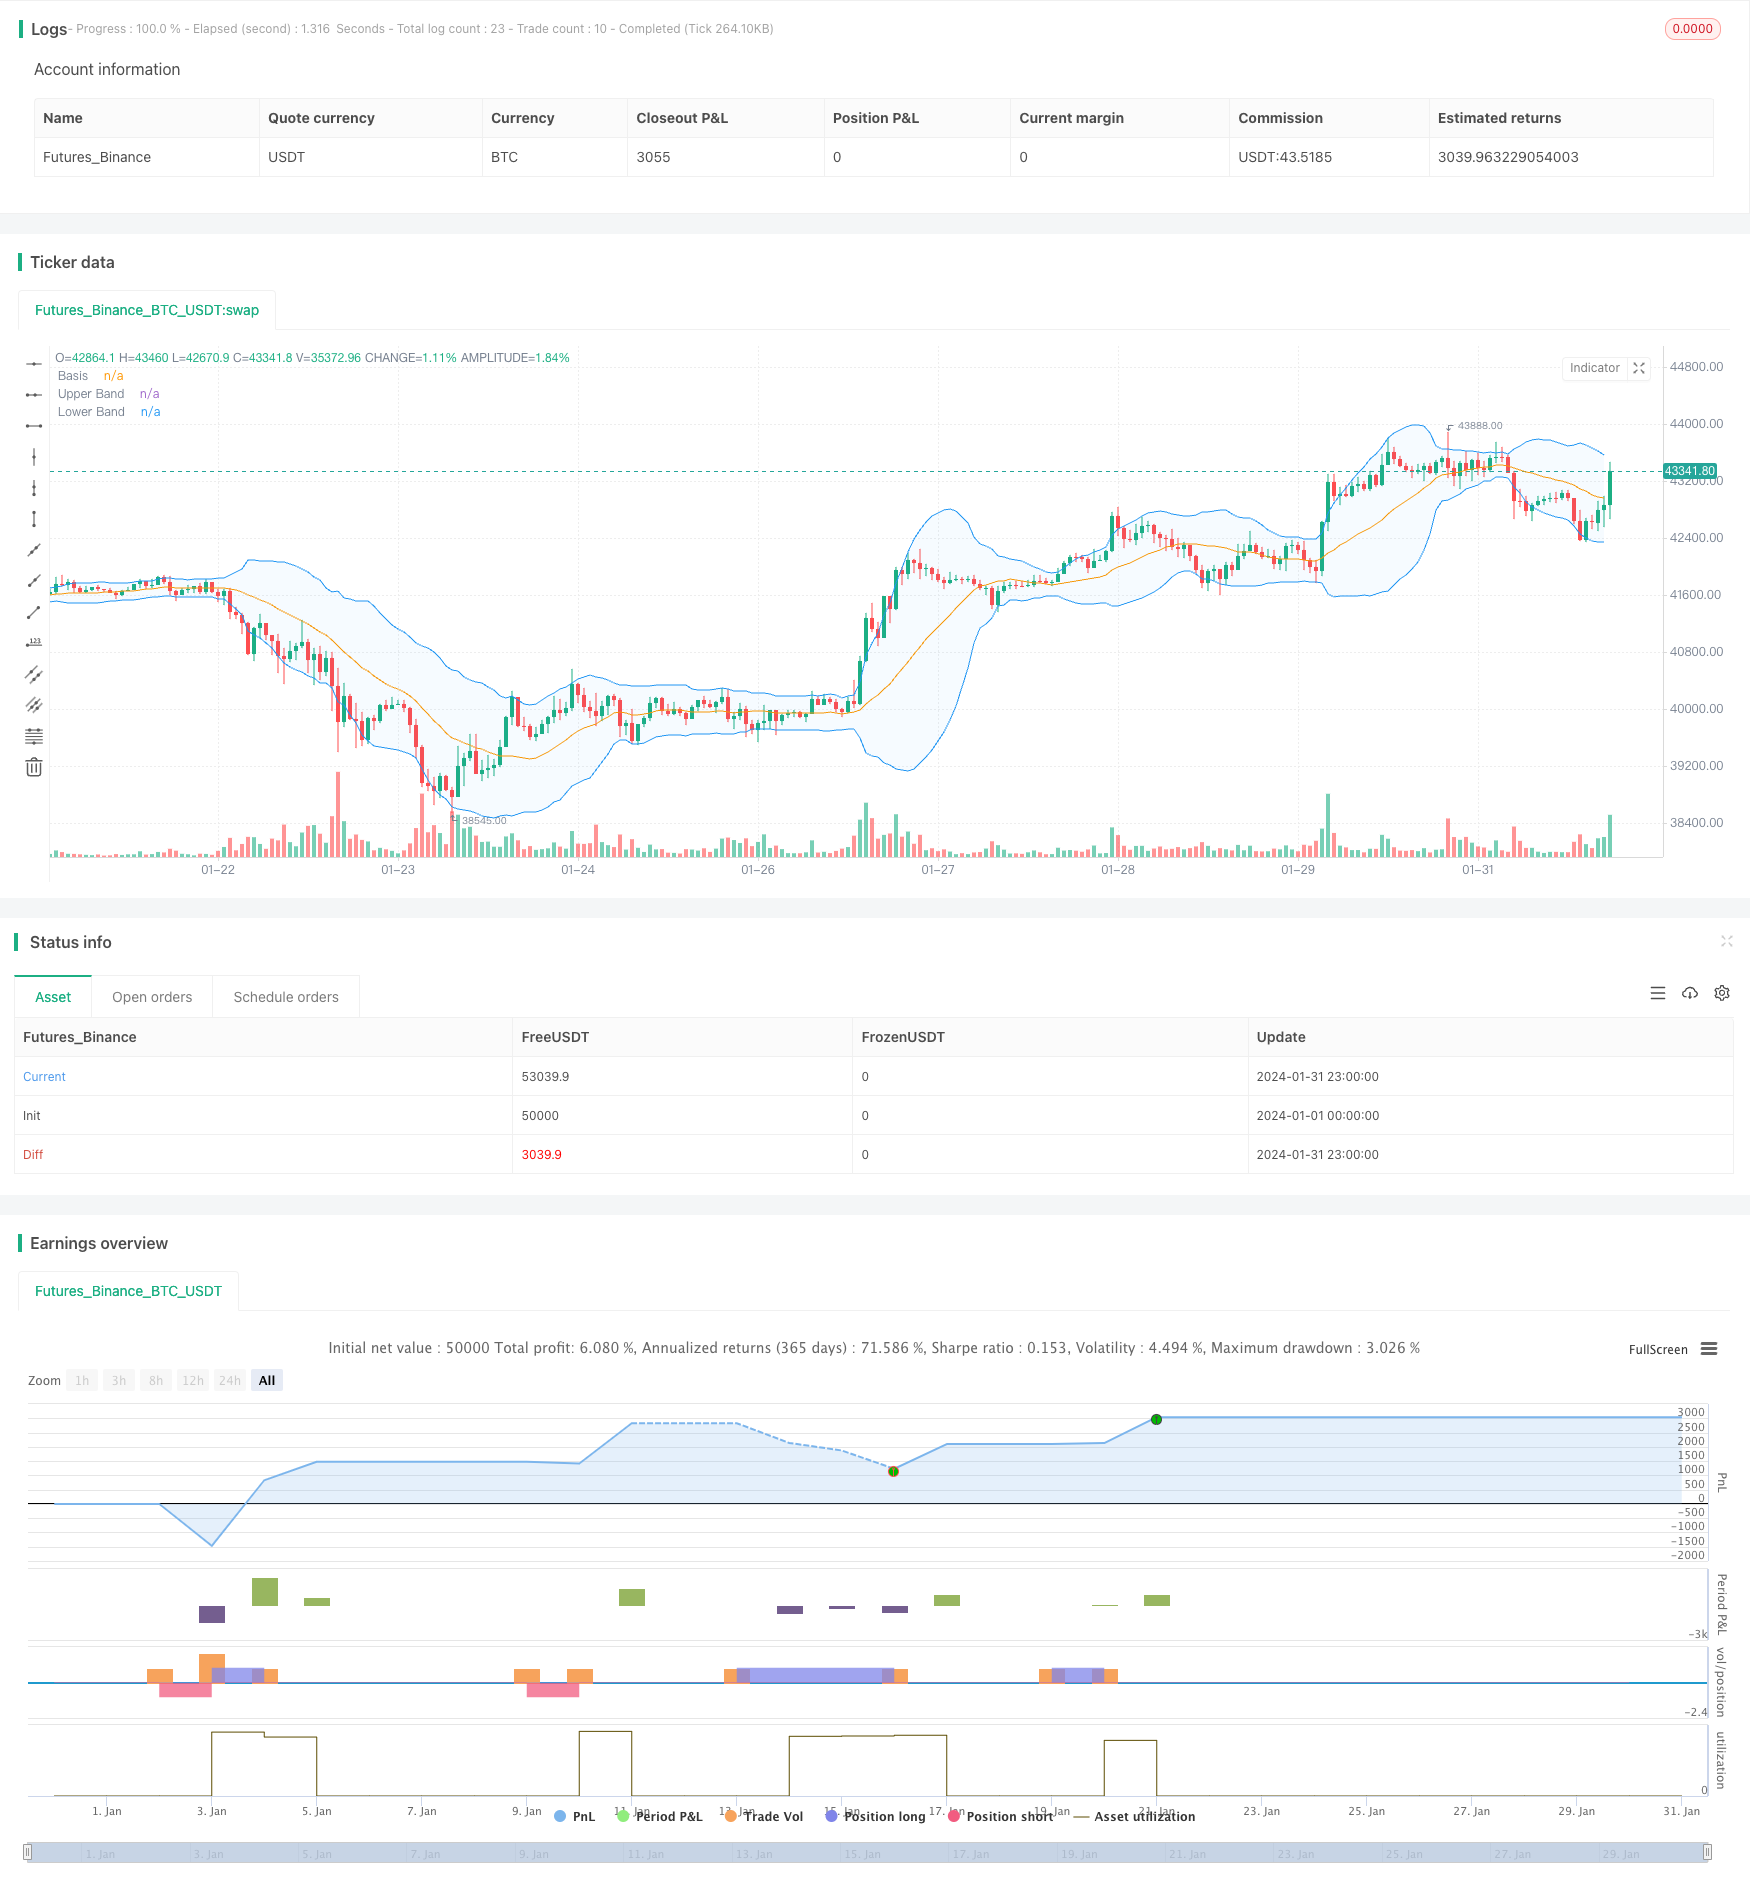
/*backtest
start: 2024-01-01 00:00:00
end: 2024-01-31 23:59:59
period: 1h
basePeriod: 15m
exchanges: [{"eid":"Futures_Binance","currency":"BTC_USDT"}]
*/

// This Pine Script™ code is subject to the terms of the Mozilla Public License 2.0 at https://mozilla.org/MPL/2.0/
// © Noway0utstorm

//@version=5
strategy(title='RSI + BB  over 3 bar+--- vortex0.71.3  ', shorttitle='NoWaytruongphuthinh', format=format.price, precision=4,overlay = true)

length = input(20, title="Length")
mult = input(2.0, title="Multiplier")
source = close

basis = ta.sma(source, length)
dev = mult * ta.stdev(source, length)

upperBand = basis + dev
lowerBand = basis - dev

isClosedBar = ta.change(time("15"))

var bool closeAboveUpperBand = false
var bool closeBelowLowerBand = false


// Vortex Indicator Settings
period_ = input.int(14, title='Period', minval=2)

VMP = math.sum(math.abs(high - low[1]), period_)
VMM = math.sum(math.abs(low - high[1]), period_)
STR = math.sum(ta.atr(1), period_)
VIP = VMP / STR
VIM = VMM / STR

//
lengthrsi = input(14, title="RSI Length")
overboughtLevel = input(70, title="Overbought Level")
oversoldLevel = input(30, title="Oversold Level")

sourcersi = close
rsiValue = ta.rsi(sourcersi, lengthrsi)

shouldShort = rsiValue > overboughtLevel
shouldLong = rsiValue < oversoldLevel


if bool(isClosedBar[1]) and bool(isClosedBar[2]) and bool(isClosedBar[3])

    if close[1] > upperBand[1] and close[2] > upperBand[2] and close[3] > upperBand[3] and VIP > 1.25 and VIM < 0.7 and rsiValue > overboughtLevel
        strategy.entry("Short", strategy.short)
        closeAboveUpperBand := false  // Reset the condition when entering a new Short position
    if close[1] < lowerBand[1] and close[2] < lowerBand[2] and close[3] < lowerBand[3] and VIP < 0.7 and VIM > 1.25 and rsiValue < oversoldLevel
        strategy.entry("Long", strategy.long)
        closeBelowLowerBand := false  // Reset the condition when entering a new Long position


if strategy.position_size > 0  // Check if there is an open Long position
    closeAboveUpperBand := close > upperBand  // Update the condition based on close price
    if closeAboveUpperBand
        strategy.close("Long",disable_alert=true)  // Close the Long position if close price is above upper band

if strategy.position_size < 0  // Check if there is an open Short position
    closeBelowLowerBand := close < lowerBand  // Update the condition based on close price
    if closeBelowLowerBand
        strategy.close("Short",disable_alert=true)  // Close the Short position if close price is below lower band

// Plots
plot(basis, color=color.orange, title="Basis")
p1 = plot(upperBand, color=color.blue, title="Upper Band")
p2 = plot(lowerBand, color=color.blue, title="Lower Band")
fill(p1, p2, title = "Background", color=color.rgb(33, 150, 243, 95))