Stratégie de suivi de tendance sur plusieurs périodes de temps basée sur des indicateurs de support, de résistance et de momentum
Aperçu de la stratégie
La stratégie utilise plusieurs indicateurs techniques tels que le niveau de résistance de soutien, l’indicateur de tendance supérieure et la moyenne mobile pour déterminer la direction de la tendance sur plusieurs périodes de temps. L’idée principale de la stratégie est d’utiliser d’abord le point pivot pour déterminer la position de résistance de soutien dans le prix actuel, puis de déterminer la direction de la tendance actuelle avec l’indicateur de tendance supérieure, et enfin de filtrer la tendance par rapport à la moyenne mobile.
Principe de stratégie
- Tout d’abord, calculer le pivot en fonction du prix le plus élevé ou le plus bas d’un certain cycle passé pour obtenir le point de résistance de soutien du prix actuel.
- Le Supertrend est un indicateur de suivi des tendances. Il est calculé à partir de la résistance au support dynamique.
- La stratégie a ajouté l’ATR comme point d’arrêt sur la base de la super tendance initiale.
- Filtrez les tendances avec une moyenne mobile. Ne faites plus que lorsque la tendance est à la hausse et que le prix est au-dessus de la moyenne, et faites moins lorsque la tendance est à la baisse et que le prix est en dessous de la moyenne.
- Configurer une fenêtre de temps de négociation. Ouvrir une position seulement dans un intervalle de temps spécifique, pour éviter de négocier à des moments importants.
- Les positions multiples ouvertes sont gérées séparément. Les signaux multiples et vides déclenchent respectivement la logique d’ouverture des positions.
Dans l’ensemble, la stratégie consiste à ouvrir une position lorsque les trois conditions résonnent: résistance, direction de la super-tendance et direction de la ligne de symétrie, qui soutiennent le pivot. Si aucune condition n’est remplie, la position est nulle. Cela permet de saisir efficacement la tendance tout en contrôlant le risque.
Analyse des avantages
- L’avantage de la négociation basée sur le support de la résistance réside dans le fait qu’elle est conforme aux lois de l’offre et de la demande du marché, et que le pivot peut réagir dynamiquement à l’équilibre du marché.
- Les supertrends permettent de capturer efficacement les tendances et de les arrêter en temps opportun. Les arrêts ATR permettent de contrôler davantage le risque.
- Le filtrage de la ligne égale évite les transactions à contre-courant. Le gain est plus élevé lorsque la tendance et la ligne égale résonnent.
- La fenêtre de temps de transaction personnalisée évite dans une certaine mesure de négocier à des moments importants, tels que l’ouverture et la fermeture du marché.
- Les signaux multi-tête et à tête vide fonctionnent indépendamment les uns des autres et permettent de détenir simultanément plusieurs positions vides, ce qui permet de mieux exploiter les opportunités du marché.
Analyse des risques
- Le risque d’une négociation fréquente. Cette stratégie peut entraîner une ouverture fréquente de positions en cours sur des marchés instables, ce qui entraîne des coûts de négociation excessifs.
- Il est toujours possible d’effectuer des transactions à la baisse. Bien que la stratégie utilise un filtre de ligne moyenne, il est toujours possible d’effectuer des transactions à la baisse si la ligne moyenne elle-même est contraire à la tendance générale.
- Optimisation des paramètres. Les stratégies comportent de nombreux paramètres, tels que les cycles et les multiplications des supertrends, les cycles de la moyenne, etc. Les différents paramètres donneront des résultats différents, et il est difficile de choisir la combinaison optimale de paramètres.
- Dans des situations extrêmes, comme une chute brutale ou une crise de liquidité, la stratégie peut ne pas être en mesure d’arrêter les pertes en temps opportun.
Direction d’optimisation
- L’introduction de plus de courbes moyennes à moyen et long terme, une meilleure fiabilité dans le jugement des tendances et une réduction de la fréquence des transactions.
- L’introduction d’indicateurs de volatilité, tels que les bandes de Brin, peut être envisagée pour réduire les transactions sur les marchés à forte volatilité.
- Optimiser les paramètres pour trouver la meilleure combinaison de paramètres et améliorer la stabilité de la stratégie
- En cas d’extrême situation, il est possible d’inclure des jugements sur les fluctuations inhabituelles du marché, comme les sauts de prix, la flambée des transactions, etc., et de réduire ou d’arrêter les transactions en cas d’exception.
Résumer
Cette stratégie intègre plusieurs méthodes d’analyse technique telles que la résistance de soutien, le suivi de la tendance et le filtrage de la dynamique, permettant de tirer des bénéfices efficaces dans la tendance, tout en contrôlant les risques de rétractation. Son avantage réside dans le fait que le signal est clair et concis, logiquement clair et adapté à une utilisation sur un cycle moyen à long terme. Cependant, la stratégie présente également des problèmes tels que la fréquence des transactions, la difficulté d’optimisation des paramètres et le manque de contrôle des risques dans des situations extrêmes.
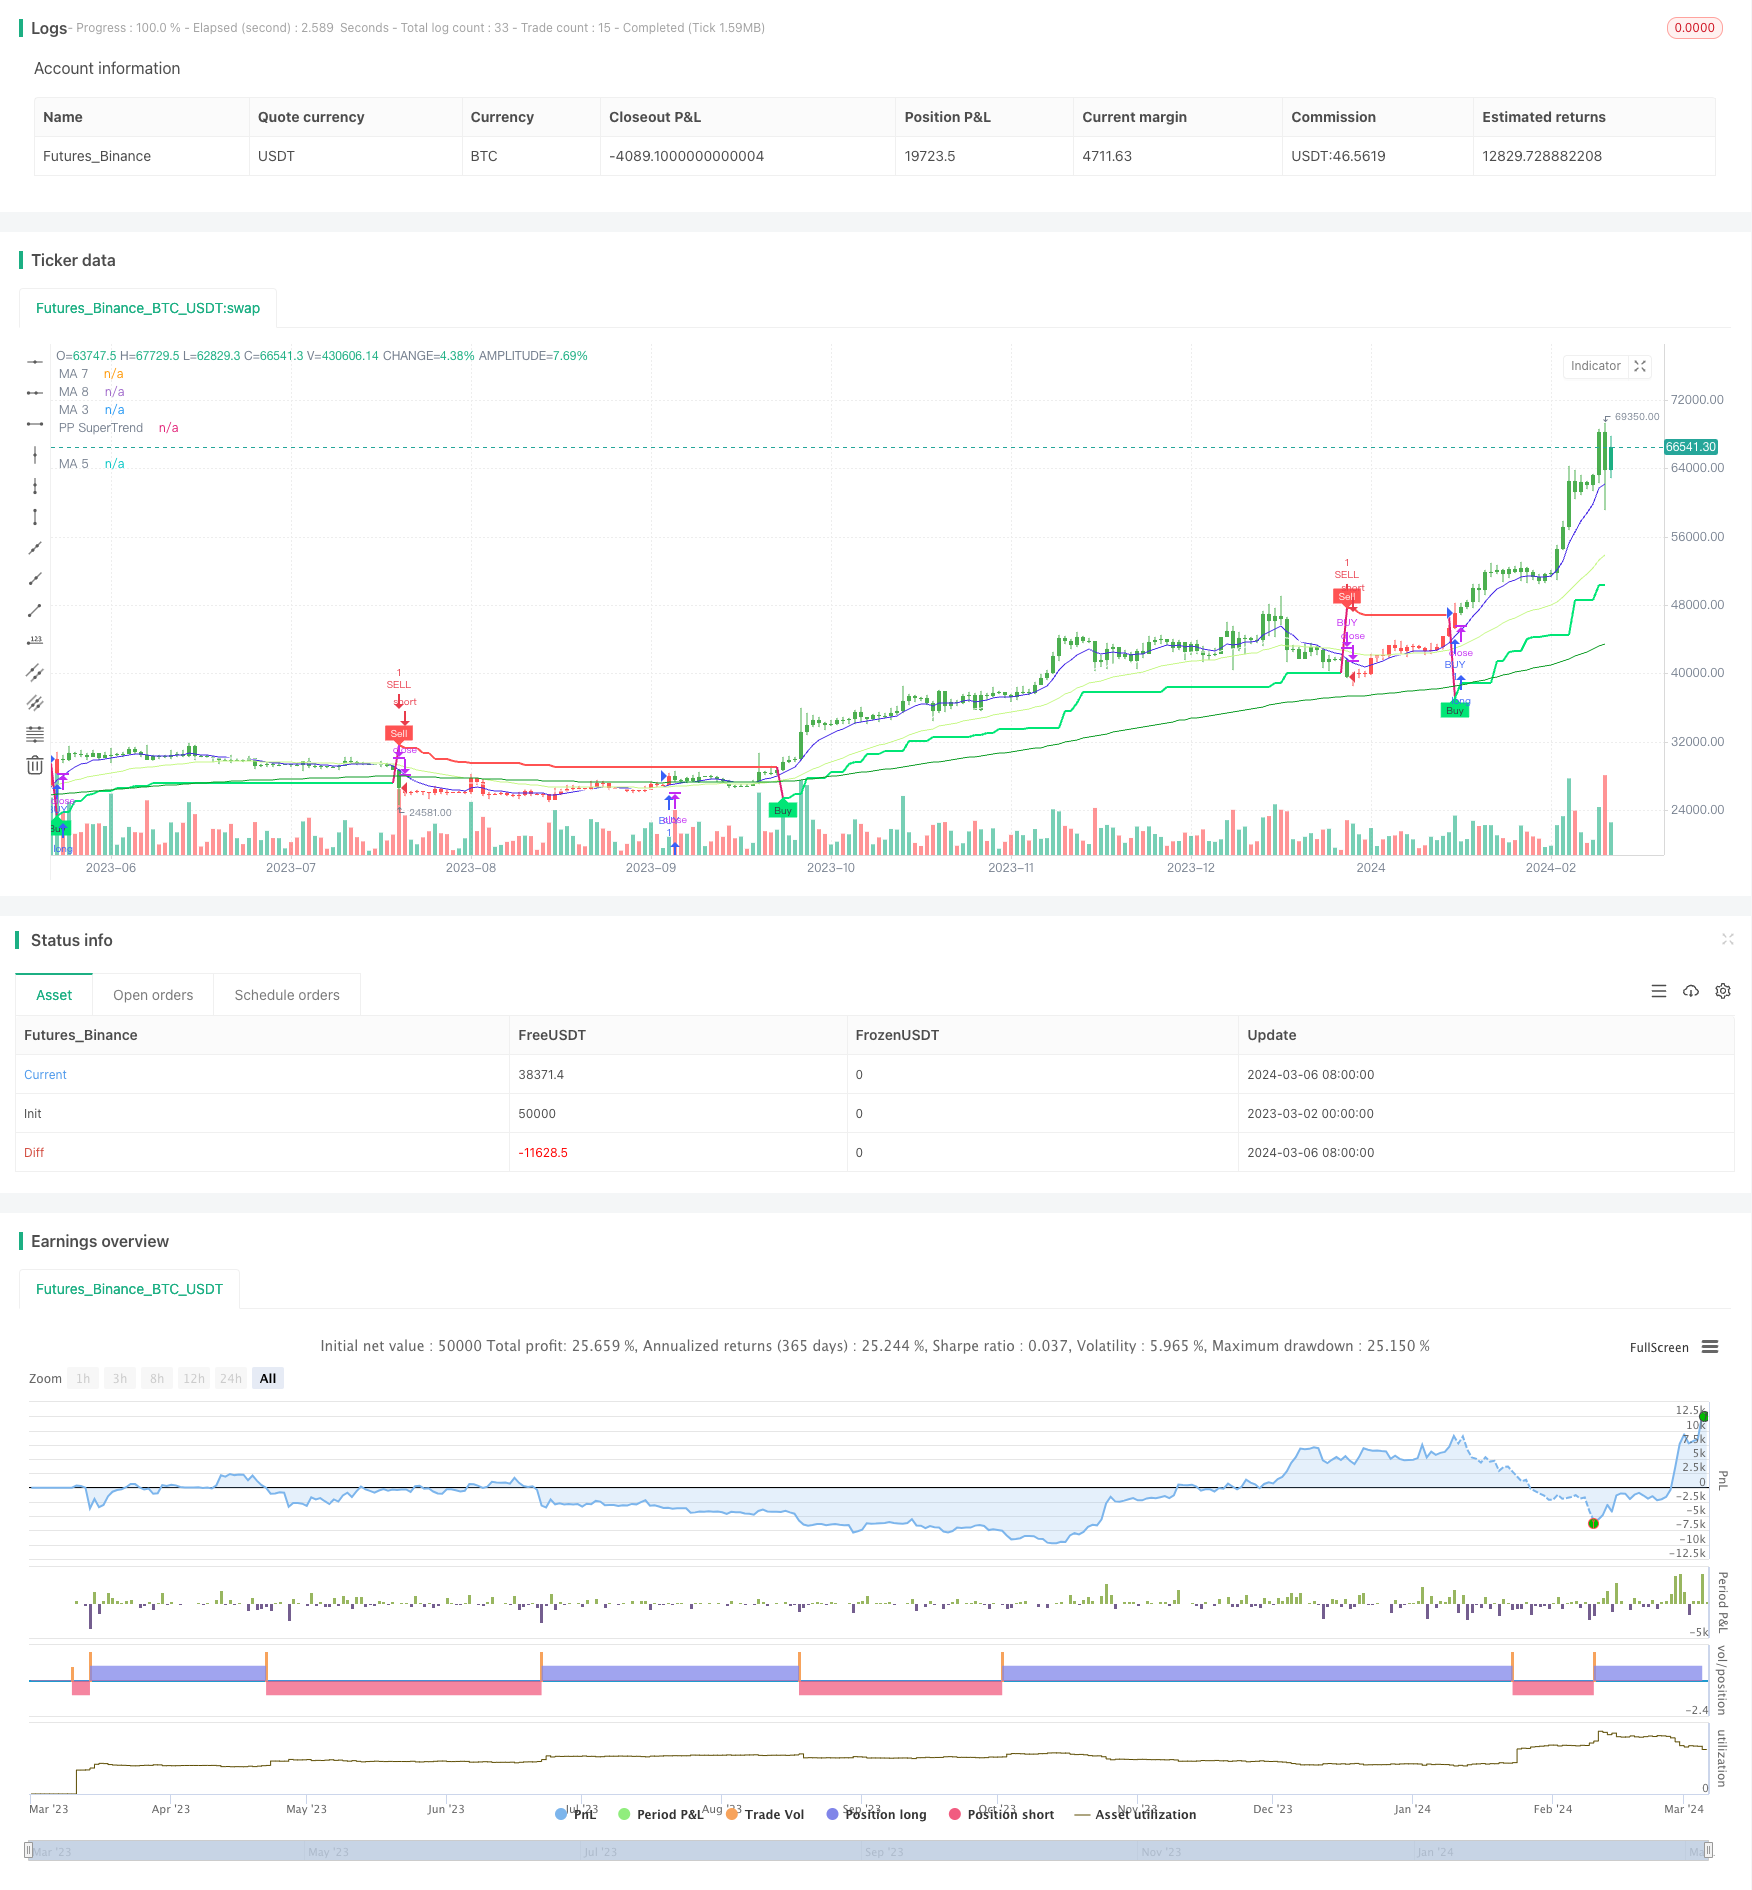
/*backtest
start: 2023-03-02 00:00:00
end: 2024-03-07 00:00:00
period: 1d
basePeriod: 1h
exchanges: [{"eid":"Futures_Binance","currency":"BTC_USDT"}]
*/

//@rpcoelho
// Based on © Julien_Eche "Pivot Point Supertrend" with optional EMAs ploted
//@version=4

strategy("PPS w/ EMAs", overlay=true)

prd = input(defval = 1, title="Pivot Point Period", minval = 1, maxval = 50)
Factor=input(defval = 4, title = "ATR Factor", minval = 1, step = 0.1)
Pd=input(defval = 72, title = "ATR Period", minval=1)
showpivot = input(defval = false, title="Show Pivot Points")
showlabel = input(defval = true, title="Show Buy/Sell Labels")
showcl = input(defval = false, title="Show PP Center Line")
showsr = input(defval = false, title="Show Support/Resistance")

/////////////////////////////////////////////////////////////////////////
// Switch Board
////////////////////////////////////////////////////////////////////////
// Define the switch board title as a label (since grouping is not available)
//switchboard_group = "████ Switch Board (Turn On/Off Overlay Indicators) ████"
//label.new(bar_index, high, switchboard_group, color=color.red)
// Create input controls for EMA and VWAP switches
switch_ema = input(true, title="EMA")

/////////////////////////////////////////////////////////////////////////
// EMA Selection
////////////////////////////////////////////////////////////////////////

ma_function(source, length, type) =>
    float ma = na
    if type == 'RMA'
        ma := rma(source, length)
    else if type == 'SMA'
        ma := sma(source, length)
    else if type == 'EMA'
        ma := ema(source, length)
    else if type == 'WMA'
        ma := wma(source, length)
    else if type == 'HMA'
        ma := length < 2 ? hma(source, 2) : hma(source, length)
    else
        ma := vwma(source, length)
    ma

// Moving Averages Line Title
//ma_group = "██████████ MAs Line ██████████"

// Inputs for MA 1
len1bool = input(false, title="Show MA 1")
len1 = input(13, title="Length MA 1")
ma_1_type = input("EMA", title="Type MA 1", options=["RMA", "SMA", "EMA", "WMA", "HMA", "VWMA"])
src_ma1 = input(title="MA1 Source", type=input.source, defval=close)
ma_1_colour = input(color.rgb(235, 159, 238), title="Color MA 1")

// Inputs for MA 2
len2bool = input(false, title="Show MA 2")
len2 = input(17, title="Length MA 2")
ma_2_type = input("EMA", title="Type MA 2", options=["RMA", "SMA", "EMA", "WMA", "HMA", "VWMA"])
src_ma2 = input(title="MA2 Source", type=input.source, defval=close)
ma_2_colour = input(color.rgb(230, 241, 65), title="Color MA 2")

// Inputs for MA 3
len3bool = input(true, title="Show MA 3")
len3 = input(34, title="Length MA 3")
ma_3_type = input("EMA", title="Type MA 3", options=["RMA", "SMA", "EMA", "WMA", "HMA", "VWMA"])
src_ma3 = input(title="MA3 Source", type=input.source, defval=close)
ma_3_colour = input(#c7f887, title="Color MA 3")

// Inputs for MA 4
len4bool = input(false, title="Show MA 4")
len4 = input(72, title="Length MA 4")
ma_4_type = input("EMA", title="Type MA 4", options=["RMA", "SMA", "EMA", "WMA", "HMA", "VWMA"])
src_ma4 = input(title="MA4 Source", type=input.source, defval=close)
ma_4_colour = input(#2f6999, title="Color MA 4")

// Inputs for MA 5
len5bool = input(true, title="Show MA 5")
len5 = input(144, title="Length MA 5")
ma_5_type = input("EMA", title="Type MA 5", options=["RMA", "SMA", "EMA", "WMA", "HMA", "VWMA"])
src_ma5 = input(title="MA5 Source", type=input.source, defval=close)
ma_5_colour = input(color.rgb(13, 156, 37), title="Color MA 5")

// Inputs for MA 6
len6bool = input(true, title="Show MA 6")
len6 = input(610, title="Length MA 6")
ma_6_type = input("EMA", title="Type MA 6", options=["RMA", "SMA", "EMA", "WMA", "HMA", "VWMA"])
src_ma6 = input(title="MA6 Source", type=input.source, defval=close)
ma_6_colour = input(color.rgb(173, 161, 152), title="Color MA 6")

// Inputs for MA 7
len7bool = input(true, title="Show MA 7")
len7 = input(8, title="Length MA 7")
ma_7_type = input("EMA", title="Type MA 7", options=["RMA", "SMA", "EMA", "WMA", "HMA", "VWMA"])
src_ma7 = input(title="MA7 Source", type=input.source, defval=close)
ma_7_colour = input(color.rgb(68, 39, 231), title="Color MA 7")

// Inputs for MA 8
len8bool = input(true, title="Show MA 8")
len8 = input(21, title="Length MA 8")
ma_8_type = input("EMA", title="Type MA 8", options=["RMA", "SMA", "EMA", "WMA", "HMA", "VWMA"])
src_ma8 = input(title="MA8 Source", type=input.source, defval=close)
ma_8_colour = input(color.white, title="Color MA 8")

ema1 = security(syminfo.tickerid, timeframe.period, ma_function(src_ma1, len1, ma_1_type))
ema2 = security(syminfo.tickerid, timeframe.period, ma_function(src_ma2, len2, ma_2_type))
ema3 = security(syminfo.tickerid, timeframe.period, ma_function(src_ma3, len3, ma_3_type))
ema4 = security(syminfo.tickerid, timeframe.period, ma_function(src_ma4, len4, ma_4_type))
ema5 = security(syminfo.tickerid, timeframe.period, ma_function(src_ma5, len5, ma_5_type))
ema6 = security(syminfo.tickerid, timeframe.period, ma_function(src_ma6, len6, ma_6_type))
ema7 = security(syminfo.tickerid, timeframe.period, ma_function(src_ma7, len7, ma_7_type))
ema8 = security(syminfo.tickerid, timeframe.period, ma_function(src_ma8, len8, ma_8_type))

plot(len1bool and switch_ema ? ema1:na, color=ma_1_colour, linewidth=1, title='MA 1')
plot(len2bool and switch_ema? ema2:na, color=ma_2_colour, linewidth=1, title='MA 2')
plot(len3bool and switch_ema? ema3:na, color=ma_3_colour, linewidth=1, title='MA 3')
plot(len4bool and switch_ema? ema4:na, color=ma_4_colour, linewidth=1, title='MA 4')
plot(len5bool and switch_ema? ema5:na, color=ma_5_colour, linewidth=1, title='MA 5')
plot(len6bool and switch_ema? ema6:na, color=ma_6_colour, linewidth=2, title='MA 6')
plot(len7bool and switch_ema? ema7:na, color=ma_7_colour, linewidth=1, title='MA 7')
plot(len8bool and switch_ema? ema8:na, color=ma_8_colour, linewidth=1, title='MA 8')


// get Pivot High/Low
float ph = pivothigh(prd, prd)
float pl = pivotlow(prd, prd)

// drawl Pivot Points if "showpivot" is enabled
plotshape(ph and showpivot, text="H",  style=shape.labeldown, color=na, textcolor=color.red, location=location.abovebar, transp=0, offset = -prd)
plotshape(pl and showpivot, text="L",  style=shape.labeldown, color=na, textcolor=color.lime, location=location.belowbar, transp=0, offset = -prd)

// calculate the Center line using pivot points
var float center = na
float lastpp = ph ? ph : pl ? pl : na
if lastpp
    if na(center)
        center := lastpp
    else
        //weighted calculation
        center := (center * 2 + lastpp) / 3

// upper/lower bands calculation
Up = center - (Factor * atr(Pd))
Dn = center + (Factor * atr(Pd))

// get the trend
float TUp = na
float TDown = na
Trend = 0
TUp := close[1] > TUp[1] ? max(Up, TUp[1]) : Up
TDown := close[1] < TDown[1] ? min(Dn, TDown[1]) : Dn
Trend := close > TDown[1] ? 1: close < TUp[1]? -1: nz(Trend[1], 1)
Trailingsl = Trend == 1 ? TUp : TDown

// plot the trend
linecolor = Trend == 1 and nz(Trend[1]) == 1 ? color.lime : Trend == -1 and nz(Trend[1]) == -1 ? color.red : na
plot(Trailingsl, color = linecolor ,  linewidth = 2, title = "PP SuperTrend")

plot(showcl ? center : na, color = showcl ? center < hl2 ? color.blue : color.red : na)

// check and plot the signals
bsignal = Trend == 1 and Trend[1] == -1
ssignal = Trend == -1 and Trend[1] == 1
plotshape(bsignal and showlabel ? Trailingsl : na, title="Buy", text="Buy", location = location.absolute, style = shape.labelup, size = size.tiny, color = color.lime, textcolor = color.black, transp = 0)
plotshape(ssignal and showlabel ? Trailingsl : na, title="Sell", text="Sell", location = location.absolute, style = shape.labeldown, size = size.tiny, color = color.red, textcolor = color.white, transp = 0)

//get S/R levels using Pivot Points
float resistance = na
float support = na
support := pl ? pl : support[1]
resistance := ph ? ph : resistance[1]

// if enabled then show S/R levels
plot(showsr and support ? support : na, color = showsr and support ? color.lime : na, style = plot.style_circles, offset = -prd)
plot(showsr and resistance ? resistance : na, color = showsr and resistance ? color.red : na, style = plot.style_circles, offset = -prd)

// Trend Filter from SuperTrend Long Strategy
Periods = input(title="ATR Period", type=input.integer, defval=3)
src = input(hlc3, title="Source")
Multiplier = input(title="ATR Multiplier", type=input.float, step=0.1, defval=4.0)
changeATR = input(title="Change ATR Calculation Method ?", type=input.bool, defval=true)

// Combine the SuperTrend calculations
atr2 = sma(tr, Periods)
atr = changeATR ? atr(Periods) : atr2

up = src - (Multiplier * atr)
up1 = nz(up[1], up)
up := close[1] > up1 ? max(up, up1) : up

dn = src + (Multiplier * atr)
dn1 = nz(dn[1], dn)
dn := close[1] < dn1 ? min(dn, dn1) : dn

trend = 1
trend := nz(trend[1], trend)
trend := trend == -1 and close > dn1 ? 1 : trend == 1 and close < up1 ? -1 : trend

// Moving Average as Trend Filter
periodes_ma = input(title="Moving Average Period", type=input.integer, defval=20)
src_ma = input(title="Moving Average Source", type=input.source, defval=close)
ma = sma(src_ma, periodes_ma)

// Strategy Entry Conditions
FromMonth = input(defval = 1, title = "From Month", minval = 1, maxval = 12)
FromDay   = input(defval = 1, title = "From Day", minval = 1, maxval = 31)
FromYear  = input(defval = 2017, title = "From Year", minval = 999)
ToMonth   = input(defval = 1, title = "To Month", minval = 1, maxval = 12)
ToDay     = input(defval = 1, title = "To Day", minval = 1, maxval = 31)
ToYear    = input(defval = 9999, title = "To Year", minval = 999)

start     = timestamp(FromYear, FromMonth, FromDay, 00, 00)
finish    = timestamp(ToYear, ToMonth, ToDay, 23, 59)

window()  => true

// Combined entry conditions
longCondition = (trend == 1 and trend[1] == -1 and close > ma) or (bsignal and window())
shortCondition = (trend == -1 and trend[1] == 1 and close < ma) or (ssignal and window())

if (longCondition)
    strategy.entry("BUY", strategy.long)

if (shortCondition)
    strategy.close("BUY")
    strategy.entry("SELL", strategy.short)

buy1 = barssince((trend == 1 and trend[1] == -1 and close > ma) or (bsignal and window()))
sell1 = barssince((trend == -1 and trend[1] == 1 and close < ma) or (ssignal and window()))
color1 = buy1[1] < sell1[1] ? color.green : buy1[1] > sell1[1] ? color.red : na
barcolor(color1)