TrendHunter w/MF Stratégie de tendance multi-timeframes

Aperçu
La stratégie de tendance multi-timeframes TrendHunter w/MF est une stratégie de suivi de tendance basée sur plusieurs indicateurs techniques et une analyse multi-timeframes. Cette stratégie prend en compte de manière globale des facteurs tels que le nuage Ichimoku, les moyennes mobiles, la SuperTrend, la tendance ondulatoire (WaveTrend) et les flux monétaires (MoneyFlow), et détermine les points d'entrée à l'aide de conditions strictes afin de capturer la tendance principale du marché.
Principe de la stratégie
Le principe central de cette stratégie repose sur une analyse complète de plusieurs indicateurs techniques sur plusieurs timeframes. Plus précisément :
-
Nuage Ichimoku : En analysant la position relative du prix par rapport au nuage, ainsi que celle de la moyenne mobile par rapport au nuage, on détermine la tendance actuelle du marché. Lorsque le prix se situe au-dessus du nuage et que la moyenne mobile se trouve également au-dessus du nuage, on considère qu'il s'agit d'une tendance haussière ; dans le cas contraire, d'une tendance baissière.
-
SuperTrend : En analysant la position relative du prix par rapport à la SuperTrend, on confirme la tendance actuelle du marché. Lorsque le prix est au-dessus de la SuperTrend, on considère qu'il s'agit d'une tendance haussière ; dans le cas contraire, d'une tendance baissière.
-
WaveTrend : En analysant la direction et la position de l'indicateur WaveTrend, on détermine la tendance actuelle du marché. Lorsque le WaveTrend est orienté à la hausse et n'a pas atteint la zone de surachat, on considère qu'il s'agit d'une tendance haussière ; lorsqu'il est orienté à la baisse et n'a pas atteint la zone de survente, on considère qu'il s'agit d'une tendance baissière.
-
MoneyFlow : En analysant l'état de l'indicateur MoneyFlow, on confirme la tendance actuelle du marché. Lorsque le MoneyFlow est positif, on considère qu'il s'agit d'une tendance haussière ; dans le cas contraire, d'une tendance baissière.
Pour une position longue, la stratégie exige que le prix soit au-dessus du nuage, que la moyenne mobile soit au-dessus du nuage, que la SuperTrend soit haussière, que le WaveTrend soit haussier sans avoir atteint la zone de surachat, et que le MoneyFlow soit positif. Les conditions pour une position courte sont inverses. Ce filtrage strict basé sur plusieurs indicateurs et plusieurs timeframes permet d'éviter efficacement les transactions fréquentes en période de range, améliorant ainsi la stabilité et la fiabilité de la stratégie.
Analyse des avantages
-
Jugement multi-indicateurs, fiabilité élevée : Cette stratégie prend en compte plusieurs indicateurs techniques qui se complètent dans différentes conditions de marché, reflétant ainsi pleinement la tendance du marché et évitant les erreurs potentielles d'un seul indicateur.
-
Conditions d'entrée strictes, évite les transactions fréquentes : La stratégie fixe des conditions d'entrée rigoureuses, nécessitant la satisfaction simultanée de plusieurs indicateurs pour entrer en position, ce qui évite efficacement les transactions fréquentes en période de range et réduit les pertes de la stratégie.
-
Analyse multi-timeframes, capture des tendances majeures : La stratégie analyse sur plusieurs timeframes, ce qui aide à saisir la tendance principale du marché depuis une perspective plus large, évitant les interférences du bruit à court terme.
-
Stop-loss clair, risque maîtrisable : La stratégie utilise la SuperTrend comme condition de stop-loss. Dès que la tendance du marché change, la stratégie peut interrompre la position à temps, limitant les pertes dans une fourchette acceptable.
Analyse des risques
-
Absence d'ajustement dynamique, capacité limitée à s'adapter aux changements du marché : Les paramètres de la stratégie sont fixes, sans capacité d'ajustement dynamique en fonction de l'état du marché. En cas de changement majeur des conditions de marché, la stratégie peut devenir inefficace.
-
Conditions d'entrée trop strictes, risque de manquer des opportunités : Les conditions d'entrée sont très strictes. Bien que cela évite les transactions fréquentes, cela peut également entraîner le manque de certaines bonnes opportunités d'entrée.
-
Adaptabilité aux conditions extrêmes inconnue : La stratégie fonctionne bien dans des conditions de marché normales, mais son adaptabilité à des situations extrêmes, comme des retournements rapides et violents, reste à vérifier.
-
Stratégie de stop-loss relativement simple, possibilité d'optimisation : Actuellement, la stratégie utilise uniquement la SuperTrend comme condition de stop-loss. Bien que simple, cette approche peut être optimisée pour mieux contrôler le risque.
Pistes d'optimisation
-
Introduire un jugement de l'état du marché et ajuster dynamiquement les paramètres : On peut envisager d'introduire des indicateurs de jugement de l'état du marché, comme des indicateurs de volatilité, pour ajuster dynamiquement les paramètres de la stratégie en fonction des changements de l'environnement de marché.
-
Optimiser les conditions d'entrée pour améliorer la sensibilité : On peut envisager d'optimiser les conditions d'entrée, par exemple en introduisant des indicateurs de confirmation supplémentaires, afin d'améliorer la sensibilité de la stratégie tout en maintenant sa fiabilité, et de capturer davantage d'opportunités de trading.
-
Ajouter des mesures pour faire face aux conditions extrêmes : Pour des situations extrêmes comme des retournements rapides et violents, on peut envisager d'introduire des mesures spéciales, telles qu'un renforcement du stop-loss ou une suspension temporaire des transactions, afin de réduire le risque dans ces conditions.
-
Optimiser la stratégie de stop-loss pour améliorer la gestion du risque : On peut envisager d'introduire davantage de conditions de stop-loss, comme un stop-loss temporel ou un stop-loss basé sur une bande, ou encore des stratégies de stop-loss dynamiques comme le trailing stop, pour mieux contrôler le risque.
Résumé
La stratégie de tendance multi-timeframes TrendHunter w/MF est une stratégie de suivi de tendance basée sur l'analyse de plusieurs indicateurs et plusieurs timeframes. En prenant en compte de manière globale des facteurs tels que le nuage Ichimoku, les moyennes mobiles, la SuperTrend, le WaveTrend et le MoneyFlow, en fixant des conditions d'entrée strictes et en analysant plusieurs timeframes, cette stratégie peut capturer de manière relativement fiable la tendance principale du marché, éviter les transactions fréquentes en période de range, et offre une bonne stabilité et fiabilité.
Parallèlement, cette stratégie présente certaines limites et risques, tels que l'absence de capacité d'ajustement dynamique, des conditions d'entrée potentiellement trop strictes, une adaptabilité inconnue aux conditions extrêmes, et une stratégie de stop-loss relativement simple. Ce sont autant de directions d'optimisation et d'amélioration futures pour cette stratégie.
Dans l'ensemble, la stratégie de tendance multi-timeframes TrendHunter w/MF est une stratégie de suivi de tendance prometteuse. Lors de l'utilisation de cette stratégie, le trader doit bien comprendre son principe, ses avantages et ses risques, et effectuer les ajustements et optimisations nécessaires en fonction de sa propre tolérance au risque et de son style de trading. Il doit également surveiller de près les changements de l'état du marché et ajuster la stratégie en temps utile pour s'adapter aux évolutions du marché. Ce n'est qu'en la comprenant en profondeur et en l'utilisant avec prudence que cette stratégie pourra déployer son potentiel et apporter des gains stables au trader.
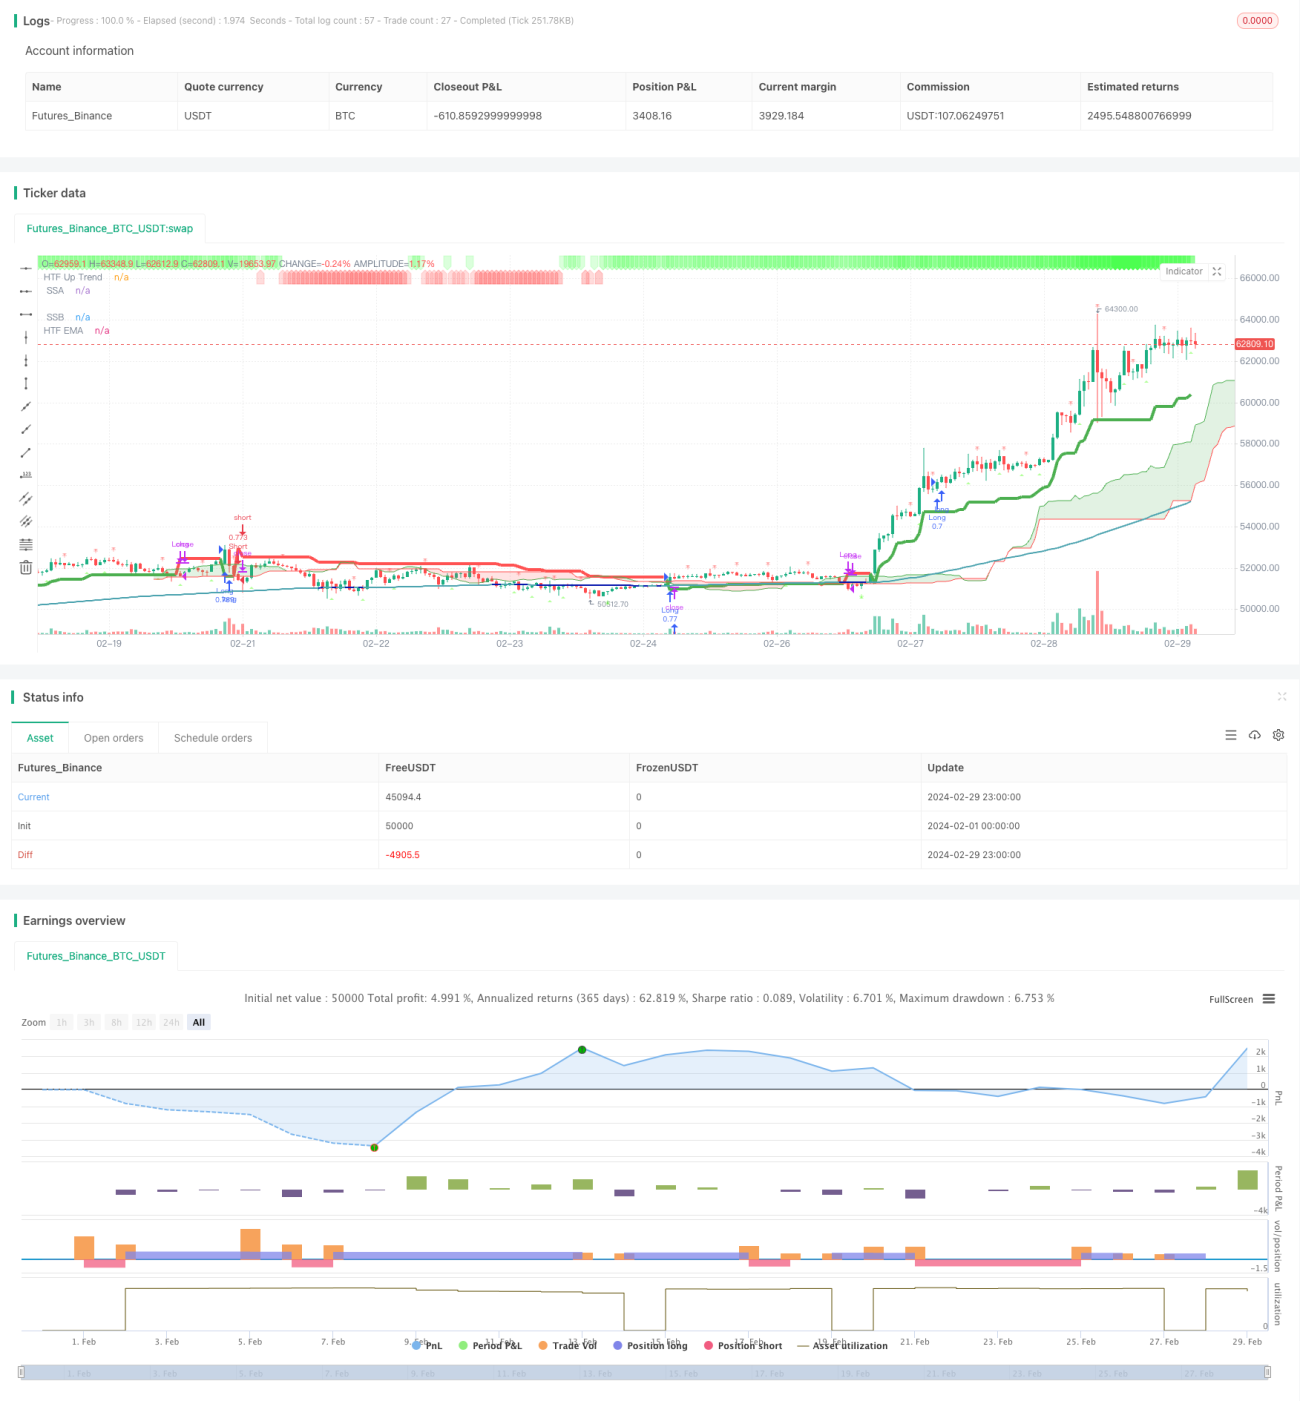
/*backtest
start: 2024-02-01 00:00:00
end: 2024-02-29 23:59:59
period: 1h
basePeriod: 15m
exchanges: [{"eid":"Futures_Binance","currency":"BTC_USDT"}]
*/

// This Pine Script™ code is subject to the terms of the Mozilla Public License 2.0 at https://mozilla.org/MPL/2.0/
// © godzcopilot / blockybears

// Thanks to anthonyf50 for his MTF Ichimoku https://www.tradingview.com/script/Pw9cBFma/- 1