Stratégie de suivi de tendance de l'indice de force relative modifié
Aperçu
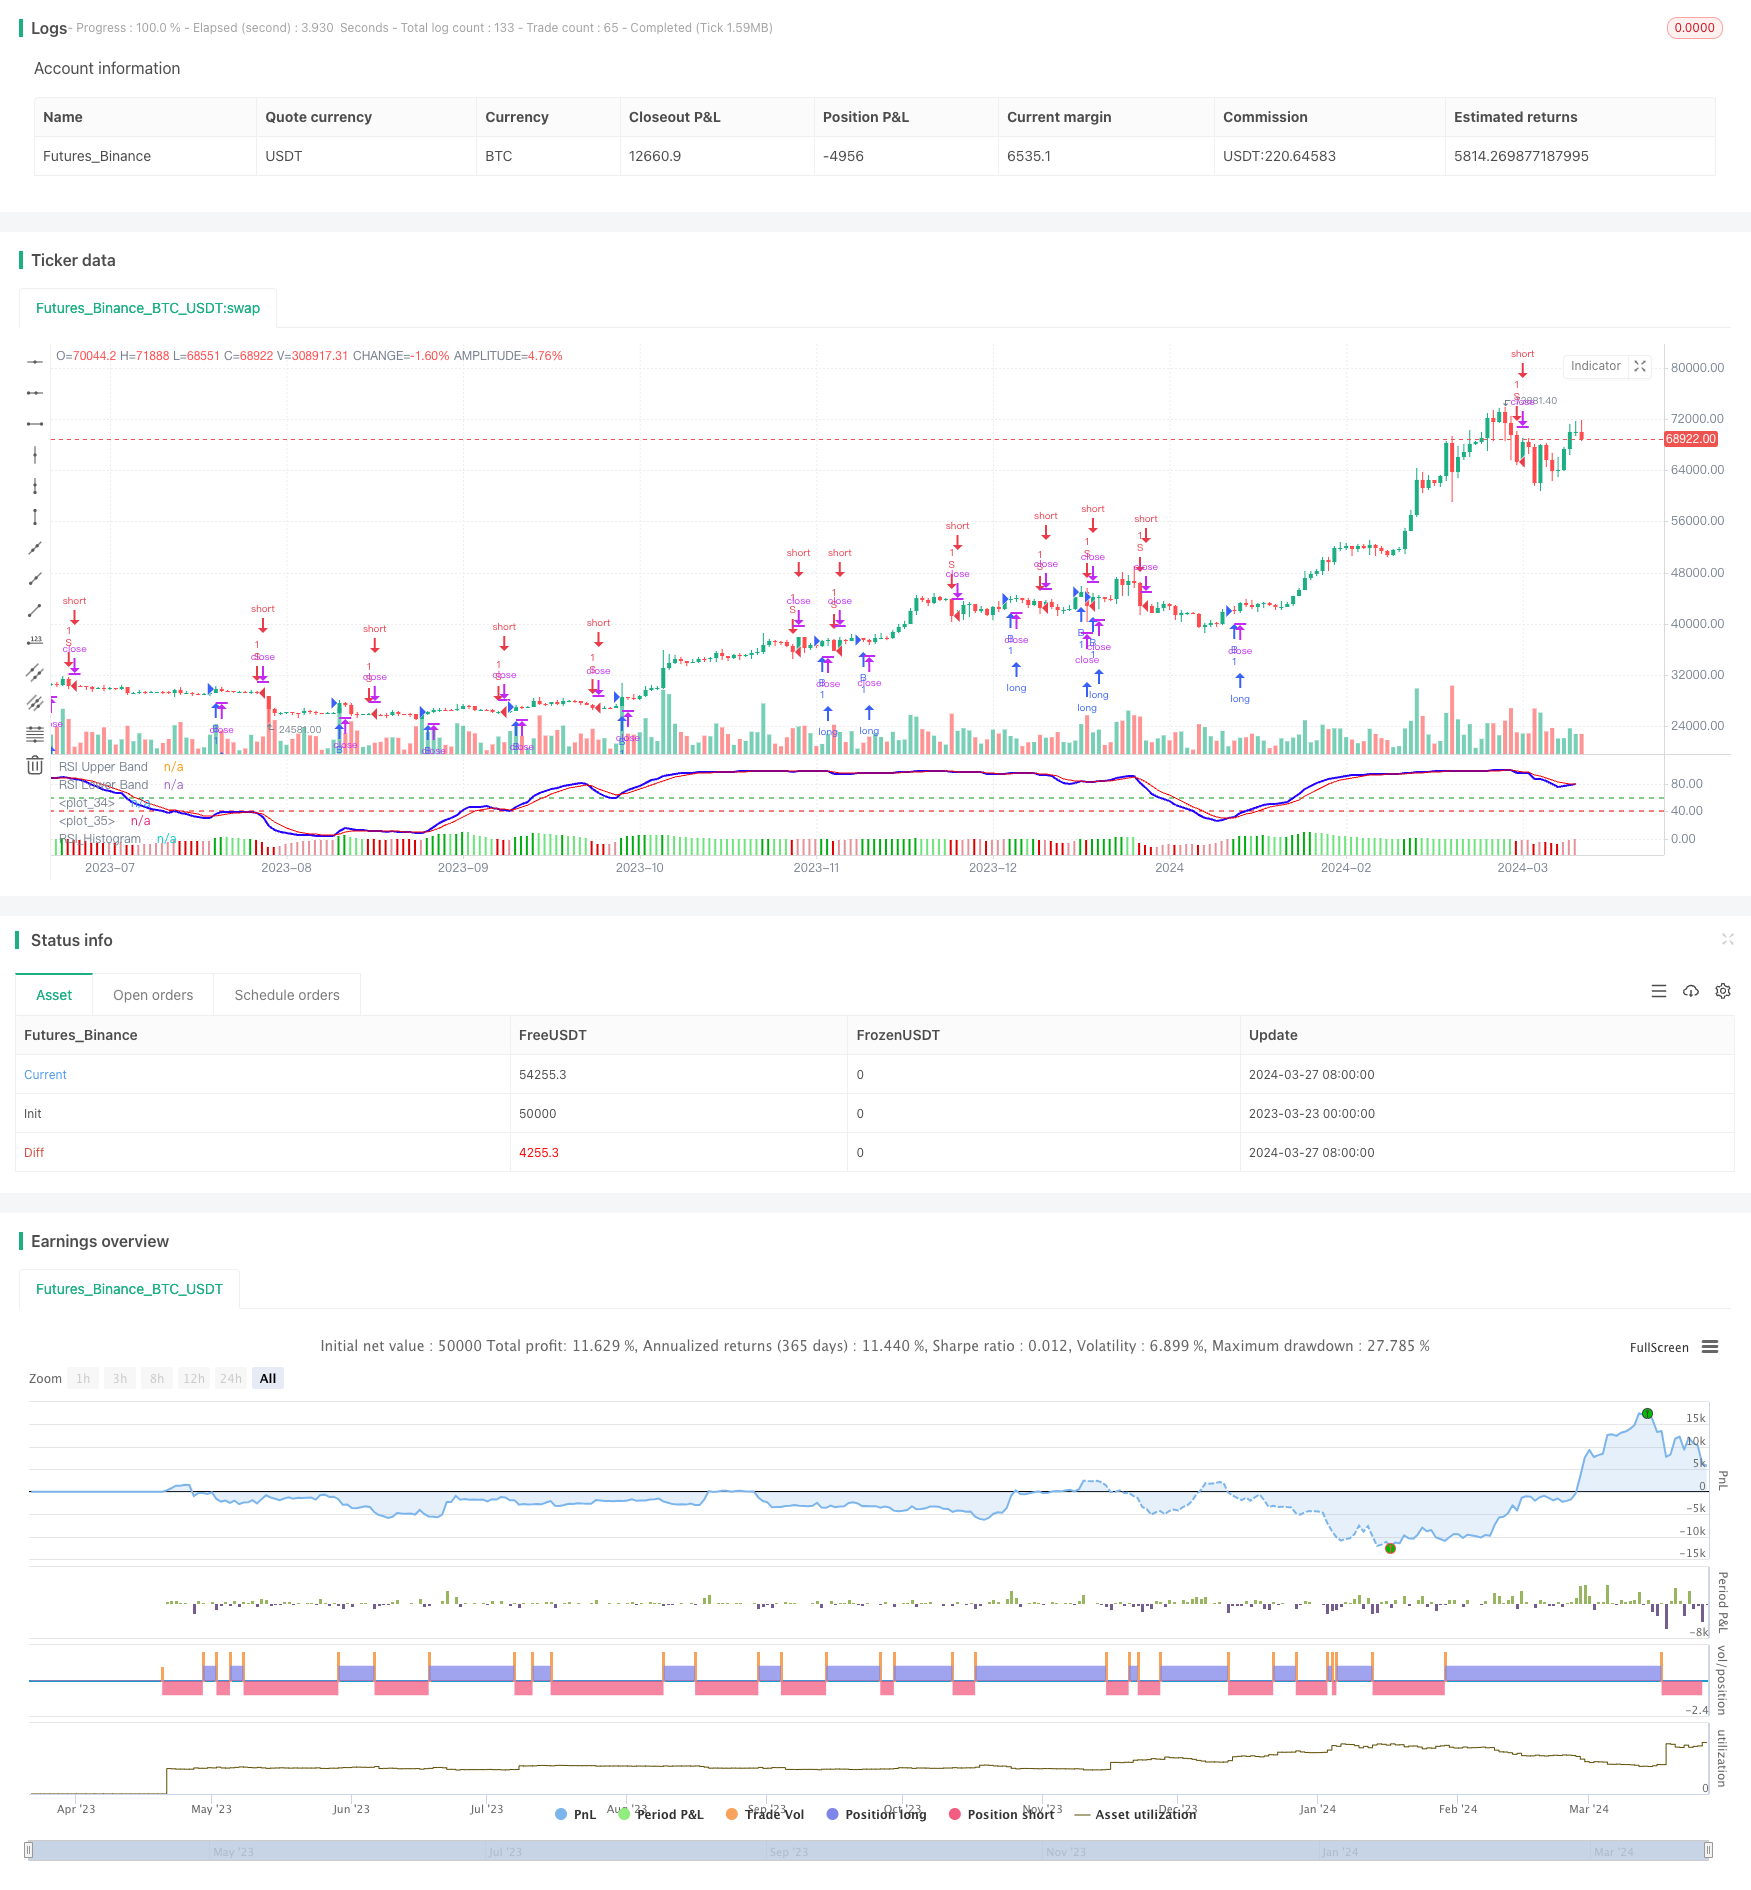
La stratégie est basée sur l’indice de force relative modifiée (RSI modifié) pour capturer les tendances du marché. L’idée principale de la stratégie est d’utiliser les signaux croisés et les signaux de diagramme vertical de l’indicateur RSI modifié pour juger de la tendance du marché et de négocier en fonction de la direction de la tendance.
Principe de stratégie
- Calculer l’EMA du prix en tant qu’entrée du RSI modifié
- Calcul de l’indicateur RSI modifié
- Calculer l’EMA du RSI modifié comme ligne de signal
- Calculer la différence entre le RSI modifié et la ligne de signal sous forme d’un diagramme rectangle
- Un signal d’achat est généré lorsque la ligne de signal est traversée sur le RSI modifié et que la diagonale est supérieure à 0
- Un signal de vente est généré lorsque le RSI modifié traverse la ligne de signal et que la diagonale est inférieure à 0
Avantages stratégiques
- L’indicateur RSI modifié capte mieux les tendances que les indicateurs RSI traditionnels
- Combinant le signal de croix et le signal de diagramme rectangulaire du RSI modifié, il permet de filtrer efficacement les faux signaux
- Paramètres réglables pour différents marchés et périodes
- La simplicité et l’efficacité du calcul
Risque stratégique
- L’indicateur RSI modifié est susceptible de générer des signaux erronés en cas de choc
- La capture d’un point de basculement de tendance pourrait être en retard
- L’indicateur unique est vulnérable au bruit des prix
Orientation de l’optimisation de la stratégie
- Il peut être combiné avec d’autres indicateurs de tendance, tels que les moyennes mobiles, pour améliorer la fiabilité du signal
- Un module de stop-loss peut être ajouté pour contrôler le risque d’une seule transaction
- Les paramètres peuvent être optimisés en fonction des caractéristiques du marché
- Vous pouvez ajouter un module de gestion de position pour ajuster dynamiquement la position.
Résumer
La stratégie utilise les caractéristiques de l’indicateur RSI modifié pour construire un système de négociation dans une perspective de suivi de la tendance. L’indicateur RSI modifié surmonte certaines des lacunes de l’indicateur RSI traditionnel et a une capacité de capture de tendance relativement forte. Cependant, la stratégie d’un seul indicateur a souvent des limites et doit être améliorée en combinaison avec d’autres moyens techniques.
/*backtest
start: 2023-03-23 00:00:00
end: 2024-03-28 00:00:00
period: 1d
basePeriod: 1h
exchanges: [{"eid":"Futures_Binance","currency":"BTC_USDT"}]
*/

// This source code is subject to the terms of the Mozilla Public License 2.0 at https://mozilla.org/MPL/2.0/
// © YogirajDange

//@version=5


// Verical lines


// // Define the times
// t1 = timestamp(year, month, dayofmonth, 09, 15) // 9:15
// t2 = timestamp(year, month, dayofmonth, 11, 15) // 11:15
// t3 = timestamp(year, month, dayofmonth, 13, 15) // 1:15
// t4 = timestamp(year, month, dayofmonth, 15, 25) // 3:25

// // Check if the current bar is on the current day
// is_today = (year(time) == year(timenow)) and (month(time) == month(timenow)) and (dayofmonth(time) == dayofmonth(timenow))

// // Draw a vertical line at each time
// if is_today and (time == t1 or time == t2 or time == t3 or time == t4)
//     line.new(x1 = bar_index, y1 = low, x2 = bar_index, y2 = high, extend = extend.both, color=color.red, width = 1)

strategy('Modified RSI')
col_grow_above = input(#02ac11, "Above   Grow", group="Histogram", inline="Above")
col_fall_above = input(#6ee47d, "Fall", group="Histogram", inline="Above")
col_grow_below = input(#e5939b, "Below Grow", group="Histogram", inline="Below")
col_fall_below = input(#dd0000, "Fall", group="Histogram", inline="Below")
EMA_length = input.int(13, 'Price_EMA', minval=1)
RSI_length = input.int(14, 'RSI_Period', minval=1)
Avg_length = input.int(5, 'RSI_Avg_EMA', minval=1)
fastMA = ta.ema(close, EMA_length)
modrsi = ta.rsi(fastMA, RSI_length)
RSIAVG = ta.ema(modrsi, Avg_length)
plot(modrsi, color=color.rgb(38, 0, 255), linewidth=2)
plot(RSIAVG, color=color.rgb(247, 0, 0))
rsiUpperBand = hline(60, 'RSI Upper Band', color=#099b0e)
//hline(50, "RSI Middle Band", color=color.new(#787B86, 50))
rsiLowerBand = hline(40, 'RSI Lower Band', color=#e90101)

RSI_hist = modrsi - RSIAVG

//plot(RSI_hist,"RSI_Histogram", color = #c201e9, style = plot.style_columns,linewidth= 5)

plot(RSI_hist, title="RSI_Histogram", style=plot.style_columns, color=(RSI_hist>=0 ? (RSI_hist[1] < RSI_hist ? col_grow_above : col_fall_above) : (RSI_hist[1] < RSI_hist ? col_grow_below : col_fall_below)))


/////// Moving Averages 20 50 EMA

fast_ma = input.int(20, minval=2, title="Fast_EMA")
slow_ma = input.int(50, minval=2, title="Slow_EMA")

src = input.source(close, title="Source")

out = ta.ema(src, fast_ma)
out1 = ta.ema(src, slow_ma)

//plot(out, title="20 EMA", color=color.rgb(117, 71, 247), linewidth = 2)
//plot(out1, title="50 EMA", color=color.rgb(0, 0, 0), linewidth = 2)


longCondition = ((ta.crossover(modrsi, RSIAVG)) and (RSI_hist > 0))
if longCondition
    strategy.entry('B', strategy.long)

shortCondition = ((ta.crossunder(modrsi, RSIAVG)) and (RSI_hist < 0))
if shortCondition
    strategy.entry('S', strategy.short)