Stratégie de suivi de tendance du canal gaussien
Aperçu
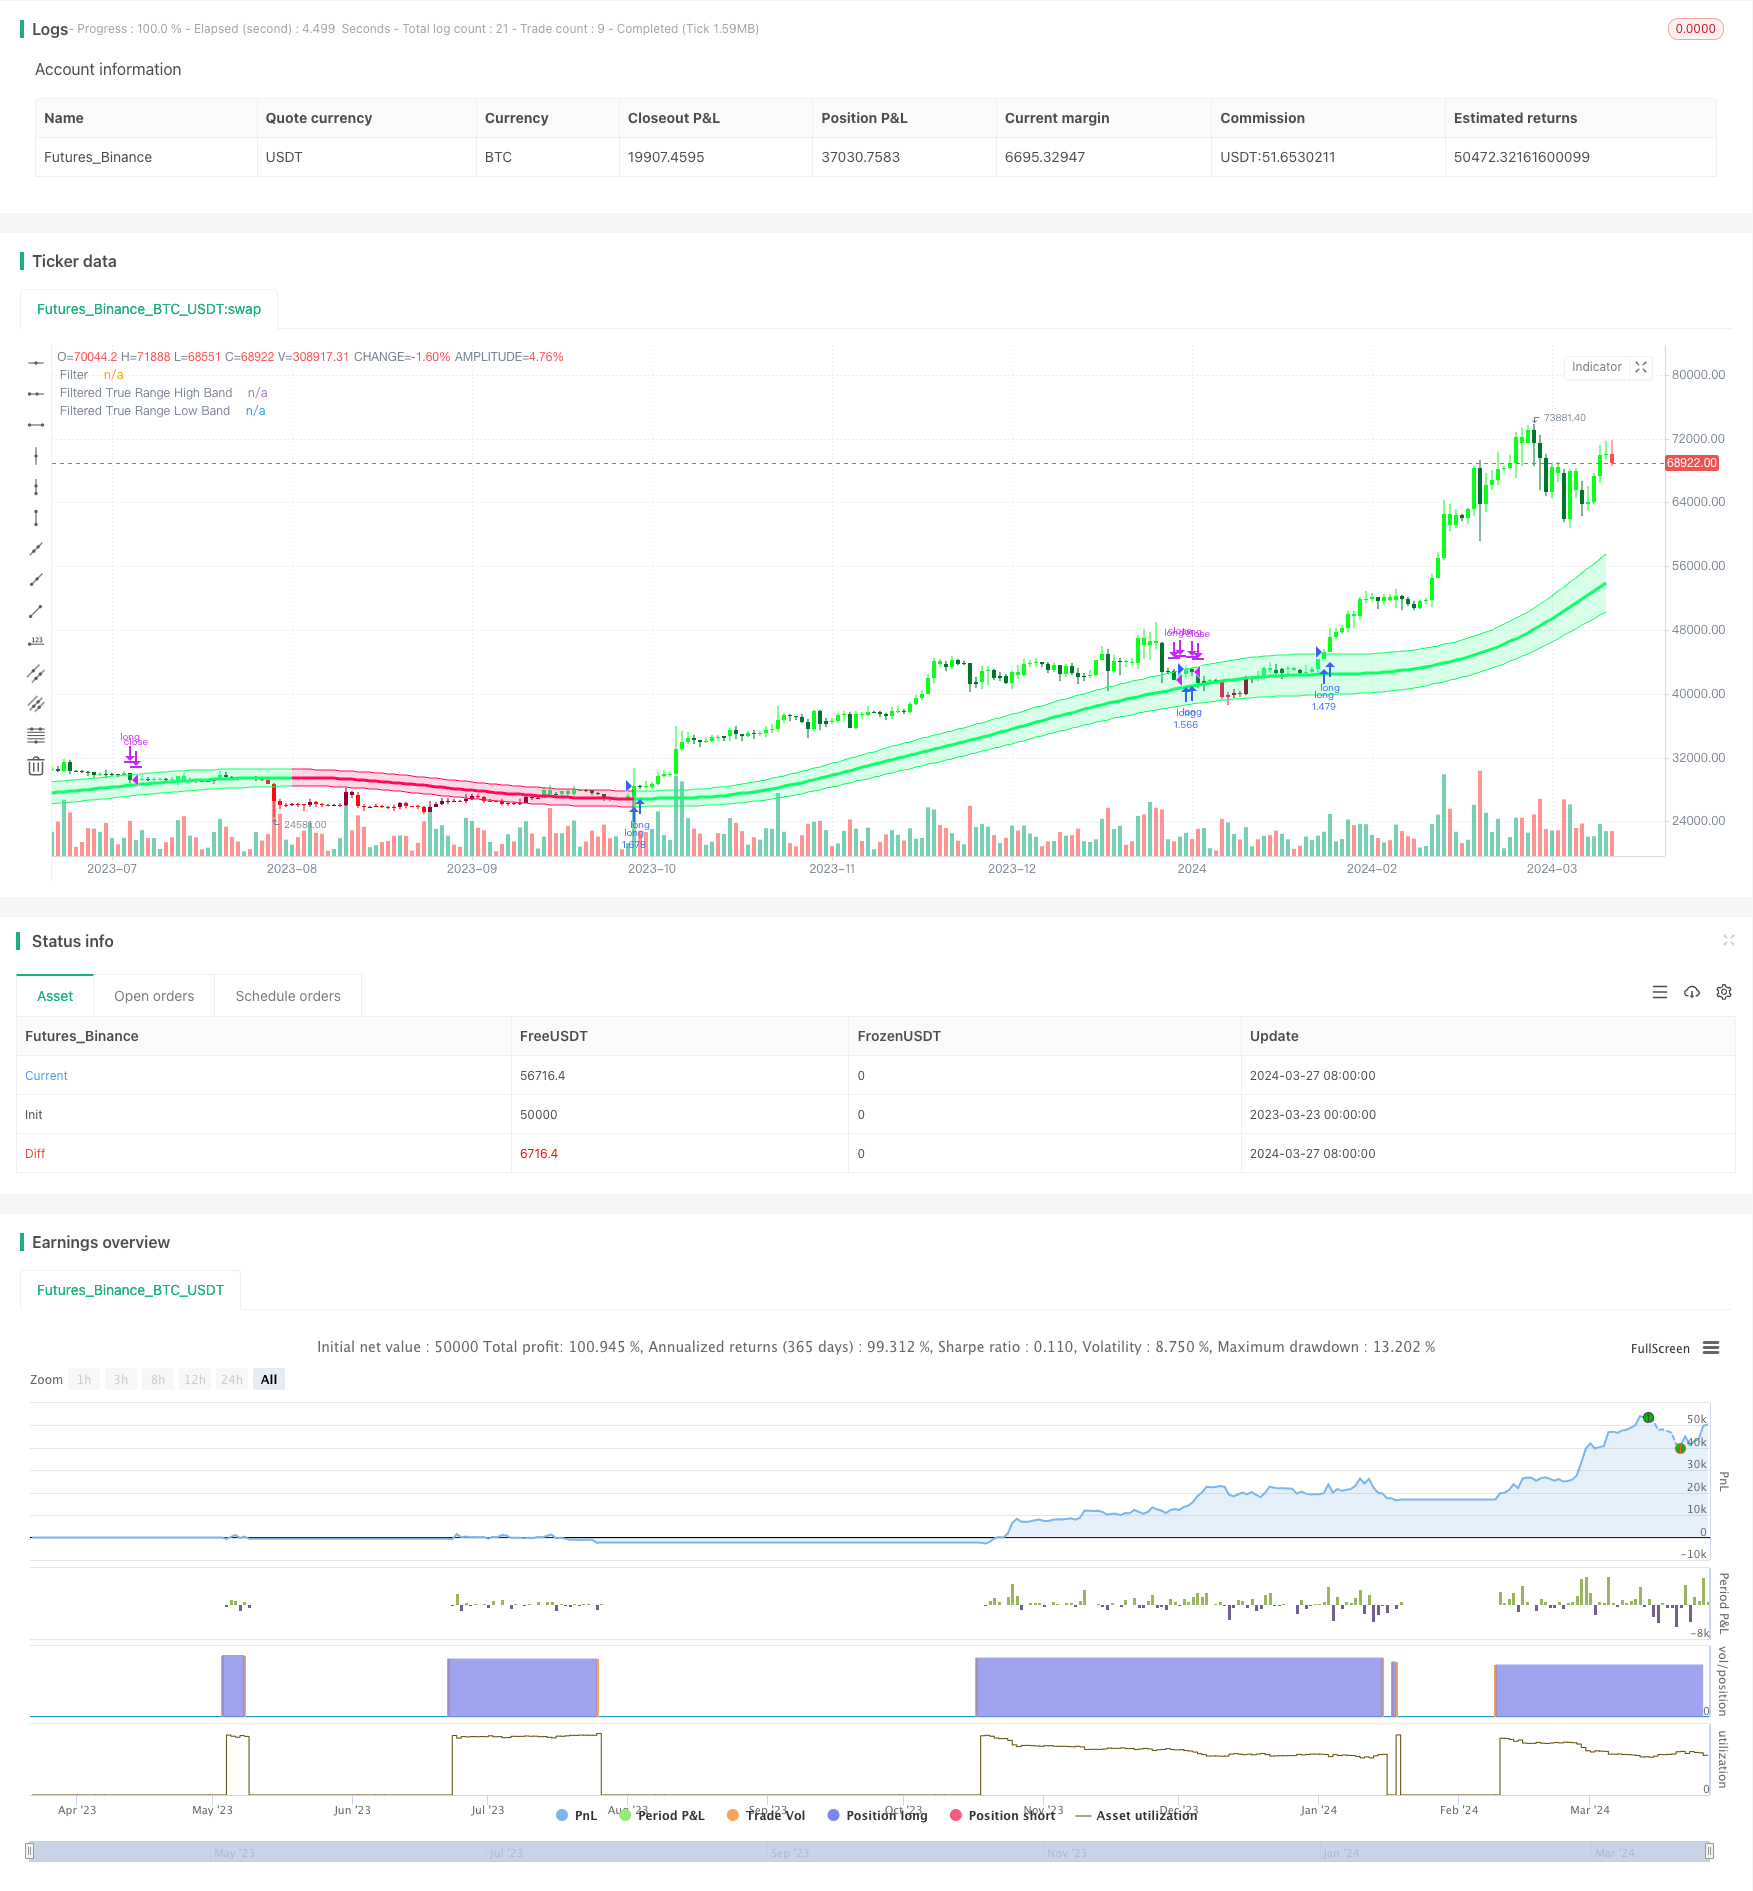
La stratégie de suivi de la tendance de la chaîne gaussienne est une stratégie de trading de suivi de la tendance basée sur l’indicateur de la chaîne gaussienne. Cette stratégie vise à capturer la tendance principale du marché, en achetant et en tenant des positions dans la tendance à la hausse et en observant des positions de plafonnement dans la tendance à la baisse. La stratégie utilise l’indicateur de la chaîne gaussienne pour identifier la direction et la force de la tendance, et pour déterminer le moment d’achat et de vente en analysant la relation entre les prix et la descente du canal.
Principe de stratégie
Au cœur de la stratégie de suivi des tendances Gaussian Channel se trouve l’indicateur Gaussian Channel, proposé par Ehlers, un outil d’analyse de tendances qui utilise la technique de Gaussian Ripple et la combinaison de la True Range. L’indicateur calcule d’abord les valeurs β et α en fonction du cycle d’échantillonnage et du nombre de pôles, puis filtre les données pour obtenir une courbe de lissage.
Avantages stratégiques
- Suivi des tendances: cette stratégie est efficace pour capturer les principales tendances du marché et investir dans la direction des tendances, ce qui permet d’obtenir des rendements stables à long terme.
- Réduction de la fréquence des transactions: la stratégie consiste à entrer en bourse uniquement lorsque la tendance est confirmée et à maintenir une position pendant la durée de la tendance, ce qui réduit le nombre de transactions inutiles et les coûts de transaction.
- Réduire les délais: en réduisant les délais et en réagissant rapidement, les stratégies peuvent réagir plus rapidement aux changements du marché.
- Flexibilité des paramètres: l’utilisateur peut ajuster les paramètres de la stratégie en fonction de ses besoins, tels que le cycle d’échantillonnage, le nombre de pôles, le nombre de multiples de la portée réelle, etc., pour optimiser la performance de la stratégie.
Risque stratégique
- Risque d’optimisation des paramètres: un paramétrage inapproprié peut entraîner une mauvaise performance de la stratégie. Il est recommandé d’optimiser et de tester les paramètres dans différents environnements de marché pour trouver la meilleure combinaison de paramètres.
- Risque de renversement de tendance: lorsque la tendance du marché est soudainement inversée, la stratégie peut entraîner un retrait plus important. Le risque peut être contrôlé en définissant un stop loss ou en introduisant d’autres indicateurs.
- Risque de marché en crise: dans les marchés en crise, la stratégie peut avoir des signaux de négociation fréquents, ce qui entraîne une perte de bénéfices. Les signaux peuvent être filtrés par des paramètres d’optimisation ou en combinaison avec d’autres indicateurs techniques.
Orientation de l’optimisation de la stratégie
- Introduction d’autres indicateurs techniques: en combinaison avec d’autres indicateurs de tendance ou de choc, tels que le MACD, le RSI, etc., pour améliorer l’exactitude et la fiabilité du signal.
- Optimisation des paramètres dynamiques: Adaptation dynamique des paramètres stratégiques en fonction des changements de l’état du marché pour s’adapter à différents environnements de marché.
- Ajout d’un module de contrôle des risques: définir des règles de stop-loss et de stop-loss raisonnables, contrôler le risque de chaque transaction et le niveau de retrait global.
- L’analyse de plusieurs fuseaux horaires: combiner des signaux de différentes périodes, comme le jour, les 4 heures, etc., pour obtenir des informations plus complètes sur le marché.
Résumer
La stratégie utilise les indicateurs Gaussian Channel pour identifier la direction et la force des tendances, tout en offrant des fonctionnalités de réduction des délais et de réaction rapide. L’avantage de la stratégie réside dans sa bonne capacité de suivi des tendances et sa faible fréquence de négociation, mais elle est également exposée à des risques tels que l’optimisation des paramètres, les virages de tendance et les marchés instables.
/*backtest
start: 2023-03-23 00:00:00
end: 2024-03-28 00:00:00
period: 1d
basePeriod: 1h
exchanges: [{"eid":"Futures_Binance","currency":"BTC_USDT"}]
*/

//@version=5
strategy(title="Gaussian Channel Strategy v2.0", overlay=true, calc_on_every_tick=false, initial_capital=1000, default_qty_type=strategy.percent_of_equity, default_qty_value=100, commission_type=strategy.commission.percent, commission_value=0.1, slippage=3)

//-----------------------------------------------------------------------------------------------------------------------------------------------------------------
// Gaussian Channel Indicaor - courtesy of @DonovanWall
//-----------------------------------------------------------------------------------------------------------------------------------------------------------------

// Date condition inputs
startDate = input(timestamp("1 January 2018 00:00 +0000"), "Date Start", group="Main Algo Settings")
endDate = input(timestamp("1 January 2060 00:00 +0000"), "Date Start", group="Main Algo Settings")
timeCondition = true

// This study is an experiment utilizing the Ehlers Gaussian Filter technique combined with lag reduction techniques and true range to analyze trend activity.
// Gaussian filters, as Ehlers explains it, are simply exponential moving averages applied multiple times.
// First, beta and alpha are calculated based on the sampling period and number of poles specified. The maximum number of poles available in this script is 9.
// Next, the data being analyzed is given a truncation option for reduced lag, which can be enabled with "Reduced Lag Mode".
// Then the alpha and source values are used to calculate the filter and filtered true range of the dataset.
// Filtered true range with a specified multiplier is then added to and subtracted from the filter, generating a channel.
// Lastly, a one pole filter with a N pole alpha is averaged with the filter to generate a faster filter, which can be enabled with "Fast Response Mode".

// Custom bar colors are included.

// Note: Both the sampling period and number of poles directly affect how much lag the indicator has, and how smooth the output is.
//      Larger inputs will result in smoother outputs with increased lag, and smaller inputs will have noisier outputs with reduced lag.
//      For the best results, I recommend not setting the sampling period any lower than the number of poles + 1. Going lower truncates the equation.

//-----------------------------------------------------------------------------------------------------------------------------------------------------------------
// Updates:
// Huge shoutout to @e2e4mfck for taking the time to improve the calculation method!
// -> migrated to v4
// -> pi is now calculated using trig identities rather than being explicitly defined.
// -> The filter calculations are now organized into functions rather than being individually defined.
// -> Revamped color scheme.

//-----------------------------------------------------------------------------------------------------------------------------------------------------------------
// Functions - courtesy of @e2e4mfck
//-----------------------------------------------------------------------------------------------------------------------------------------------------------------

// Filter function
f_filt9x (_a, _s, _i) =>
    int _m2 = 0, int _m3 = 0, int _m4 = 0, int _m5 = 0, int _m6 = 0,
    int _m7 = 0, int _m8 = 0, int _m9 = 0, float _f = .0, _x = (1 - _a)
    // Weights.
    // Initial weight _m1 is a pole number and equal to _i
    _m2 := _i == 9 ? 36  : _i == 8 ? 28 : _i == 7 ? 21 : _i == 6 ? 15 : _i == 5 ? 10 : _i == 4 ? 6 : _i == 3 ? 3 : _i == 2 ? 1 : 0
    _m3 := _i == 9 ? 84  : _i == 8 ? 56 : _i == 7 ? 35 : _i == 6 ? 20 : _i == 5 ? 10 : _i == 4 ? 4 : _i == 3 ? 1 : 0
    _m4 := _i == 9 ? 126 : _i == 8 ? 70 : _i == 7 ? 35 : _i == 6 ? 15 : _i == 5 ? 5  : _i == 4 ? 1 : 0
    _m5 := _i == 9 ? 126 : _i == 8 ? 56 : _i == 7 ? 21 : _i == 6 ? 6  : _i == 5 ? 1  : 0
    _m6 := _i == 9 ? 84  : _i == 8 ? 28 : _i == 7 ? 7  : _i == 6 ? 1  : 0
    _m7 := _i == 9 ? 36  : _i == 8 ? 8  : _i == 7 ? 1  : 0
    _m8 := _i == 9 ? 9   : _i == 8 ? 1  : 0
    _m9 := _i == 9 ? 1   : 0
    // filter
    _f :=   math.pow(_a, _i) * nz(_s) +
      _i  *     _x      * nz(_f[1])      - (_i >= 2 ?
      _m2 * math.pow(_x, 2)  * nz(_f[2]) : 0) + (_i >= 3 ?
      _m3 * math.pow(_x, 3)  * nz(_f[3]) : 0) - (_i >= 4 ?
      _m4 * math.pow(_x, 4)  * nz(_f[4]) : 0) + (_i >= 5 ?
      _m5 * math.pow(_x, 5)  * nz(_f[5]) : 0) - (_i >= 6 ?
      _m6 * math.pow(_x, 6)  * nz(_f[6]) : 0) + (_i >= 7 ?
      _m7 * math.pow(_x, 7)  * nz(_f[7]) : 0) - (_i >= 8 ?
      _m8 * math.pow(_x, 8)  * nz(_f[8]) : 0) + (_i == 9 ?
      _m9 * math.pow(_x, 9)  * nz(_f[9]) : 0)

// 9 var declaration fun
f_pole (_a, _s, _i) =>
    _f1 =            f_filt9x(_a, _s, 1),      _f2 = (_i >= 2 ? f_filt9x(_a, _s, 2) : 0), _f3 = (_i >= 3 ? f_filt9x(_a, _s, 3) : 0)
    _f4 = (_i >= 4 ? f_filt9x(_a, _s, 4) : 0), _f5 = (_i >= 5 ? f_filt9x(_a, _s, 5) : 0), _f6 = (_i >= 6 ? f_filt9x(_a, _s, 6) : 0)
    _f7 = (_i >= 2 ? f_filt9x(_a, _s, 7) : 0), _f8 = (_i >= 8 ? f_filt9x(_a, _s, 8) : 0), _f9 = (_i == 9 ? f_filt9x(_a, _s, 9) : 0)
    _fn = _i == 1 ? _f1 : _i == 2 ? _f2 : _i == 3 ? _f3 :
      _i == 4     ? _f4 : _i == 5 ? _f5 : _i == 6 ? _f6 :
      _i == 7     ? _f7 : _i == 8 ? _f8 : _i == 9 ? _f9 : na
    [_fn, _f1]

//-----------------------------------------------------------------------------------------------------------------------------------------------------------------
// Inputs
//-----------------------------------------------------------------------------------------------------------------------------------------------------------------

// Source
src = input(defval=hlc3, title="Source")

// Poles
int N = input.int(defval=4, title="Poles", minval=1, maxval=9)

// Period
int per = input.int(defval=144, title="Sampling Period", minval=2)

// True Range Multiplier
float mult = input.float(defval=1.414, title="Filtered True Range Multiplier", minval=0)

// Lag Reduction
bool modeLag  = input.bool(defval=false, title="Reduced Lag Mode")
bool modeFast = input.bool(defval=false, title="Fast Response Mode")

//-----------------------------------------------------------------------------------------------------------------------------------------------------------------
// Definitions
//-----------------------------------------------------------------------------------------------------------------------------------------------------------------

// Beta and Alpha Components
beta  = (1 - math.cos(4*math.asin(1)/per)) / (math.pow(1.414, 2/N) - 1)
alpha = - beta + math.sqrt(math.pow(beta, 2) + 2*beta)

// Lag
lag = (per - 1)/(2*N)

// Data
srcdata = modeLag ? src + (src - src[lag]) : src
trdata  = modeLag ? ta.tr(true) + (ta.tr(true) - ta.tr(true)[lag]) : ta.tr(true)

// Filtered Values
[filtn, filt1]     = f_pole(alpha, srcdata, N)
[filtntr, filt1tr] = f_pole(alpha, trdata,  N)

// Lag Reduction
filt   = modeFast ? (filtn + filt1)/2 : filtn
filttr = modeFast ? (filtntr + filt1tr)/2 : filtntr

// Bands
hband = filt + filttr*mult
lband = filt - filttr*mult

// Colors
color1   = #0aff68
color2   = #00752d
color3   = #ff0a5a
color4   = #990032
fcolor   = filt > filt[1] ? #0aff68 : filt < filt[1] ? #ff0a5a : #cccccc
barcolor = (src > src[1]) and (src > filt) and (src < hband) ? #0aff68 : (src > src[1]) and (src >= hband) ? #0aff1b : (src <= src[1]) and (src > filt) ? #00752d :
           (src < src[1]) and (src < filt) and (src > lband) ? #ff0a5a : (src < src[1]) and (src <= lband) ? #ff0a11 : (src >= src[1]) and (src < filt) ? #990032 : #cccccc

//-----------------------------------------------------------------------------------------------------------------------------------------------------------------
// Outputs
//-----------------------------------------------------------------------------------------------------------------------------------------------------------------

// Filter Plot
filtplot = plot(filt, title="Filter", color=fcolor, linewidth=3)

// Band Plots
hbandplot = plot(hband, title="Filtered True Range High Band", color=fcolor)
lbandplot = plot(lband, title="Filtered True Range Low Band", color=fcolor)

// Channel Fill
fill(hbandplot, lbandplot, title="Channel Fill", color=color.new(fcolor, 80))

// Bar Color
barcolor(barcolor)

longCondition = ta.crossover(close, hband) and timeCondition
closeAllCondition = ta.crossunder(close, hband) and timeCondition

if longCondition
    strategy.entry("long", strategy.long)

if closeAllCondition
    strategy.close("long")