Stratégie de trading Momentum avec filtre à double intervalle
Aperçu
La stratégie est une stratégie de négociation dynamique basée sur un filtre à intervalles binaires. La stratégie obtient un filtre à intervalles composé en calculant une plage de fluctuation de deux cycles, rapide et lente, pour déterminer le mouvement du prix actuel. La stratégie génère un signal d’achat/vente lorsque le prix franchit cette plage.
Principe de stratégie
- Calculer l’intervalle lisse entre deux cycles rapides et lents. Les intervalles rapides utilisent des cycles plus courts et des multiples plus petits, les intervalles lents utilisent des cycles plus longs et des multiples plus grands.
- La moyenne des intervalles de vitesse rapide et lente est utilisée comme filtre d’intervalle composite (TRF).
- Calculer la relation entre le prix actuel et le prix précédent pour déterminer la tendance à la hausse (upward) et la tendance à la baisse (downward).
- Calculer la dynamique de la trajectoire ascendante (FUB) et descendante (FLB), comme référence de la tendance.
- Les signaux d’achat et de vente sont générés en fonction de la relation entre le prix de clôture et le TRF.
- Il y a quatre stop-loss et un stop-loss, correspondant à différents ratios de position et pourcentages de profit/perte.
Analyse des avantages
- Les filtres à double intervalle combinent des cycles rapides et lents pour s’adapter à différents rythmes de marché et saisir plus d’opportunités de trading.
- La conception de l’ascension et de la descente dynamique aide à suivre les tendances actuelles et à réduire les faux signaux.
- Le réglage de quatre arrêts de gradient permet d’obtenir plus de profits lorsque la tendance se poursuit, mais aussi de verrouiller une partie des profits en temps opportun lorsque la tendance est inversée.
- Le paramètre Stop Loss aide à contrôler les pertes maximales d’une transaction unique et à protéger la sécurité du compte.
Analyse des risques
- Cette stratégie peut générer de nombreux faux signaux lors de chocs ou de mouvements intermédiaires, ce qui entraîne des pertes de transactions fréquentes et de frais de traitement.
- La mise en place d’un frein de gradient peut entraîner le blocage anticipé d’une partie des bénéfices et l’impossibilité de profiter pleinement des avantages de la tendance.
- Les paramètres d’arrêt des dommages peuvent ne pas éviter complètement les dommages extrêmes causés par l’événement Black Swan.
Direction d’optimisation
- On peut envisager d’introduire davantage d’indicateurs techniques ou d’indicateurs de l’humeur du marché comme conditions auxiliaires pour juger des tendances et réduire les faux signaux.
- Les paramètres de stop-loss et de stop-loss peuvent être dynamiquement ajustés en fonction des différents environnements de marché et variétés de transactions, ce qui améliore l’adaptabilité de la stratégie.
- Sur la base de la rétro-analyse, il est possible d’optimiser davantage les paramètres de réglage, tels que le choix des cycles entre les cycles rapide et lent, le réglage des pourcentages d’arrêt et d’arrêt, etc., pour améliorer la stabilité et la rentabilité de la stratégie.
Résumer
La stratégie de négociation de la volatilité de l’acier à double intervalle construit un filtre intégré en aplatissant des intervalles rapides et lents de deux cycles, tout en combinant le dynamisme ascendant et descendant, pour juger de l’évolution des prix et générer des signaux d’achat et de vente. La stratégie a également configuré quatre arrêts de gradient et un arrêt de perte pour contrôler le risque et bloquer les bénéfices.
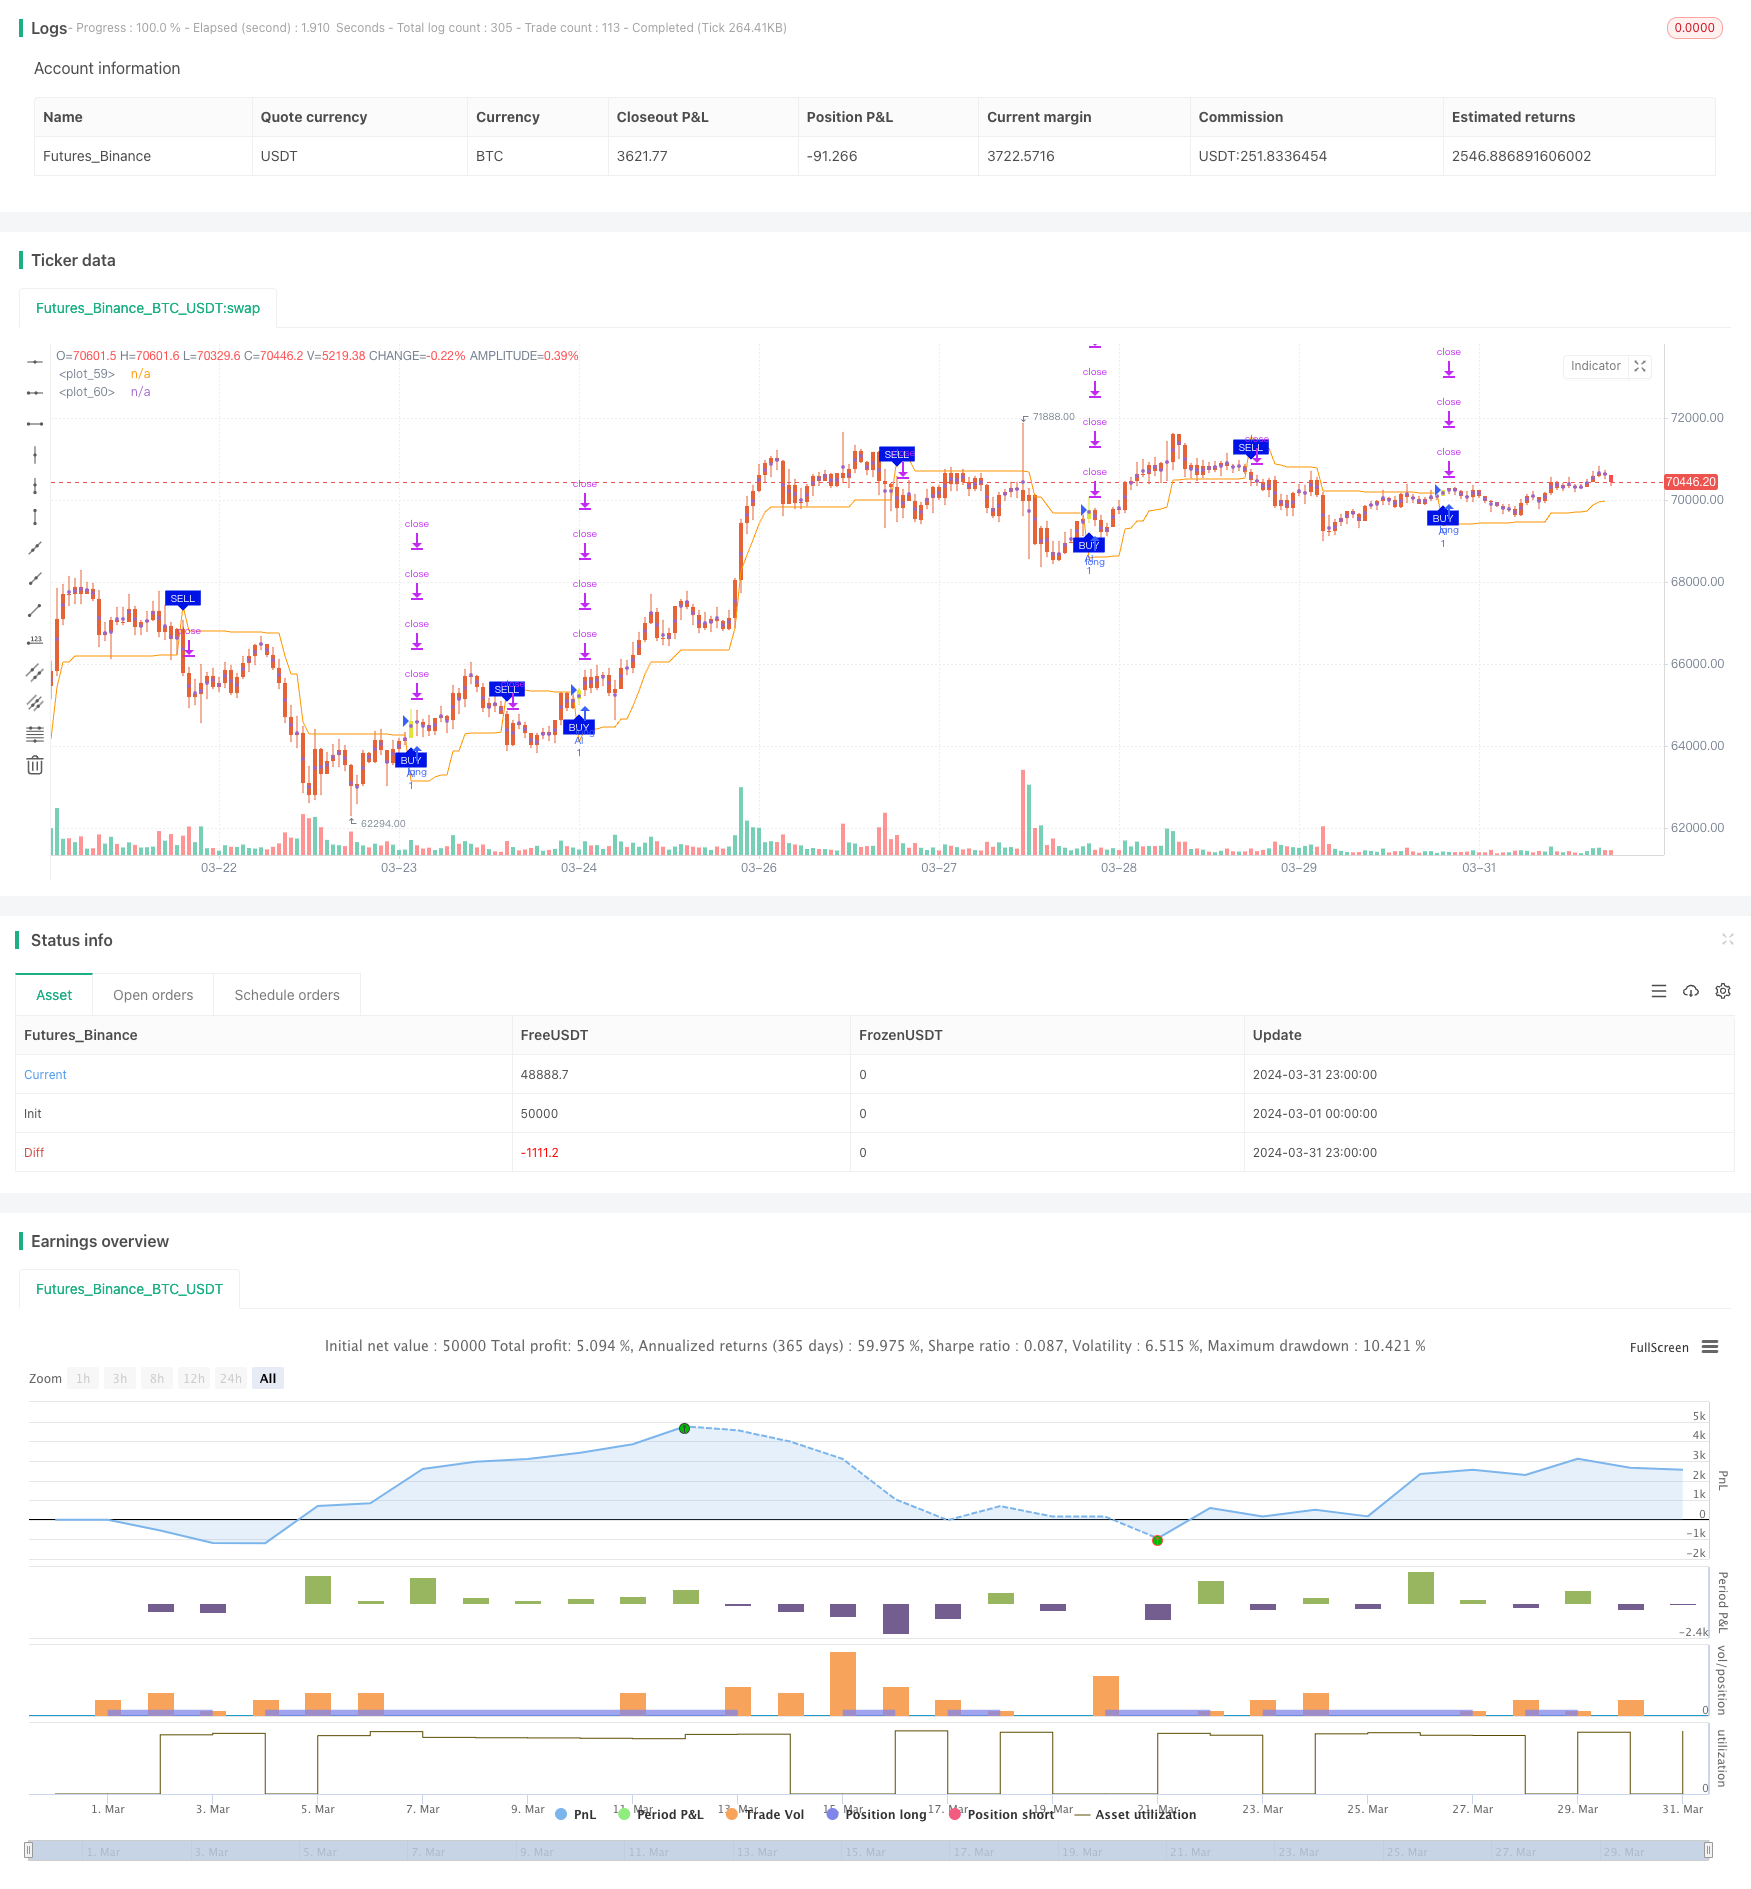
/*backtest
start: 2024-03-01 00:00:00
end: 2024-03-31 23:59:59
period: 1h
basePeriod: 15m
exchanges: [{"eid":"Futures_Binance","currency":"BTC_USDT"}]
*/

// This source code is subject to the terms of the Mozilla Public License 2.0 at https://mozilla.org/MPL/2.0/
//@version=5
strategy(title='2"Twin Range Filter', overlay=true)
strat_dir_input = input.string(title='İşlem Yönü', defval='Alis', options=['Alis', 'Satis', 'Tum'])
strat_dir_value = strat_dir_input == 'Alis' ? strategy.direction.long : strat_dir_input == 'Satis' ? strategy.direction.short : strategy.direction.all
strategy.risk.allow_entry_in(strat_dir_value)

////////////////////////////

// Backtest inputs
BaslangicAy = input.int(defval=1, title='İlk ay', minval=1, maxval=12)
BaslangicGun = input.int(defval=1, title='İlk Gün', minval=1, maxval=31)
BaslangicYil = input.int(defval=2023, title='İlk Yil', minval=2000)
SonAy = input.int(defval=1, title='Son Ay', minval=1, maxval=12)
SonGun = input.int(defval=1, title='Son Gün', minval=1, maxval=31)
SonYil = input.int(defval=9999, title='Son Yıl', minval=2000)

start = timestamp(BaslangicYil, BaslangicAy, BaslangicGun, 00, 00)  // backtest start window
finish = timestamp(SonYil, SonAy, SonGun, 23, 59)  // backtest finish window
window() => true

source = input(defval=close, title='Source')
showsignals = input(title='Show Buy/Sell Signals ?', defval=true)
per1 = input.int(defval=27, minval=1, title='Fast period')
mult1 = input.float(defval=1.6, minval=0.1, title='Fast range')
per2 = input.int(defval=55, minval=1, title='Slow period')
mult2 = input.float(defval=2, minval=0.1, title='Slow range')
smoothrng(x, t, m) =>
    wper = t * 2 - 1
    avrng = ta.ema(math.abs(x - x[1]), t)
    smoothrng = ta.ema(avrng, wper) * m
    smoothrng
smrng1 = smoothrng(source, per1, mult1)
smrng2 = smoothrng(source, per2, mult2)
smrng = (smrng1 + smrng2) / 2
rngfilt(x, r) =>
    rngfilt = x
    rngfilt := x > nz(rngfilt[1]) ? x - r < nz(rngfilt[1]) ? nz(rngfilt[1]) : x - r : x + r > nz(rngfilt[1]) ? nz(rngfilt[1]) : x + r
    rngfilt
filt = rngfilt(source, smrng)
upward = 0.0
upward := filt > filt[1] ? nz(upward[1]) + 1 : filt < filt[1] ? 0 : nz(upward[1])
downward = 0.0
downward := filt < filt[1] ? nz(downward[1]) + 1 : filt > filt[1] ? 0 : nz(downward[1])
STR = filt + smrng
STS = filt - smrng
FUB = 0.0
FUB := STR < nz(FUB[1]) or close[1] > nz(FUB[1]) ? STR : nz(FUB[1])
FLB = 0.0
FLB := STS > nz(FLB[1]) or close[1] < nz(FLB[1]) ? STS : nz(FLB[1])
TRF = 0.0
TRF := nz(TRF[1]) == FUB[1] and close <= FUB ? FUB : nz(TRF[1]) == FUB[1] and close >= FUB ? FLB : nz(TRF[1]) == FLB[1] and close >= FLB ? FLB : nz(TRF[1]) == FLB[1] and close <= FLB ? FUB : FUB
al = ta.crossover(close, TRF)
sat = ta.crossunder(close, TRF)
plotshape(showsignals and al, title='Long', text='BUY', style=shape.labelup, textcolor=color.white, size=size.tiny, location=location.belowbar, color=color.rgb(0, 19, 230))
plotshape(showsignals and sat, title='Short', text='SELL', style=shape.labeldown, textcolor=color.white, size=size.tiny, location=location.abovebar, color=color.rgb(0, 19, 230))
alertcondition(al, title='Long', message='Long')
alertcondition(sat, title='Short', message='Short')
Trfff = plot(TRF)
mPlot = plot(ohlc4, title='', style=plot.style_circles, linewidth=0)
longFillColor = close > TRF ? color.green : na
shortFillColor = close < TRF ? color.red : na
fill(mPlot, Trfff, title='UpTrend Highligter', color=longFillColor, transp=90)
fill(mPlot, Trfff, title='DownTrend Highligter', color=shortFillColor, transp=90)

//////////////////////


renk1 = input(true, "Mum Renk Ayarları?")
mumrenk = input(true,title="Trend Bazlı Mum Rengi Değişimi?")
htaColor = renk1 ? (al ? color.rgb(224, 230, 57) : #E56337) : #c92626
barcolor(color = mumrenk ? (renk1 ? htaColor : na) : na)
if (al) and window()
    strategy.entry("Al", strategy.long)
if (sat) and window()
    strategy.entry("Sat", strategy.short)


per1(pcnt) =>
    strategy.position_size != 0 ? math.round(pcnt / 100 * strategy.position_avg_price / syminfo.mintick) : float(na)
zarkesmgb = input.float(title='Zarar Kes Yüzdesi', defval=100, minval=0.01)
zarkeslos = per1(zarkesmgb)
q1 = input.int(title='Satış Lot Sayısı 1.Kısım %', defval=5, minval=1)
q2 = input.int(title='Satış Lot Sayısı 2.Kısım %', defval=8, minval=1)
q3 = input.int(title='Satış Lot Sayısı 3.Kısım %', defval=13, minval=1)
q4 = input.int(title='Satış Lot Sayısı 4.Kısım %', defval=21, minval=1)
tp1 = input.float(title='Kar Yüzdesi 1.Kısım', defval=13, minval=0.01)
tp2 = input.float(title='Kar Yüzdesi 2.Kısım', defval=21, minval=0.01)
tp3 = input.float(title='Kar Yüzdesi 3.Kısım', defval=29, minval=0.01)
tp4 = input.float(title='Kar Yüzdesi 4.Kısım', defval=34, minval=0.01)
strategy.exit('✨KS1', qty_percent=q1, profit=per1(tp1), loss=zarkeslos)
strategy.exit('✨KS2', qty_percent=q2, profit=per1(tp2), loss=zarkeslos)
strategy.exit('✨KS3', qty_percent=q3, profit=per1(tp3), loss=zarkeslos)
strategy.exit('✨KS4', qty_percent=q4, profit=per1(tp4), loss=zarkeslos)