Trading Momentum : stratégie de croisement de moyennes mobiles doubles

Aperçu
La stratégie utilise les moyennes mobiles indicielles de 8 cycles et de 21 cycles (EMA) pour identifier les changements de tendance du marché. Elle génère un signal d'achat lorsque l'EMA de plus courte durée traverse l'EMA de plus longue durée en bas; et inversement, elle génère un signal de vente lorsque l'EMA de plus courte durée traverse l'EMA de plus longue durée en haut. La stratégie combine également trois basses plus élevées (HLL) et trois hautes plus basses (LLH) consécutives comme signal de confirmation d'un renversement de tendance.
Principe de stratégie
- Les EMA de 8 cycles et de 21 cycles sont calculés pour identifier les principales tendances.
- Identifier trois bas plus élevés (HLL) et trois hauts plus bas (LLH) consécutifs, comme signal précoce d'un renversement de tendance.
- Un signal d'achat est généré lorsque l'EMA de cycle 8 traverse l'EMA de cycle 21 en bas et une rupture de HLL; un signal de vente est généré lorsque l'EMA de cycle 8 traverse l'EMA de cycle 21 en haut et une rupture de LLH.
- Le niveau de stop loss est fixé à 5% du prix d'entrée, et le niveau de stop stop est fixé à 16% du prix d'entrée pour contrôler le risque et bloquer les bénéfices.
- Lorsque le signal de reprise est donné, la position est clôturée et la reprise de la position est effectuée.
Avantages stratégiques
- La combinaison des EMA et des modèles de comportement des prix (HLL et LLH) permet de confirmer les tendances et d'améliorer la fiabilité du signal.
- Les niveaux de stop-loss et de stop-loss définis permettent de contrôler les risques et de bloquer les bénéfices.
- Il est adapté à plusieurs périodes et marchés, avec une certaine universalité.
- La logique est claire, facile à comprendre et à mettre en œuvre.
Risque stratégique
- Dans un marché en crise, des croisements fréquents peuvent entraîner de multiples faux signaux et entraîner des pertes.
- Les niveaux fixes de stop-loss et de stop-loss peuvent ne pas s'adapter à différents environnements de marché, entraînant des coûts d'opportunité potentiels ou des pertes plus importantes.
- Les stratégies reposent sur des données historiques et peuvent être moins adaptées aux événements soudains ou aux changements fondamentaux.
Orientation de l'optimisation de la stratégie
- L'introduction de mécanismes d'arrêt et d'arrêt adaptatifs, basés sur la volatilité (comme l'ATR) pour ajuster les niveaux d'arrêt et d'arrêt afin de mieux s'adapter aux différentes conditions du marché.
- Il peut être combiné avec d'autres indicateurs ou facteurs, tels que le volume de transactions, l'indice de force relative (RSI) pour filtrer davantage les signaux et améliorer la fiabilité.
- Optimiser les paramètres (par exemple, les cycles EMA, le taux de stop loss, etc.) pour trouver la combinaison de paramètres qui fonctionne le mieux sur un marché ou un indice particulier.
- Envisagez d'introduire des mesures de gestion des risques, telles que le dimensionnement des positions, afin de contrôler les marges de risque pour les transactions ponctuelles.
Résumer
La stratégie utilise le croisement des EMA de 8 cycles et de 21 cycles, en combinaison avec les modèles de prix HLL et LLH, pour identifier un renversement de tendance et générer un signal de négociation. Des règles claires de stop-loss aident à contrôler les risques et à bloquer les bénéfices. Cependant, la stratégie peut générer de faux signaux dans des marchés instables et des niveaux de stop-loss fixes peuvent ne pas s'adapter aux différents environnements de marché.
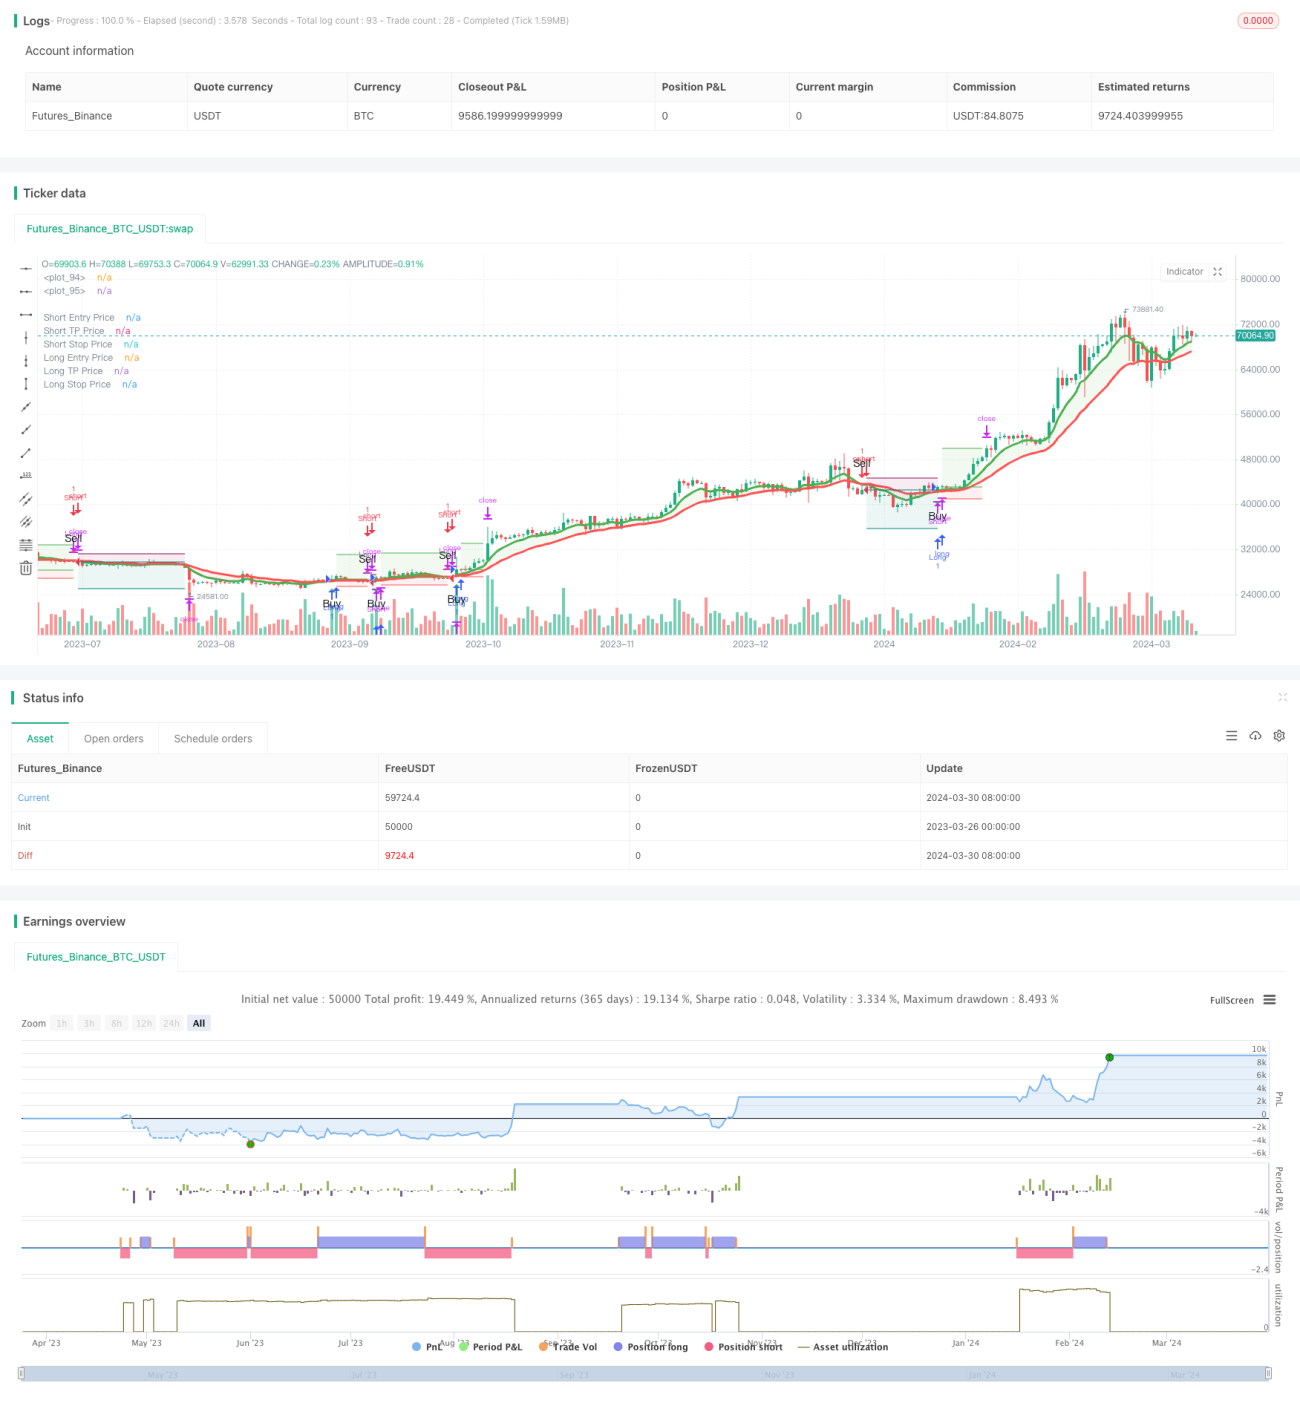
/*backtest
start: 2023-03-26 00:00:00
end: 2024-03-31 00:00:00
period: 1d
basePeriod: 1h
exchanges: [{"eid":"Futures_Binance","currency":"BTC_USDT"}]
*/

//@version=5
strategy('Trend Following 8&21EMA with strategy tester [ukiuro7]', overlay=true, process_orders_on_close=true, calc_on_every_tick=true, initial_capital = 10000)

//INPUTS- 1