Stratégie de trading quantitative de suivi des tendances multi-indicateurs avec contrôle dynamique des risques

Aperçu
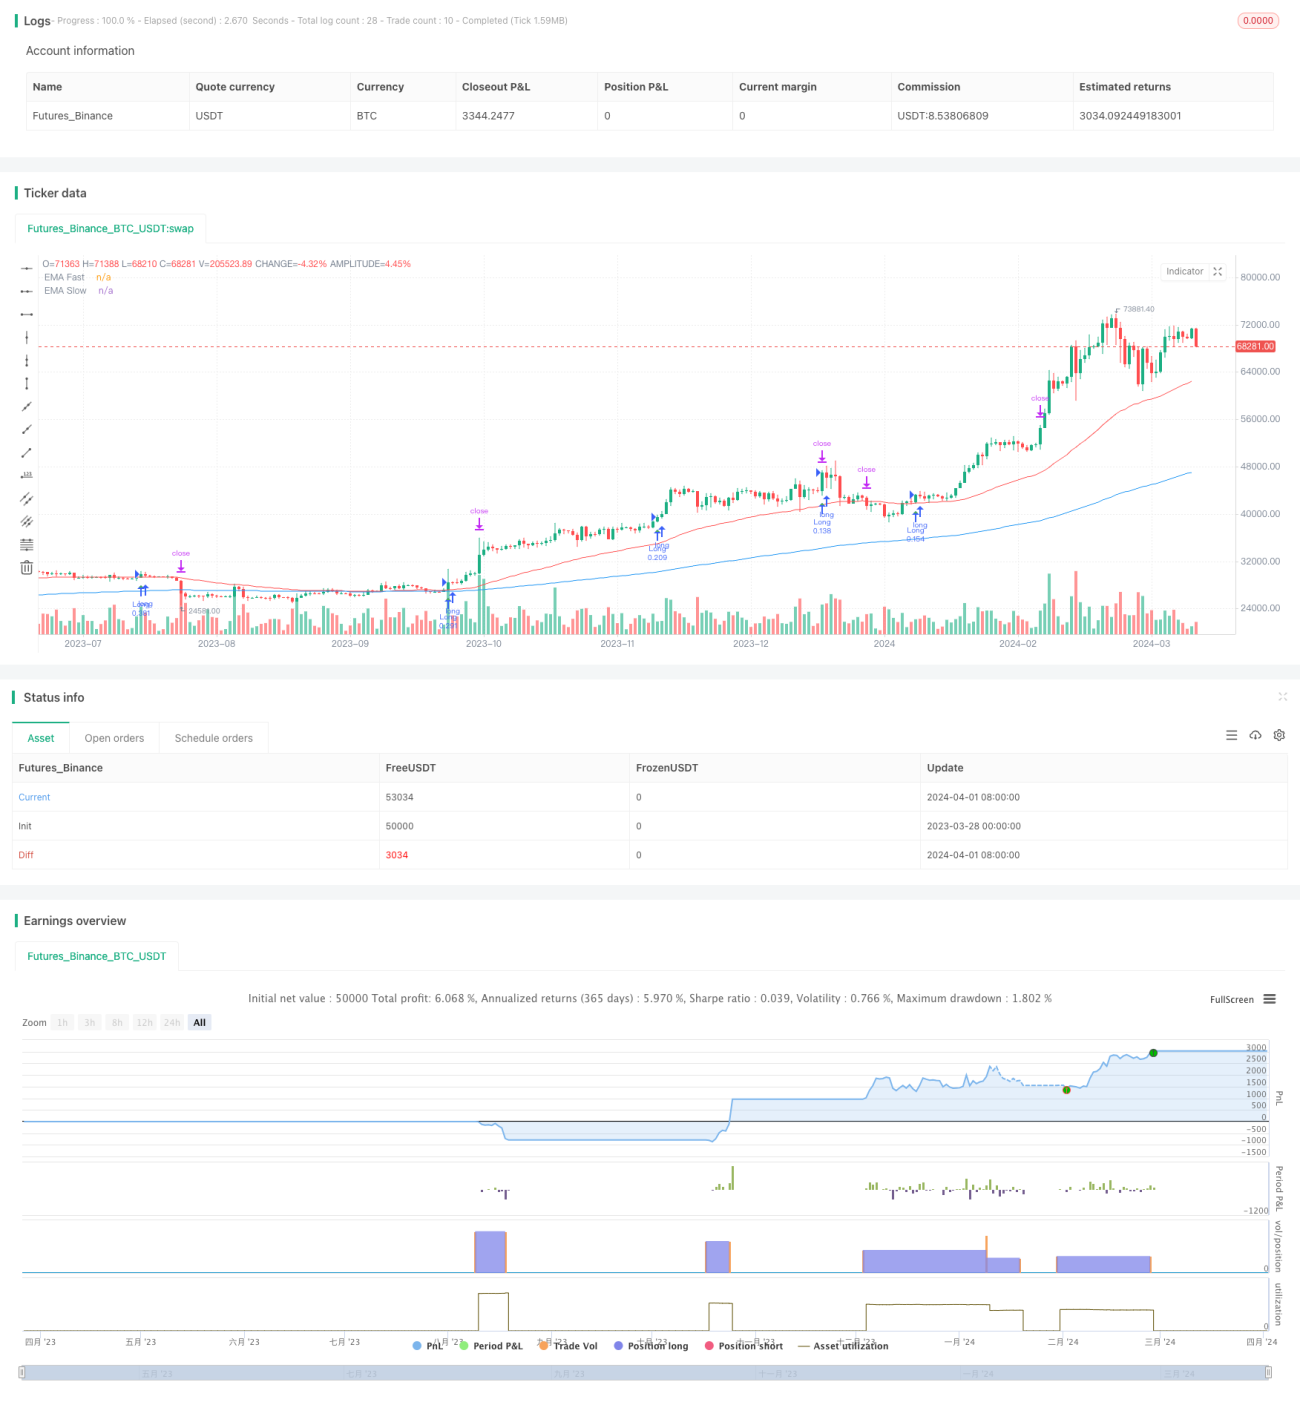
La stratégie utilise plusieurs indicateurs techniques tels que l'indice de force relative (RSI), l'indice de dispersion de convergence des moyennes mobiles (MACD), l'indice de moyenne mobile (EMA) et l'amplitude réelle moyenne (ATR), combiné à une gestion de position dynamique et un mécanisme de stop-loss, pour réaliser une stratégie de trading quantitative complète de suivi des tendances. La stratégie analyse la vitesse, la direction, l'intensité et la volatilité des prix et s'adapte à plusieurs environnements de marché pour capturer les tendances du marché et contrôler les risques.
Principe de stratégie
- Le RSI est utilisé pour mesurer la vitesse et l'ampleur de la variation des prix, identifier les situations de survente et de survente, et fournir des signaux pour les transactions.
- Le MACD détermine la dynamique, la direction et l'intensité des variations de prix en analysant les différences entre les moyennes mobiles rapides et lentes, et indique les points de retournement de tendance.
- Les doubles EMA croisées confirment la direction de la tendance, la ligne rapide franchissant la ligne lente est considérée comme un signal de plus, la ligne rapide franchissant la ligne lente est considérée comme un signal de plus.
- L'ATR mesure la volatilité du marché et est utilisé pour ajuster dynamiquement les niveaux de stop loss et stop loss en fonction des différentes conditions du marché.
- Combinant les conditions multiples du RSI, du MACD et de l'EMA, la stratégie consiste à ouvrir des positions en plus lorsque des tendances à plusieurs têtes se forment et à ouvrir des positions vides lorsque des tendances à vide se forment.
- L'ATR est utilisé comme référence de stop loss et un objectif de profit dynamique est défini, le rapport risque/bénéfice par transaction est maintenu.
- Adaptez dynamiquement la position de chaque transaction en fonction de la marge de risque stratégique et de la volatilité de l'actif indiqué, afin de maintenir la marge de risque constante.
Avantages stratégiques
- Suivi des tendances: la stratégie est basée sur plusieurs indicateurs techniques pour identifier les tendances et saisir efficacement les opportunités de tendances à moyen et long terme du marché.
- Contrôle du vent dynamique: les niveaux de stop loss et stop stop stop sont ajustés en fonction de la dynamique de l'ATR, adaptés aux différentes conditions de marché à volatilité, pour contrôler le risque d'une seule transaction.
- Gestion des positions: en tenant compte de la taille des comptes et de la volatilité des indices, optimiser automatiquement les positions de chaque transaction afin de maintenir la stabilité de l'axe de risque global.
- Adaptabilité: les paramètres de la stratégie peuvent être ajustés de manière flexible pour s'adapter à différents marchés, variétés et styles d'investissement.
- Une discipline stricte: exécuter des transactions sur la base de règles quantitatives, éliminer les influences subjectives des émotions et garantir l'objectivité et la cohérence de la stratégie.
Risque stratégique
- Risques de marché: les incertitudes propres aux marchés financiers, y compris l'influence de facteurs économiques, politiques et d'événements inattendus, peuvent entraîner une déviation de la performance de la stratégie par rapport aux attentes.
- Risque paramétrique: des paramètres mal définis peuvent conduire à une suradaptation des stratégies aux données historiques et à une mauvaise performance dans les applications réelles.
- Points de glissement et frais de transaction: les points de glissement et les frais de transaction dans les transactions réelles peuvent affecter le bénéfice net de la stratégie.
- Extrême: la stratégie peut faire face à un retrait important dans des situations extrêmes (par exemple, environnement de volatilité en évolution rapide, épuisement de la liquidité, etc.).
Orientation de l'optimisation de la stratégie
- Optimisation des paramètres: recherche d'une combinaison optimale de paramètres en faisant un retour sur les données historiques, afin d'améliorer la robustesse et l'adaptabilité de la stratégie.
- Configuration dynamique des positions ouvertes: Adaptez dynamiquement la proportion des positions ouvertes en fonction de l'intensité et de la direction des tendances du marché pour mieux saisir les tendances.
- Ajouter un jugement de l'état du marché: en combinant des indicateurs tels que la volatilité et la corrélation, pour juger de l'état du marché et adopter une stratégie d'ajustement correspondante dans différents états.
- Combinée à l'analyse fondamentale: intégrer des facteurs fondamentaux tels que la macroéconomie et les tendances de l'industrie, pour guider l'utilisation et l'interprétation des indicateurs techniques.
- Optimisation du contrôle des risques: ajout d'outils de gestion des risques avancés, tels que l'optimisation du portefeuille, l'utilisation d'outils de couverture, etc., sur la base de l'arrêt dynamique des pertes.
Résumer
La stratégie utilise des positions dynamiques et une gestion des risques pour contrôler les risques de retrait tout en saisissant les opportunités de tendance. La stratégie est très applicable et peut être adaptée de manière optimale en fonction des caractéristiques du marché et des besoins d'investissement. Cependant, dans la pratique, il est nécessaire de prêter attention aux facteurs tels que les risques du marché, la configuration des paramètres, les coûts de négociation, etc., et d'évaluer et d'optimiser régulièrement la stratégie.
//@version=5
strategy("Enhanced Professional Strategy V6", shorttitle="EPS V6", overlay=true)

// Input parameters with tooltips for enhanced user understanding.
rsiPeriod = input.int(14, title="RSI Period", tooltip="Period length for the Relative Strength Index. Standard setting is 14. Adjust to increase or decrease sensitivity.")
macdFastLength = input.int(12, title="MACD Fast Length", tooltip="Length for the fast EMA in the MACD. Typical setting is 12. Adjust for faster signal response.")
macdSlowLength = input.int(26, title="MACD Slow Length", tooltip="Length for the slow EMA in the MACD. Standard setting is 26. Adjust for slower signal stabilization.")
macdSmoothing = input.int(9, title="MACD Smoothing", tooltip="Smoothing length for the MACD signal line. Commonly set to 9. Modifies signal line smoothness.")
atrLength = input.int(14, title="ATR Length", tooltip="Period length for the Average True Range. Used to measure market volatility.")
riskRewardRatio = input.float(2.0, title="Risk/Reward Ratio", tooltip="Your target risk vs. reward ratio. A setting of 2.0 aims for profits twice the size of the risk.")
emaFastLength = input.int(50, title="EMA Fast Length", tooltip="Period length for the fast Exponential Moving Average. Influences trend sensitivity.")
emaSlowLength = input.int(200, title="EMA Slow Length", tooltip="Period length for the slow Exponential Moving Average. Determines long-term trend direction.")- 1