Stratégie double RSI et bandes de Bollinger

Aperçu
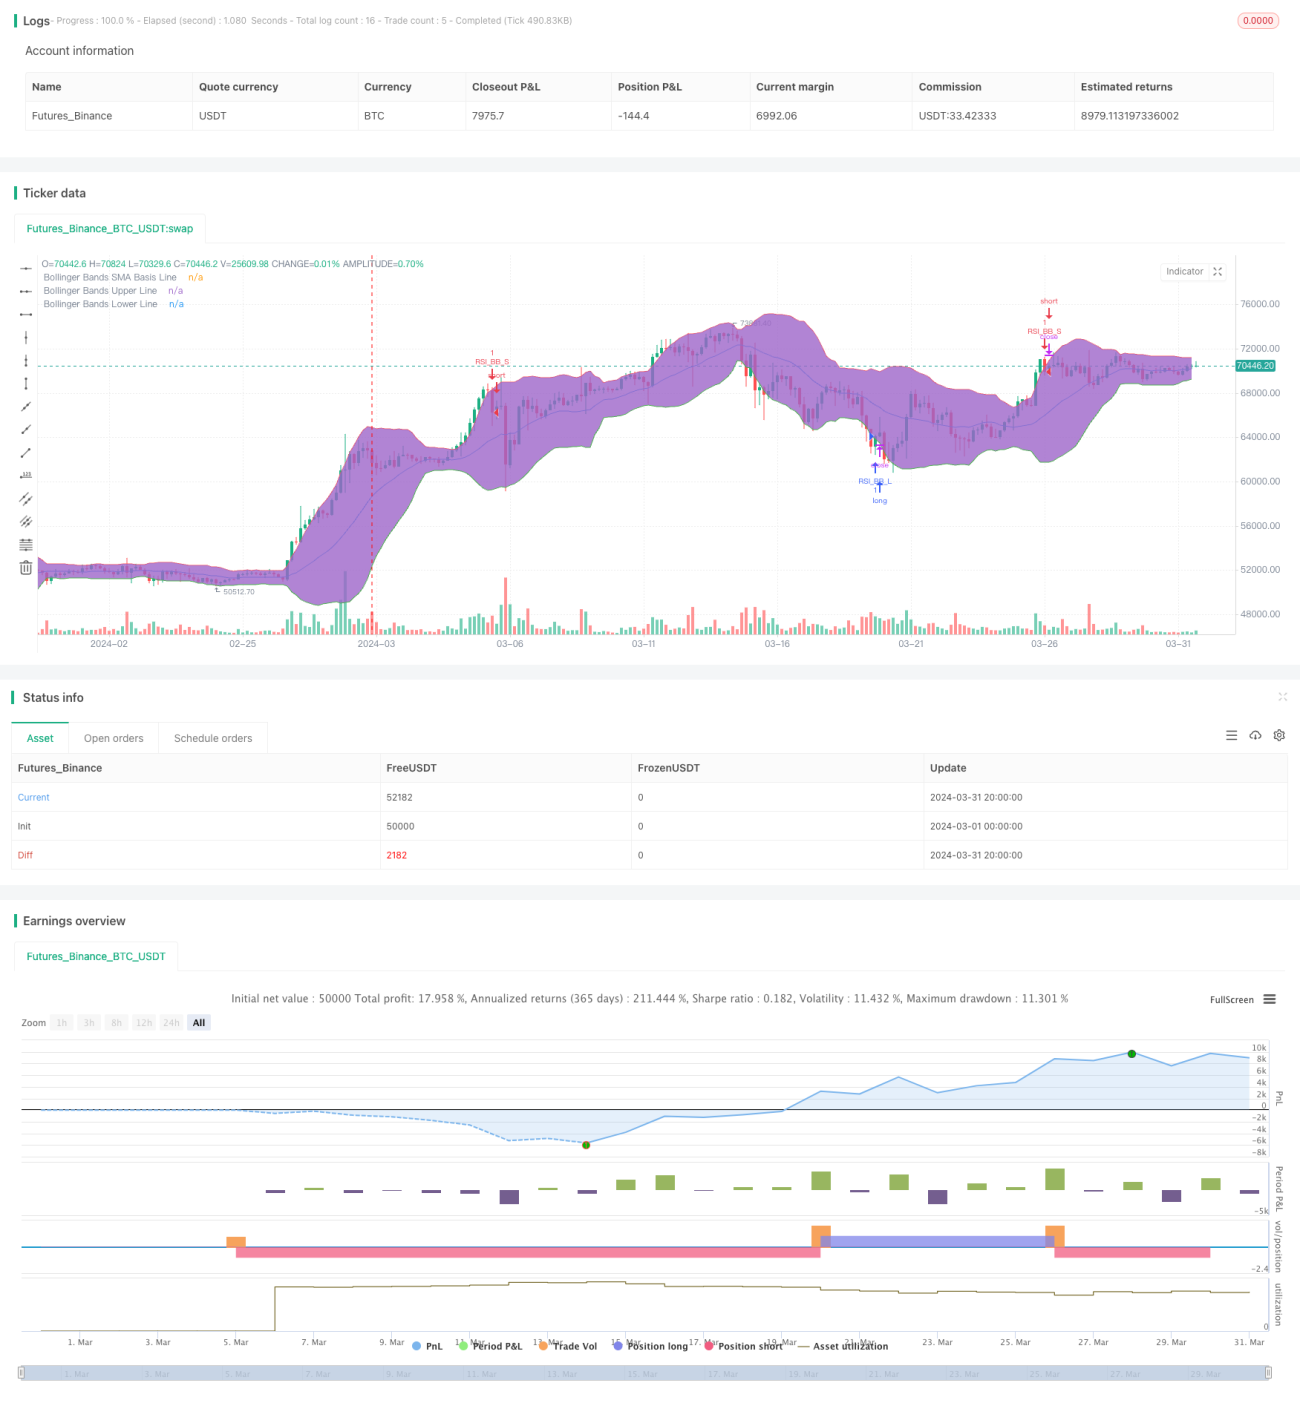
Cette stratégie combine deux indicateurs techniques, l'indice relativement faible (RSI) et les bandes de Bollinger (Bollinger Bands), pour générer un signal d'achat lorsque le prix est en dessous de la bande de Bollinger et un signal de vente lorsque le prix est au-dessus de la bande de Bollinger. La stratégie ne déclenche un signal de négociation que lorsque l'indicateur RSI et l'indicateur de Bollinger sont en survente ou en survente simultanément.
Principe de stratégie
- Calculer le RSI en fonction des paramètres RSI définis.
- La formule de la ceinture de Brin est utilisée pour calculer la voie moyenne, la voie supérieure et la voie inférieure de Brin.
- Détermine si le cours de clôture actuel a dépassé la barre de Brin pour monter ou descendre.
- Détermine si le RSI est supérieur au seuil de survente ou inférieur au seuil de survente.
- Un signal de transaction correspondant est généré lorsque les bandes de Brin et le RSI remplissent simultanément les conditions d'achat ou de vente.
Avantages stratégiques
- La combinaison de deux indicateurs techniques, la tendance et la dynamique, permet de juger plus globalement de l'état du marché.
- L'utilisation de deux indicateurs en même temps comme conditions de filtrage réduit efficacement la probabilité d'apparition de faux signaux.
- La logique du code est claire, les paramètres sont flexibles, adaptés à différents environnements de marché et styles de négociation.
Risque stratégique
- Dans les marchés en crise, cette stratégie peut entraîner des transactions à perte.
- Une mauvaise configuration des paramètres peut entraîner une mauvaise performance de la stratégie et nécessite une optimisation en fonction de la situation réelle.
- La stratégie n'a pas de stop-loss et peut présenter un risque de retrait plus élevé.
Orientation de l'optimisation de la stratégie
- Les paramètres du RSI et de la BRI peuvent être optimisés en fonction des caractéristiques du marché et des préférences personnelles.
- L'introduction d'autres indicateurs techniques comme le MACD, la moyenne, etc., améliore la fiabilité du signal.
- Il est nécessaire de mettre en place des stop-loss et des stops raisonnables pour contrôler le risque d'une transaction.
- Pour les marchés instables, on peut envisager d'augmenter les conditions de jugement ou de réduire les positions, afin de réduire les coûts liés aux transactions fréquentes.
Résumer
La double stratégie RSI et les courbes de Brent permet de juger de la situation du marché de manière plus globale en combinant des indicateurs de tendance et de dynamique et de donner des signaux de négociation correspondants. Cependant, la stratégie peut être moins performante dans les marchés instables et ne dispose pas de mesures de contrôle du risque.
/*backtest
start: 2024-03-01 00:00:00
end: 2024-03-31 23:59:59
period: 4h
basePeriod: 15m
exchanges: [{"eid":"Futures_Binance","currency":"BTC_USDT"}]
*/

//@version=4
strategy("Bollinger + RSI, Double Strategy (by ChartArt) v1.1", shorttitle="CA_-_RSI_Bol_Strat_1.1", overlay=true)

// ChartArt's RSI + Bollinger Bands, Double Strategy - Update- 1