Position dynamique SPARK et stratégie de trading à double indicateur

Aperçu
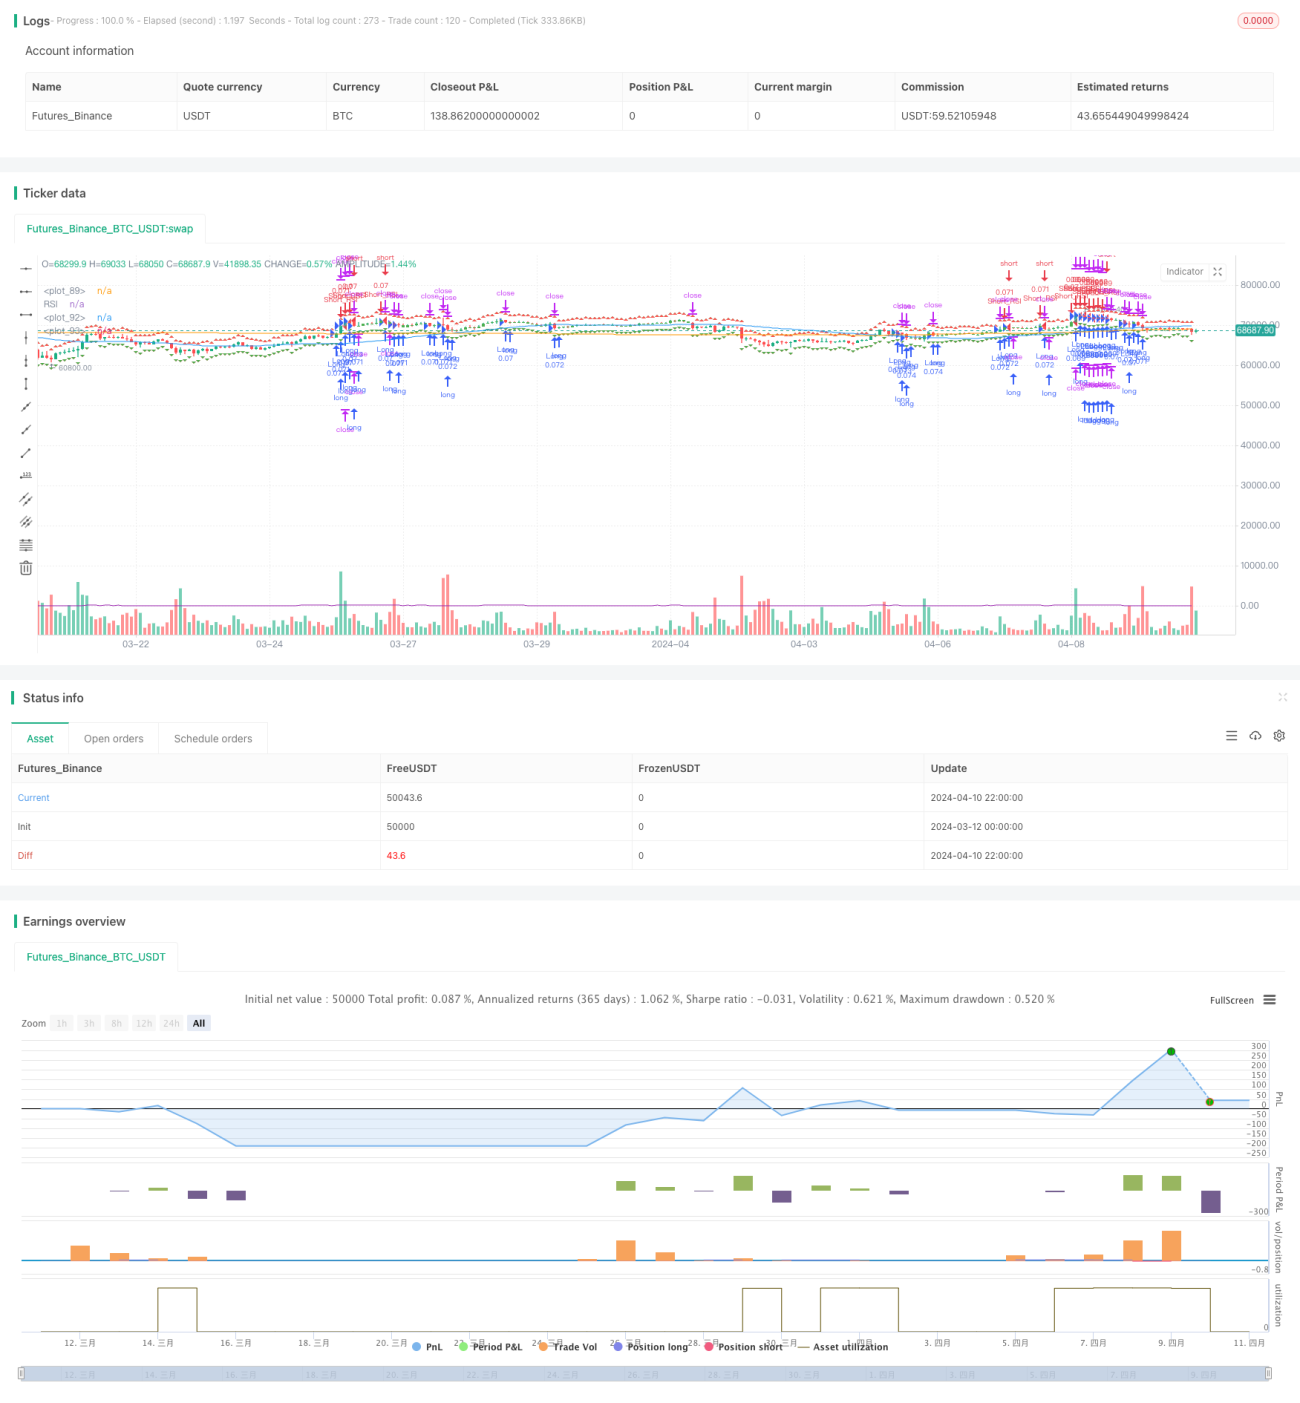
La stratégie SPARK est une stratégie de trading quantitative combinant un ajustement de position dynamique et une confirmation de double indicateur. La stratégie utilise l'indicateur SuperTrend et l'indice de force relative (RSI) pour identifier les points d'entrée et de sortie potentiels, tout en utilisant un mécanisme d'ajustement de position dynamique pour optimiser la répartition des fonds.
Principe de stratégie
Le cœur de la stratégie SPARK est l'application combinée de l'indicateur SuperTrend et de l'indicateur RSI. L'indicateur SuperTrend est utilisé pour juger de la direction de la tendance en comparant le prix de clôture à la relation entre la résistance et la position de support dynamique, tandis que l'indicateur RSI est utilisé pour identifier les conditions de survente et de survente du marché.
La stratégie utilise un mécanisme d'ajustement de position dynamique pour optimiser l'allocation de fonds pour chaque transaction. En définissant des pourcentages de portefeuille et un taux de levier, la stratégie peut calculer automatiquement la taille de la position optimale en fonction de la situation actuelle du marché et du solde du compte.
Avantages stratégiques
- Confirmation du double indicateur: en combinant les deux indicateurs SuperTrend et RSI, la stratégie SPARK permet d'identifier avec plus de précision les points d'entrée et de sortie potentiels, réduisant ainsi le risque d'erreur.
- Ajustement de position dynamique: la stratégie utilise un mécanisme d'ajustement de position dynamique qui permet d'optimiser automatiquement l'allocation de fonds pour chaque transaction en fonction du pourcentage de portefeuille et du taux de levier, ce qui améliore l'efficacité de l'utilisation des fonds.
- Gestion flexible des risques: la stratégie offre des paramètres de stop-loss flexibles, permettant un contrôle précis des risques en choisissant un pourcentage fixe ou un calcul dynamique en fonction des préférences de risque individuelles.
- Paramètres personnalisés: la stratégie permet à l'utilisateur d'ajuster plusieurs paramètres d'entrée, tels que la longueur ATR, la multiplication, la valeur de la barre RSI, etc., pour s'adapter à différentes conditions de marché et préférences de négociation.
Risque stratégique
- Risque de marché: Bien que la stratégie SPARK utilise un mécanisme de confirmation de double indicateur et de correction de position dynamique, le risque de perte est possible dans des conditions de marché extrêmes.
- Risque d'optimisation des paramètres: la performance d'une stratégie dépend en grande partie de la sélection des paramètres d'entrée. Des paramètres mal configurés peuvent entraîner une mauvaise performance de la stratégie.
- Risque de suradaptation: si les paramètres de la stratégie sont sur-optimisés, cela peut entraîner une mauvaise performance de la stratégie dans les conditions futures du marché.
Orientation de l'optimisation de la stratégie
- Introduction de plus d'indicateurs: envisager l'introduction d'autres indicateurs techniques, tels que le MACD, les bandes de Brin, etc., afin d'améliorer encore la précision de la reconnaissance du signal.
- Optimiser les mécanismes de stop-loss: explorer des stratégies de stop-loss plus avancées, telles que le stop-loss mobile, le stop-loss dynamique, etc., pour mieux protéger les profits et limiter les pertes.
- Adaptation des paramètres: mise au point d'un mécanisme d'adaptation permettant d'ajuster les paramètres stratégiques en fonction de la dynamique du marché afin de s'adapter à l'évolution de l'environnement.
Résumer
La stratégie SPARK offre aux traders une solution complète de trading quantitatif en combinant les indicateurs SuperTrend et RSI, et en utilisant un mécanisme d'ajustement de position dynamique et des outils de gestion du risque flexibles. Bien que la stratégie puisse être exposée à certains risques, la stratégie SPARK est susceptible d'atteindre une performance stable dans diverses conditions de marché grâce à une optimisation et une amélioration continues.
- 1