Stratégie de profit multicouche avec croisement de moyennes mobiles

Aperçu
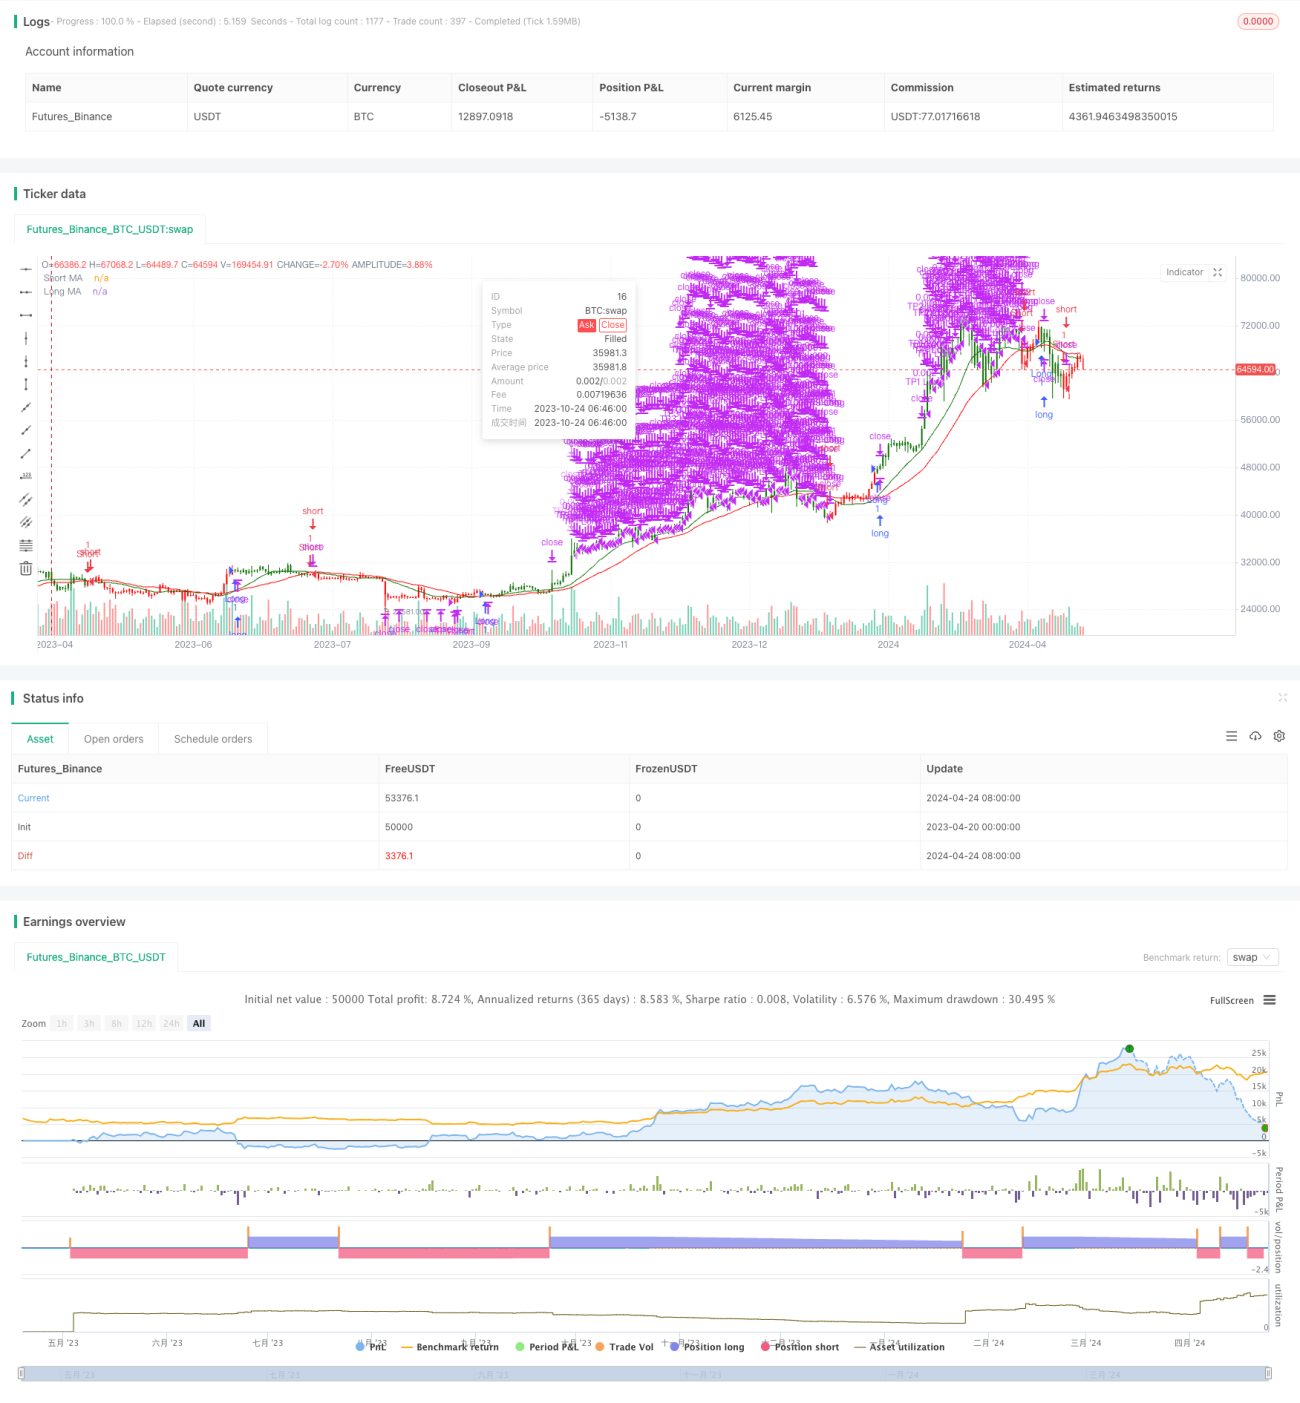
La stratégie utilise le croisement de deux moyennes mobiles pour juger de la tendance du marché, en ouvrant des positions en plus et en moins lorsque la moyenne mobile à court terme est traversée par la moyenne mobile à long terme. En même temps, la stratégie utilise une méthode de clôture à plusieurs niveaux, en se plaçant en lots lorsque le prix atteint le niveau de profit prévu, afin de maximiser les gains et de contrôler les risques.
Principe de stratégie
Le cœur de la stratégie est d'utiliser des moyennes mobiles de différentes périodes pour capturer les tendances du marché. Lorsque le marché est susceptible d'entrer dans une tendance à la hausse, il ouvre plus de positions lorsque le marché est susceptible d'entrer dans une tendance à la hausse, alors que le marché est susceptible d'entrer dans une tendance à la baisse lorsque le marché est susceptible d'entrer dans une tendance à la baisse.
Avantages stratégiques
- Simple et efficace: la stratégie est basée sur le principe classique de la croisée des moyennes mobiles, simple et facile à comprendre, et a également prouvé son efficacité dans la pratique.
- Les gains sont maximisés en définissant plusieurs niveaux de gains et en réduisant les positions en lots lorsque les prix atteignent ces niveaux, tout en contrôlant les risques.
- Flexible en paramètres: les paramètres de la stratégie sont très flexibles et l'utilisateur peut ajuster la période de la moyenne mobile et le niveau de rentabilité en fonction de ses propres besoins et caractéristiques du marché pour obtenir des résultats optimaux.
Risque stratégique
- Risque de fluctuation du marché: lorsque le marché est très volatile, des signaux croisés fréquents peuvent conduire à des transactions fréquentes de la stratégie, augmentant les coûts de transaction et le risque de retrait.
- Risque de paramétrage: un paramétrage inapproprié peut entraîner une mauvaise performance de la stratégie, comme un mauvais choix de la période de la moyenne mobile ou un niveau de profit déraisonnable.
- Risque de détection de tendances: la stratégie est principalement axée sur les tendances, et les faux signaux peuvent être plus fréquents en cas de choc ou de tendances incertaines, ce qui entraîne des pertes.
Orientation de l'optimisation de la stratégie
- Combinaison avec d'autres indicateurs: il peut être envisagé de combiner d'autres indicateurs techniques, tels que le RSI, le MACD, etc., pour améliorer la précision et la fiabilité de la détection des tendances.
- Paramètres d'optimisation: il est possible de rechercher les meilleures périodes de moyenne mobile et les meilleurs paramètres de niveau de rentabilité, en effectuant un retour et une optimisation, pour s'adapter à différentes conditions de marché.
- Ajout d'un stop loss: Vous pouvez envisager d'ajouter un mécanisme de stop loss pour contrôler davantage le risque, par exemple un stop loss dynamique en fonction des paramètres ATR.
- Modifier les conditions d'entrée et de sortie: il est possible d'explorer davantage de conditions d'entrée et de sortie, en tenant compte de facteurs tels que le volume des transactions, la résistance au support, etc., pour améliorer la stabilité de la stratégie.
Résumer
La stratégie de profit à plusieurs niveaux de la moyenne mobile est une stratégie de suivi de tendance simple et efficace qui permet de tirer plus de profit de la tendance tout en contrôlant les risques. Cependant, la stratégie présente également des limites et des risques qui doivent être optimisés et améliorés en fonction des conditions spécifiques du marché et des besoins des utilisateurs.
/*backtest
start: 2023-04-20 00:00:00
end: 2024-04-25 00:00:00
period: 1d
basePeriod: 1h
exchanges: [{"eid":"Futures_Binance","currency":"BTC_USDT"}]
*/

// This Pine Script™ code is subject to the terms of the Mozilla Public License 2.0 at https://mozilla.org/MPL/2.0/
// © ValdesTradingBots

//Follow Us for More Insights and Updates!- 1