Stratégie de trading de moyenne mobile dynamique sur trois périodes de Larry Williams
EMA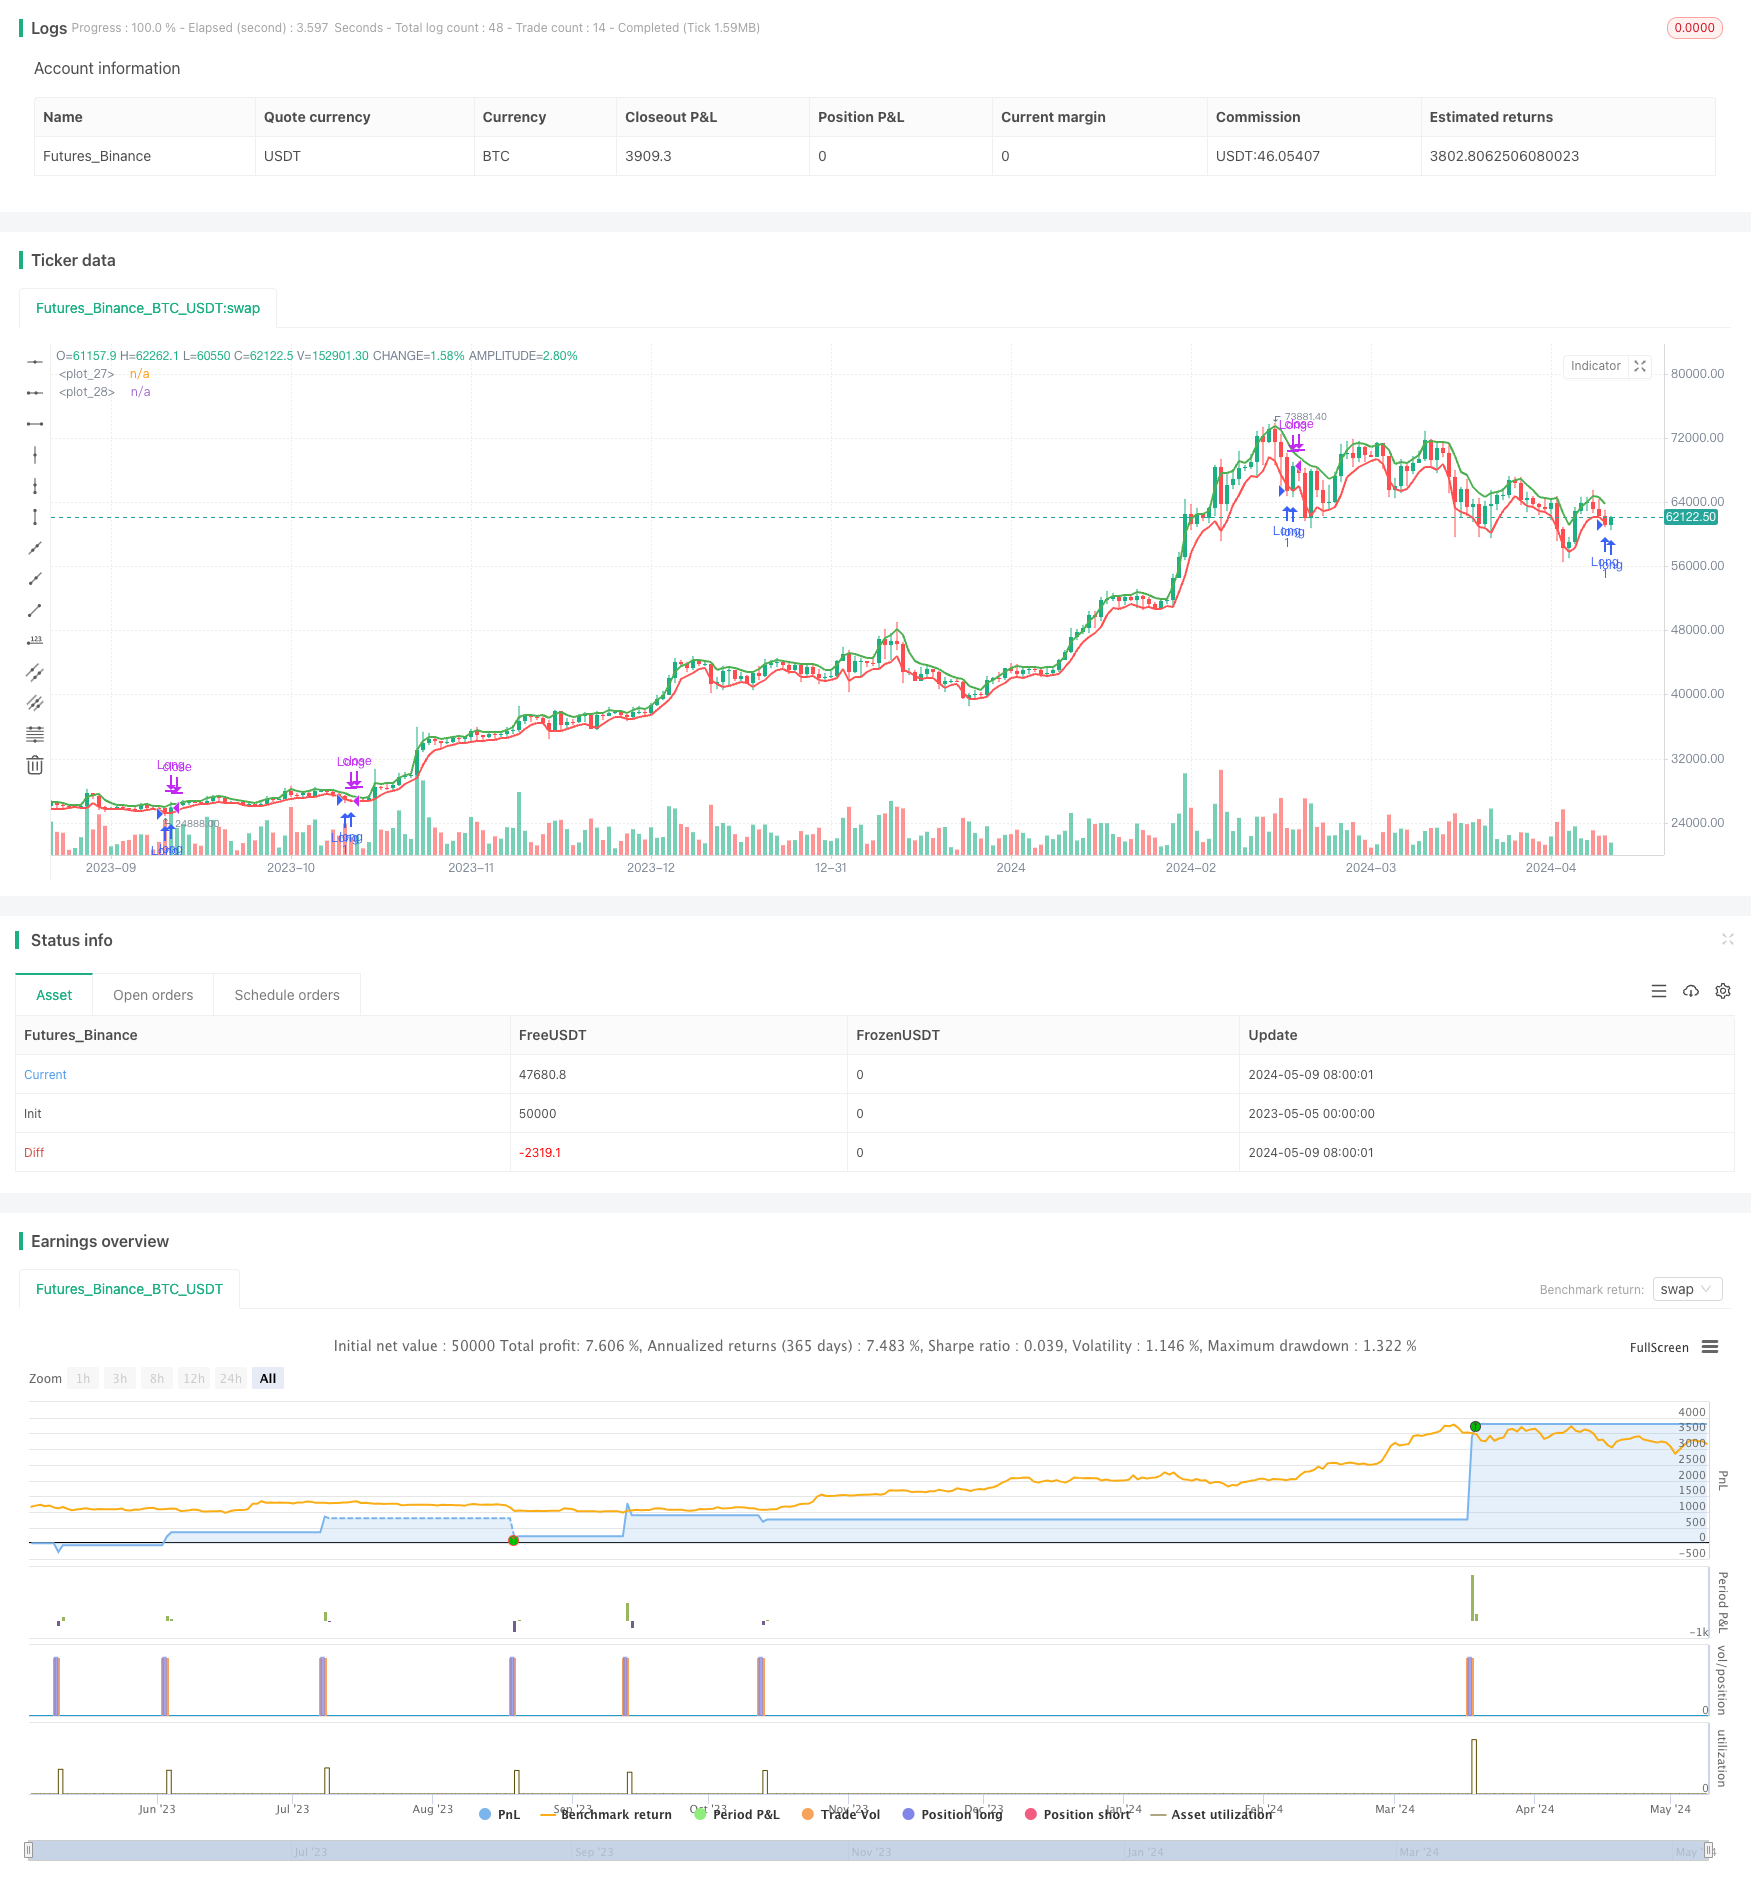
Aperçu
Cette article présente une stratégie de négociation basée sur la moyenne dynamique tricyclique de Larry Williams. Cette stratégie utilise deux moyennes mobiles indicielles (EMA) pour capturer la tendance des prix, générant un signal de négociation lorsque trois lignes K consécutives de clôture des prix franchissent l’EMA. Les paramètres de la stratégie sont réglables et s’appliquent à différents marchés et périodes.
Principe de stratégie
- Calculez deux EMAs: une EMA haute et une EMA basse à la clôture du marché, avec une périodicité variable.
- Déterminer si l’heure actuelle est dans la zone de transaction définie.
- Détermine si les trois dernières lignes K sont en hausse ou en baisse.
- Si 3 est formé et que la position est égale à zéro, il ouvre plus de positions; si le contraire est le cas, 3 est formé et détient plus de positions, il est à plat.
- Si vous tenez une position à la clôture de la journée, elle est à zéro.
Avantages stratégiques
- Paramètres flexibles: les paramètres tels que le cycle EMA, l’intervalle de temps de négociation peuvent être ajustés pour s’adapter à différents marchés.
- Suivi des tendances: l’utilisation de l’EMA et de la ligne K continue pour déterminer les tendances est utile pour capturer les tendances.
- Stop loss en temps réel: le contrecoup dépasse l’EMA et le contrôle de la retraite est immédiat.
- La position de clôture est la position de clôture, pour éviter le risque du lendemain.
Risque stratégique
- Risque de choc: les transactions fréquentes peuvent entraîner des pertes lorsque la tendance est incertaine.
- Risque paramétrique: les paramètres varient considérablement d’un marché à l’autre et nécessitent une optimisation ciblée.
- Risque de crevaison: le crevaison de l’ouverture peut entraîner une stratégie de prise de position différente, augmentant le risque.
Orientation de l’optimisation de la stratégie
- Filtre de tendance: ajouter des indicateurs tels que l’ATR, le RSI pour aider à déterminer la force de la tendance et éviter les marchés volatiles.
- Optimisation des paramètres dynamiques: Ajustez les paramètres dynamiques en fonction des caractéristiques récentes du marché pour améliorer l’adaptabilité.
- Gestion des positions: Ajustez les positions en fonction de la force et de la faiblesse des tendances et de la situation financière, et maîtrisez les risques.
- Ajout d’un stop loss: définir des objectifs de stop loss et de stop loss raisonnables pour réduire le risque de transaction unique.
Résumer
La stratégie de Larry Williams est une stratégie de suivi de tendance basée sur les deux EMA et la direction de la ligne K continue. Elle s’adapte aux différents marchés grâce à l’optimisation des paramètres. Cependant, la stratégie elle-même est relativement simple, elle ne fonctionne pas bien dans les marchés turbulents et manque de mesures de contrôle du vent.
/*backtest
start: 2023-05-05 00:00:00
end: 2024-05-10 00:00:00
period: 1d
basePeriod: 1h
exchanges: [{"eid":"Futures_Binance","currency":"BTC_USDT"}]
*/

//@version=5
strategy("Larry Williams 3 Periodos Editável de MarcosJr", overlay=true, process_orders_on_close=true)

// Parametrização do período do EMA
emaPeriodHighs = input.int(title="Highs Period", defval=3, minval=1, maxval=9999)
emaPeriodLows = input.int(title="Lows Period", defval=3, minval=1, maxval=9999)

// Parametrização da data de início e fim do período a ser coletado
startYear = input.int(title="Start Year", defval=2020)
startMonth = input.int(title="Start Month", defval=1, minval=1, maxval=12)
startDay = input.int(title="Start Day", defval=1, minval=1, maxval=31)

endYear = input.int(title="End Year", defval=2020)
endMonth = input.int(title="End Month", defval=12, minval=1, maxval=12)
endDay = input.int(title="End Day", defval=31, minval=1, maxval=31)

// Convertendo data de início e fim para timestamp
startDate = timestamp(startYear, startMonth, startDay, 00, 00)
endDate = timestamp(endYear, endMonth, endDay, 23, 59)

// EMA
emaH = ta.ema(high, emaPeriodHighs)
emaL = ta.ema(low, emaPeriodLows)

// PLOT:
// Desenha as linhas EMA no gráfico
plot(emaH, color=color.green, linewidth=2)
plot(emaL, color=color.red, linewidth=2)

// Condições
inDateRange = true

// Verifica se houve mais de três candles consecutivos do mesmo sentido
checkThreeConsecutiveCandles = (close[0] > close[1] and close[1] > close[2] and close[2] > close[3]) or (close[0] < close[1] and close[1] < close[2] and close[2] < close[3])

if(close < emaL and inDateRange and checkThreeConsecutiveCandles and barstate.isconfirmed)
    strategy.entry("Long", strategy.long, comment="Long", when=strategy.position_size == 0)
if(close > emaH and inDateRange and checkThreeConsecutiveCandles and barstate.isconfirmed)
    strategy.close("Long", comment="Close Long")

// Fechar a operação no fechamento do pregão
if(strategy.position_size > 0 and na(time_close[0]))
    strategy.close("Long", comment="Close Long")