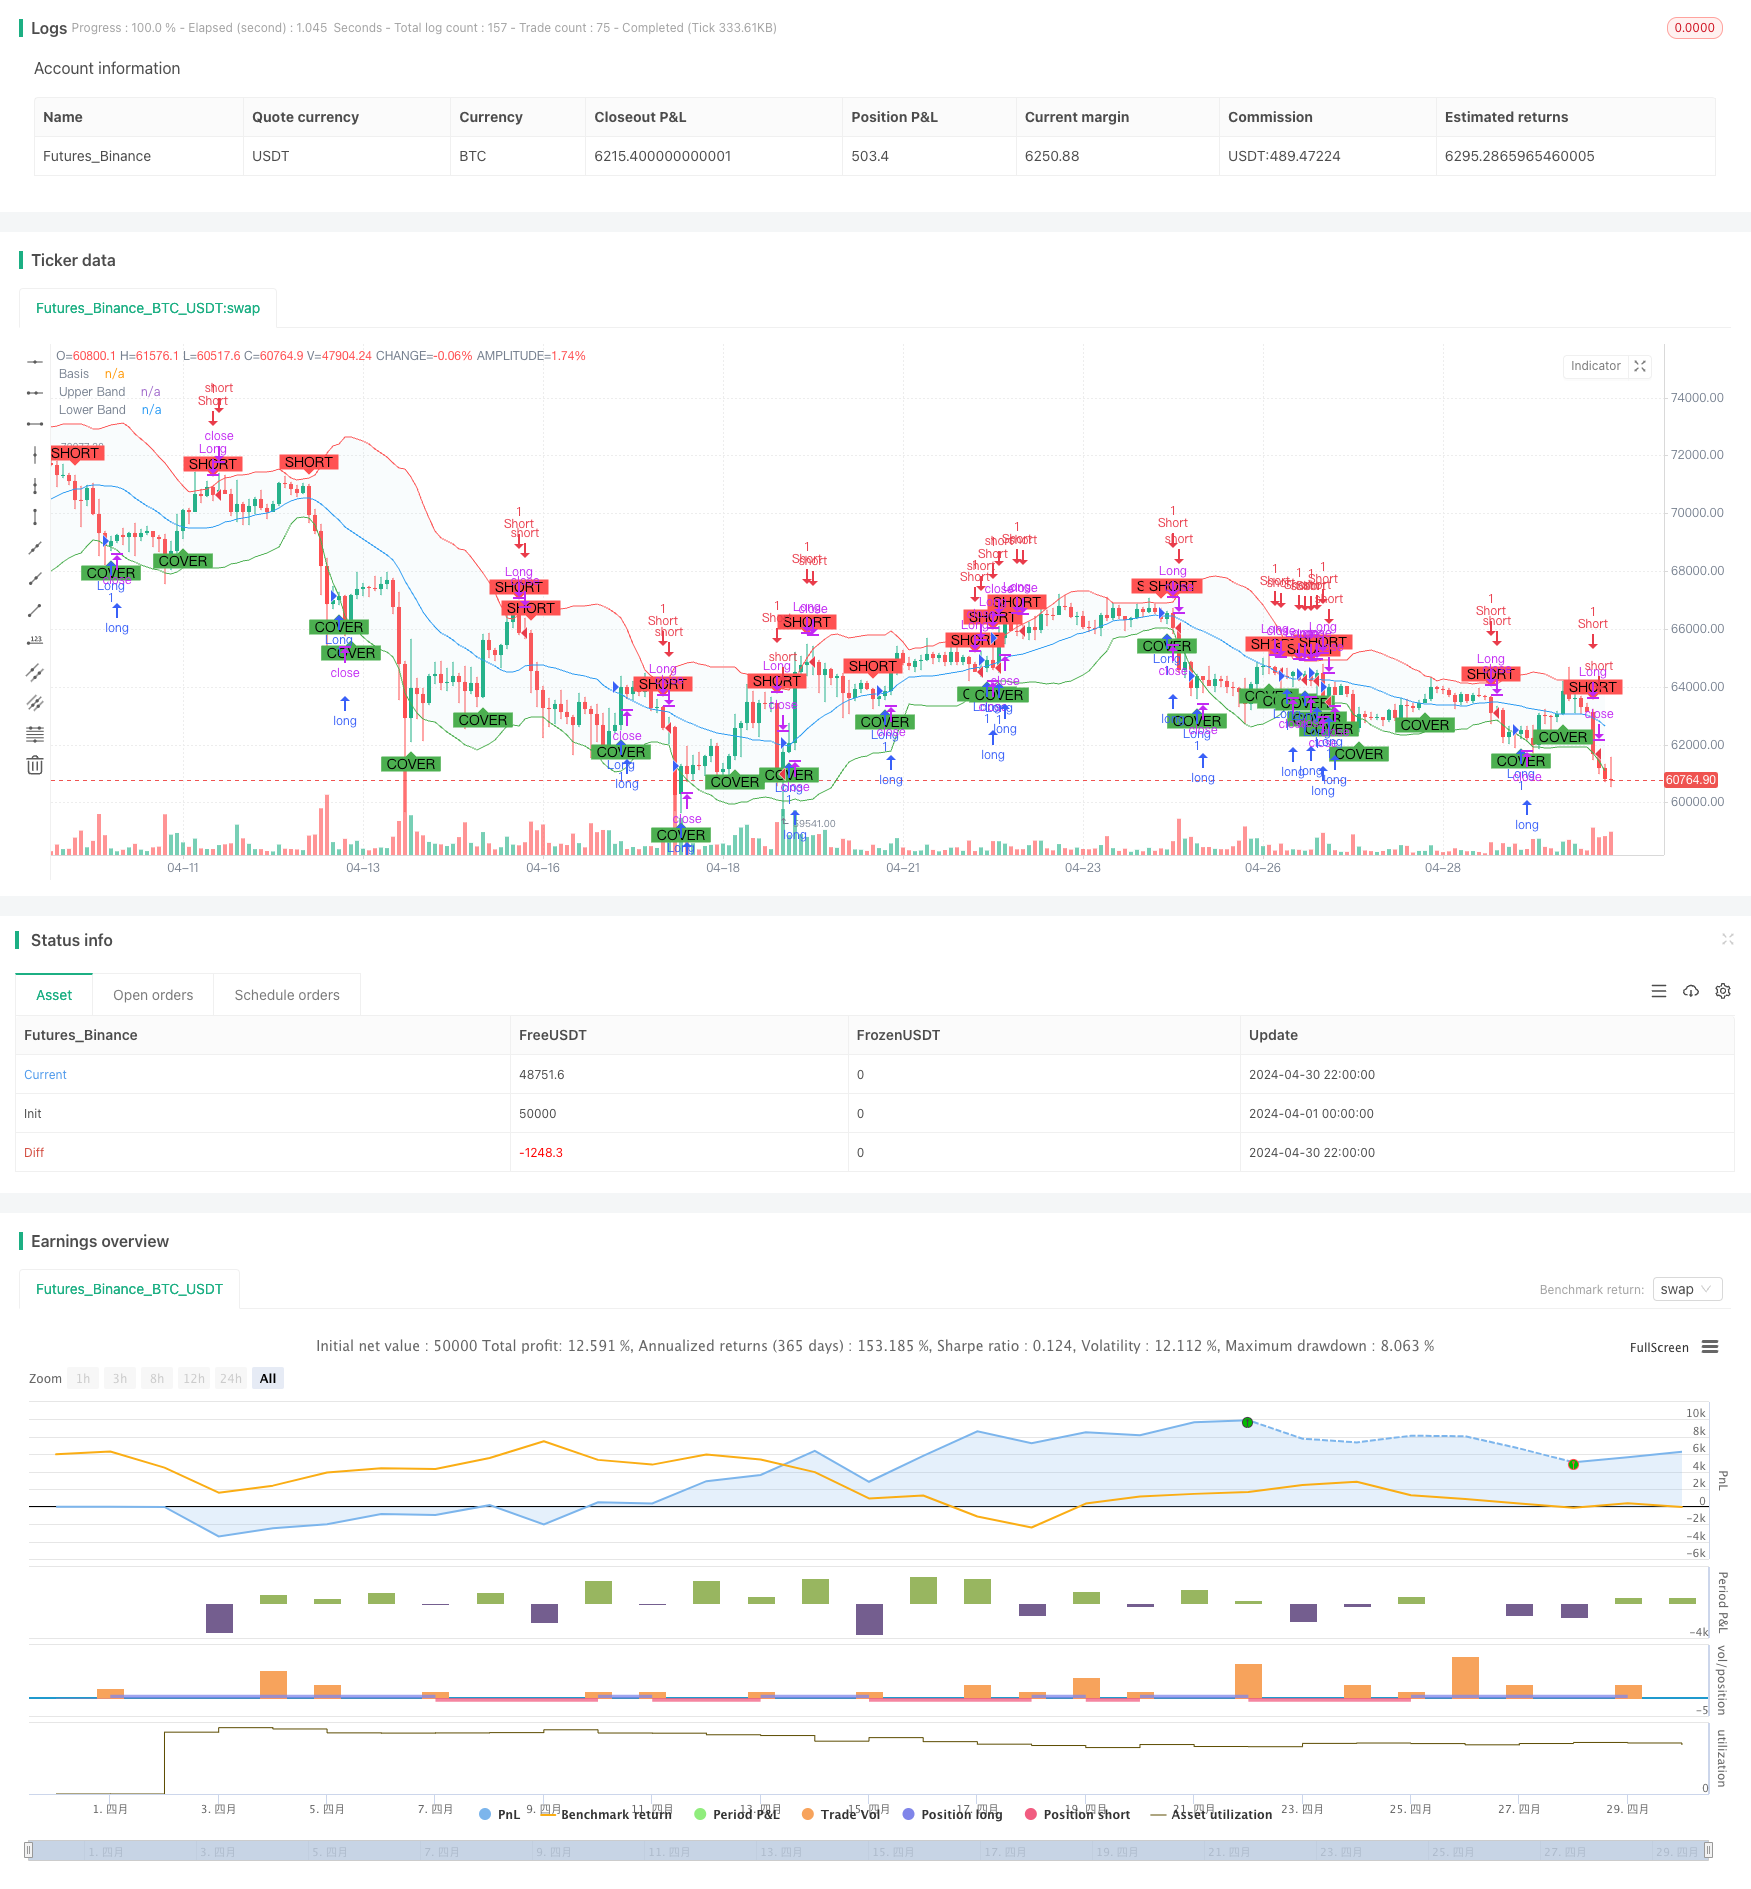
Aperçu
La stratégie est basée sur les indicateurs de la ceinture de Brin, et identifie les meilleures opportunités d’achat et de vente en analysant le mouvement des prix par rapport aux mouvements ascendants, descendants et intermédiaires. La stratégie gère simultanément les positions à plusieurs têtes et vides, permettant de tirer profit de diverses directions du marché. Les paramètres de la stratégie peuvent être personnalisés pour s’adapter à différentes tolérances au risque et aux méthodes de marché.
Principe de stratégie
- Un signal d’achat est généré lorsque le prix est en train de traverser une trajectoire descendante ou intermédiaire, indiquant une éventuelle tendance à la hausse.
- Le signal de vente est déclenché lorsque le prix est en train de s’engager dans une trajectoire descendante ou intermédiaire, indiquant une éventuelle tendance à la baisse.
- Un signal de coupe est déclenché lorsque le prix est en train de s’engager dans une trajectoire descendante ou intermédiaire, ce qui permet de tirer profit d’un marché en baisse.
- Lorsqu’un cours dépasse une trajectoire descendante ou intermédiaire, un signal de liquidation est activé, vous invitant à liquider une position de tête vide pour bloquer les bénéfices ou réduire les pertes.
Avantages stratégiques
- Il est basé sur des principes d’analyse technique fiables et a subi des tests rigoureux pour assurer sa fiabilité et son efficacité.
- Facile à mettre en œuvre et à personnaliser sur TradingView, il convient aux traders de tous niveaux d’expérience.
- Le soutien et les mises à jour sont constants afin d’adapter les stratégies aux conditions changeantes du marché et de maintenir les meilleures performances.
- Fournir des points d’entrée et de sortie dynamiques, en analysant les variations de prix par rapport à la bande de Brin sur les rails, les rails inférieurs et les rails intermédiaires, afin d’assurer l’entrée et la sortie des transactions aux moments les plus favorables.
- La gestion intégrée des positions à plusieurs têtes et des positions vides permet de tirer profit de toutes les directions, quelles que soient les tendances du marché.
Risque stratégique
- Dans des conditions de marché volatiles, des signaux de trading fréquents peuvent conduire à des transactions excessives et potentiellement à des pertes.
- La stratégie s’appuie sur des données historiques et des analyses statistiques qui peuvent ne pas être en mesure de capturer pleinement les comportements irrationnels du marché et les événements de Black Swans.
- Une mauvaise sélection de paramètres peut entraîner une mauvaise performance de la stratégie. Les paramètres doivent être soigneusement optimisés et retestés pour s’adapter à des marchés et des styles de négociation spécifiques.
- Aucune stratégie unique ne peut fonctionner parfaitement dans toutes les conditions du marché. La stratégie de la ceinture de blur peut fonctionner mal dans certaines situations, il est donc recommandé de la combiner avec d’autres indicateurs et techniques de gestion des risques.
Orientation de l’optimisation de la stratégie
- Ajout d’une logique de combinaison de plus d’indicateurs pour identifier des signaux de trading plus fiables, tels que le RSI, le MACD, etc. Cela aide à filtrer le bruit et à réduire les fausses informations.
- Envisagez d’introduire des calculs de volatilité adaptatifs pour ajuster la largeur de la bande de Bryn en fonction de la dynamique des conditions du marché. Cela permet de mieux saisir les opportunités dans différents environnements de volatilité.
- La mise en place d’un mécanisme de stop-loss et d’arrêt basé sur l’ATR ou le pourcentage pour mieux gérer les risques et protéger les bénéfices. Cela aide à limiter les pertes potentielles et à bloquer les gains réalisés.
- Explorez les ajustements de position dynamiques basés sur le cycle du marché ou sur la volatilité des taux. Distribuez des capitaux en fonction de différents scénarios de marché afin d’optimiser les rendements ajustés en fonction du risque.
Résumer
Grâce à l’intégration de la gestion des positions à plusieurs têtes et à vide, des paramètres personnalisés et des fonctionnalités visuelles et de rappel intuitives, la stratégie permet aux traders de saisir les opportunités avec confiance dans une variété de conditions de marché. Malgré l’excellente performance de la stratégie, il reste de la place pour l’optimisation, comme l’intégration d’indicateurs supplémentaires, le calcul des fluctuations dynamiques, de puissantes techniques de gestion des risques et des ajustements de position adaptatifs basés sur l’état du marché.
/*backtest
start: 2024-04-01 00:00:00
end: 2024-04-30 23:59:59
period: 2h
basePeriod: 15m
exchanges: [{"eid":"Futures_Binance","currency":"BTC_USDT"}]
*/

//@version=5
strategy("Bollinger Bands Strategy with Long and Short", overlay=true)

// Bollinger Bands settings
length = input.int(20, title="BB Length")
src = input(close, title="Source")
mult = input.float(2.0, title="BB Multiplier")

// Calculate Bollinger Bands
basis = ta.sma(src, length)
dev = mult * ta.stdev(src, length)
upper = basis + dev
lower = basis - dev

// Plot Bollinger Bands
plot(basis, color=color.blue, linewidth=1, title="Basis")
p1 = plot(upper, color=color.red, linewidth=1, title="Upper Band")
p2 = plot(lower, color=color.green, linewidth=1, title="Lower Band")
fill(p1, p2, color=color.rgb(173, 216, 230, 90))

// Long Buy and Sell conditions
buyConditionLower = ta.crossover(src, lower)
sellConditionUpper = ta.crossunder(src, upper)
buyConditionBasis = ta.crossover(src, basis)
sellConditionBasis = ta.crossunder(src, basis)

// Combine long conditions
buyCondition = buyConditionLower or buyConditionBasis
sellCondition = sellConditionUpper or sellConditionBasis

// Short Sell and Buy conditions
shortConditionUpper = ta.crossunder(src, upper)
coverConditionLower = ta.crossover(src, lower)
shortConditionBasis = ta.crossunder(src, basis)
coverConditionBasis = ta.crossover(src, basis)

// Combine short conditions
shortCondition = shortConditionUpper or shortConditionBasis
coverCondition = coverConditionLower or coverConditionBasis

// Execute strategy orders for long
if (buyCondition)
    strategy.entry("Long", strategy.long)
if (sellCondition)
    strategy.close("Long")

// Execute strategy orders for short
if (shortCondition)
    strategy.entry("Short", strategy.short)
if (coverCondition)
    strategy.close("Short")

// Plot Buy and Sell signals for long
plotshape(series=buyCondition, location=location.belowbar, color=color.green, style=shape.labelup, text="BUY", title="Buy Signal")
plotshape(series=sellCondition, location=location.abovebar, color=color.red, style=shape.labeldown, text="SELL", title="Sell Signal")

// Plot Sell and Cover signals for short
plotshape(series=shortCondition, location=location.abovebar, color=color.red, style=shape.labeldown, text="SHORT", title="Short Signal")
plotshape(series=coverCondition, location=location.belowbar, color=color.green, style=shape.labelup, text="COVER", title="Cover Signal")

// Alert conditions for long
alertcondition(buyCondition, title="Buy Alert", message="Price crossed above the lower Bollinger Band or Basis")
alertcondition(sellCondition, title="Sell Alert", message="Price crossed below the upper Bollinger Band or Basis")

// Alert conditions for short
alertcondition(shortCondition, title="Short Alert", message="Price crossed below the upper Bollinger Band or Basis")
alertcondition(coverCondition, title="Cover Alert", message="Price crossed above the lower Bollinger Band or Basis")