Stratégies d'achat et de vente basées sur des cartes thermiques de volume et des prix en temps réel

Aperçu
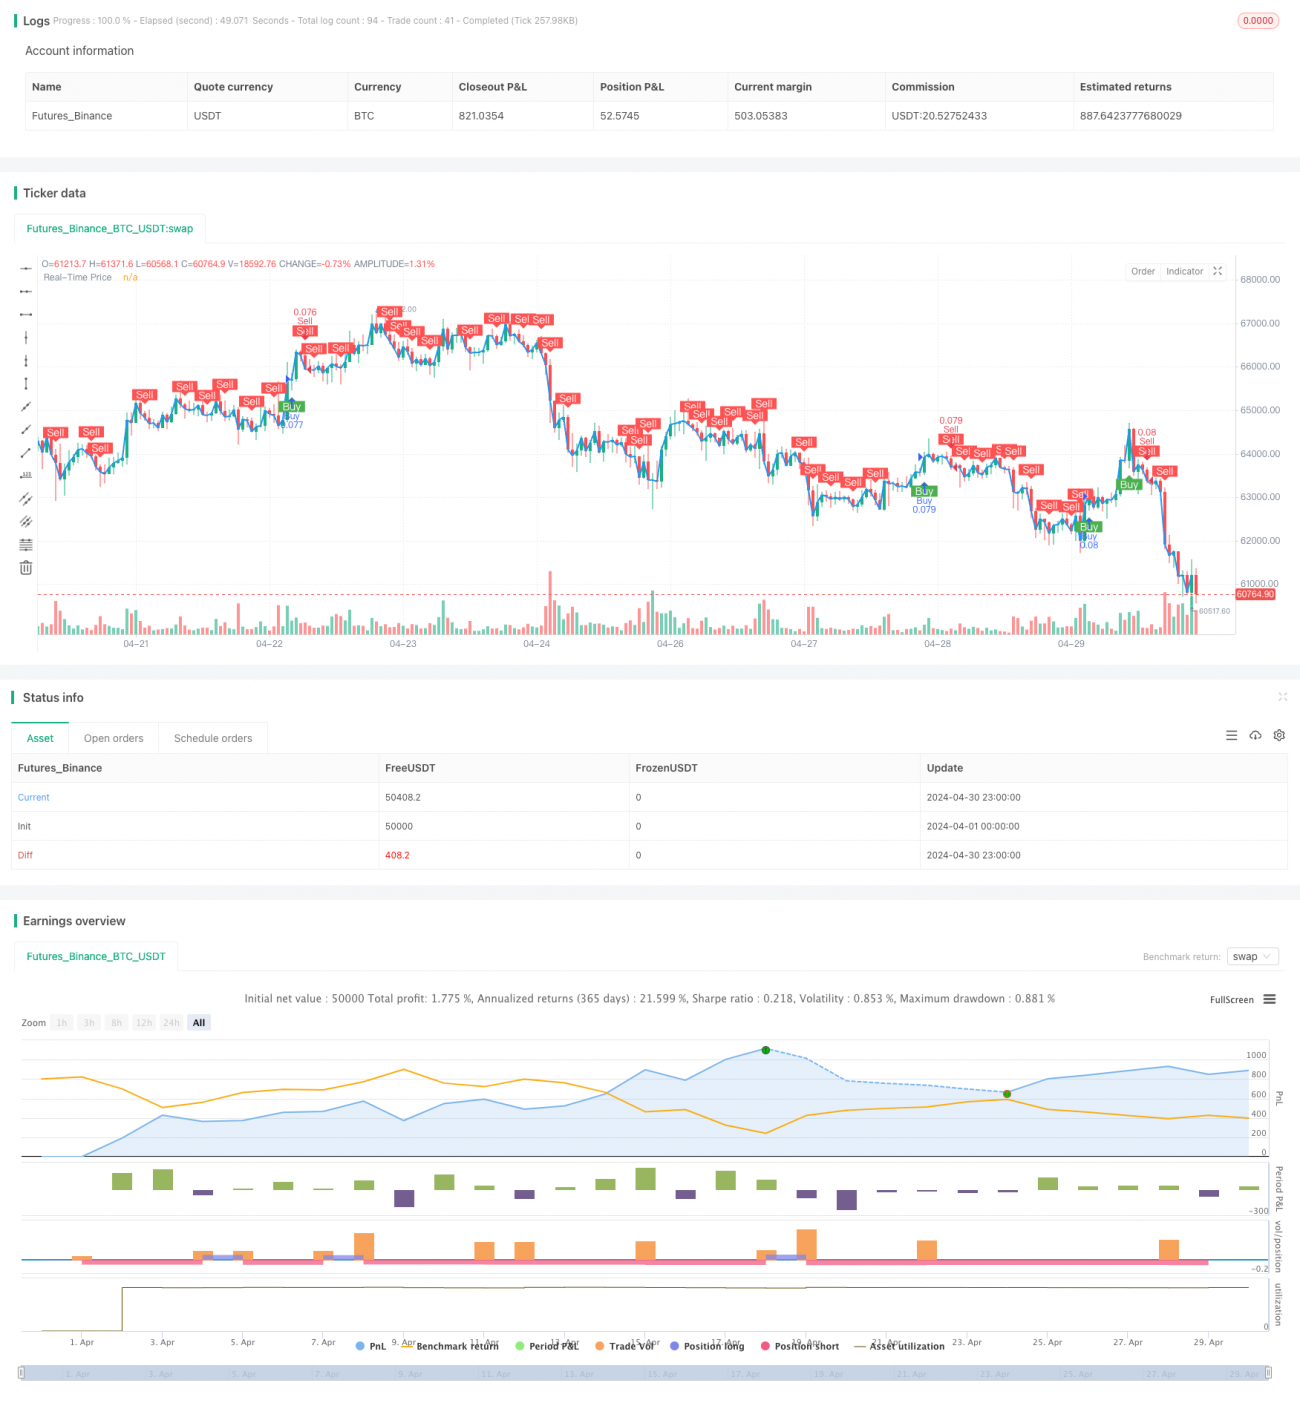
La stratégie combine un graphique de volume et des prix en temps réel pour générer des signaux d'achat et de vente en analysant les prix et la distribution du volume d'achat sur une période donnée. La stratégie calcule d'abord plusieurs niveaux de prix en fonction du prix actuel et du pourcentage de la fourchette de prix définie.
Principe de stratégie
- Plusieurs niveaux de prix sont calculés en fonction du prix actuel et du pourcentage de la fourchette de prix définie.
- Calculer le volume d'achats et de ventes pour chaque niveau de prix sur une période donnée et calculer le volume d'achats et de ventes cumulé.
- Déterminez la couleur des étiquettes en fonction du volume cumulé d'achats et de ventes et affichez les étiquettes ou dessinez des graphiques.
- La courbe des prix en temps réel.
- Calculer les indicateurs tels que l'EMA, le VWAP.
- Le rapport entre le prix et des indicateurs tels que l'EMA, le VWAP et les conditions de quantité de transaction permettent de déterminer si les conditions d'achat sont remplies. Si elles sont remplies et que le signal n'a pas été généré auparavant, un signal d'achat est généré.
- Si les conditions de vente sont remplies et qu'aucun signal n'a été généré auparavant, un signal de vente est généré. Si deux lignes négatives consécutives et aucun signal n'ont été générés auparavant, un signal de vente est également généré.
- Enregistre l'état actuel des conditions d'achat et de vente et met à jour l'état de la génération du signal.
Analyse des avantages
- La combinaison de graphiques thermiques de volumes de transactions et de prix en temps réel permet de visualiser la répartition des prix et des volumes de transactions et de fournir une référence pour les décisions de transaction.
- L'introduction d'indicateurs tels que l'EMA et le VWAP a enrichi le jugement conditionnel de la stratégie et amélioré la fiabilité de la stratégie.
- Les signaux d'achat et de vente sont plus complets et plus solides en tenant compte de facteurs tels que les prix, les indicateurs et le volume de transactions.
- Les conditions de restriction de la production de signaux sont définies pour éviter la production de signaux répétitifs en continu et réduire les signaux trompeurs.
Analyse des risques
- La performance de la stratégie peut être influencée par des paramètres tels que le pourcentage de la fourchette de prix, la période de rétrocession, etc. et doit être ajustée et optimisée en fonction des circonstances.
- Les indicateurs EMA, VWAP et autres ont eux-mêmes une certaine retardation et des limites qui peuvent être invalides dans certaines conditions de marché.
- Cette stratégie s'applique principalement aux marchés à forte tendance, où les faux signaux sont plus susceptibles de se produire en cas de choc.
- Les mesures de contrôle des risques de la stratégie sont relativement simples et il n'y a pas de moyens de gestion des risques tels que le stop-loss et la gestion des positions.
Direction d'optimisation
- L'introduction de plus d'indicateurs techniques et d'indicateurs de sentiment du marché, tels que le RSI, le MACD, les bandes de Brent, etc., pour enrichir le jugement stratégique.
- Optimiser les conditions de génération des signaux d'achat et de vente, améliorer l'exactitude et la fiabilité des signaux. L'analyse de plusieurs périodes peut être envisagée pour confirmer la direction de la tendance.
- Ajouter des mesures de contrôle des risques telles que la gestion des arrêts et des positions, définir des arrêts et des positions raisonnables, contrôler les seuils de risque pour les transactions individuelles.
- Optimiser et retester les paramètres de la stratégie pour trouver la combinaison optimale de paramètres et la portée du marché.
- Envisager de combiner cette stratégie avec d'autres stratégies pour tirer parti des avantages des différentes stratégies et améliorer la stabilité et la rentabilité globales.
Résumer
Cette stratégie a pour avantage de pouvoir visualiser la distribution des prix et des volumes de transactions et de prendre en compte de multiples facteurs pour générer des signaux. Cependant, la stratégie présente également des limites et des risques, tels que l'impact des paramètres, le retard des indicateurs, la dépendance à la tendance du marché. Par conséquent, dans la pratique, il est nécessaire d'optimiser et de perfectionner davantage la stratégie, comme l'introduction de plus d'indicateurs, l'optimisation des conditions de signal, le renforcement des contrôles de risque, etc.
/*backtest
start: 2024-04-01 00:00:00
end: 2024-04-30 23:59:59
period: 1h
basePeriod: 15m
exchanges: [{"eid":"Futures_Binance","currency":"BTC_USDT"}]
*/

//@version=5
strategy("Buy and Sell Volume Heatmap with Real-Time Price Strategy", overlay=true, default_qty_type=strategy.percent_of_equity, default_qty_value=10)

// Settings for Volume Heatmap- 1